World Journal of Nano Science and Engineering
Vol.3 No.3(2013), Article ID:36679,7 pages DOI:10.4236/wjnse.2013.33013
Evaluation of Energy Band Gap, Thermal Conductivity, Phase Transition Temperature and Elastic Response of PS/CdS Semiconducting Optical Nanocomposite
1Department of Physics, S. S. Jain Subodh P.G. College, Jaipur, India
2Semiconductor and Polymer Science Laboratory, Department of Physics, University of Rajasthan, Jaipur, India
Email: *wishalmathur@yahoo.co.in
Copyright © 2013 Vishal Mathur et al. This is an open access article distributed under the Creative Commons Attribution License, which permits unrestricted use, distribution, and reproduction in any medium, provided the original work is properly cited.
Received July 4, 2013; revised August 5, 2013; accepted August 12, 2013
Keywords: Polymer Nanocomposite; SAXS Analysis; Energy Band Gap; Phase Transition Temperature; Thermal Transport Property; Elastic Properties
ABSTRACT
Thick film of Polystyrene (PS)/CdS semiconducting optical nanocomposite has been synthesized by dispersing nanofiller particles of CdS in PS matrix. The nanostructure of the CdS particles has been ascertained through X-ray Diffraction (XRD) and Transmission Electron Microscopy (TEM). Small angle x-ray scattering analysis has been performed in order to ascertain nanocomposite character of the PS/CdS sample. Scanning Electron Microscopy (SEM) analyses of these samples have been carried out to establish the surface morphology. Optical Absorption Spectroscopy is used to measure the energy band gap of PS/CdS nanocomposite by using Tauc relation whereas Transient Plane Source Technique is used for the determination of thermal conductivity of the prepared samples. The phase transition temperature and elastic response of the prepared samples have been ascertained through Dynamic Mechanical Analyzer (DMA). This study reveals that the thermal conductivity, Young’s modulus and the toughness of the material are greatly influenced by the existence of interfacial energetic interaction between dispersed CdS nanofiller particles and matrix of PS.
1. Introduction
Polymer nanocomposites are of great industrial and scientific interest, since they offer the potential for tailoring on a new scale. The thermal, mechanical and optical properties of nanofilled polymers are exciting areas of research. This is particularly true because of the possibility of creating composites with unique combinations of functionalities, such as thermally conducting composites with good mechanical properties that are optically clear. Such properties can be realized because nanoparticles, with diameters distinctly below the Rayleigh scattering limit, still display their solid-state physical properties when embedded in transparent matrices. Optical composites have been defined as composites consisting of optically active nanoparticles embedded in a transparent host material, often a polymer [1].
Among various nanofillers used so far to prepare nanocomposites, semiconducting nanoparticles have attracted much attention because of their characteristic properties resulting from the “quantum size effect” which are significantly different from those of the corresponding bulk materials [2]. Many studies have been focused on cadmium sulfide (CdS) because of its high photosensitivity and potential application in photo-conducting cells and in devices for applications in solar cells and photo-detectors.
An important field of interest for semiconductor nanoparticles is their incorporation within polymers. In fact, inorganic-organic nanocomposite-based devices can be easily processed with consequent control over different electro-optical properties. Efforts have been made in the recent years to study various properties of CdS-polymer nanocomposites. Marzia Pentimalli et al. [3] reported a solid state nuclear magnetic resonance study on the thermolytic synthesis of CdS nanoparticles in a polystyrene matrix. The study demonstrated that the annealing under vacuum produced very good quality CdS/PS nanocomposites with a low content of undesired impurities. Li Chen et al. [4] reported controllable synthesis of CdS nanocrystal-polymer transparent hybrids by using poly methyl methacrylate (PMMA) as a polymer matrix. The study reveals thermogravimetric analyses (TGA) measurement displays CdS-PMMA hybrids possess better thermal stability compared with pure PMMA polymer. The fluorescence measurement shows that CdS nanocrystals and CdS-PMMA hybrids exhibit good optical properties.
In this way, in recent times, the industrial demand for higher performance polymers with faster processing times has caused polymers to be gradually replaced by different engineered polymeric nanocomposites. Polystyrene (IUPAC Poly (1-phenylethane-1,2-diyl)), abbreviated as PS, is an aromatic polymer made from the aromatic monomer styrene, a liquid hydrocarbon that is commercially manufactured from petroleum by the chemical industry [5]. PS is considered as an excellent polymer suitable for various commercial and domestic applications.
In view of these facts here in the present paper, we demonstrate the simplest chemical method for the preparation of CdS/PS semiconducting optical nanocomposite. The morphological characterizations and evaluation of energy band gap, thermal conductivity, phase transition temperature and elastic response of prepared nanocomposite specimen have been ascertained. This study reveals that PS/CdS semiconducting optical nanocomposite shows excellent film formability, good transparency and interesting results.
2. Experimental
2.1. Material Preparation
2.1.1. CdS Nanoparticle Preparation
In order to prepare Polymer/nanocomposite samples, firstly CdS nano-particles have been prepared by simple chemical method using CdCl2 and H2S gas produced from thiourea [6]. The nanostructure of the CdS particles has been ascertained through X-ray Diffraction (XRD) and Transmission Electron Microscopy (TEM). The wide angle X-ray diffraction pattern has been recorded using a Philips 1840. The nanocrystallites powder was pressed inside the sample holder and, and the X-ray diffraction data was collected in the step scan mode. Transmission Electron Microscopy (TEM) on the nanocrystallite sample was carried out on JEOL-3010 electron microscope.
Figure 1 shows the XRD pattern of CdS nanoparticle. The presence of broad peaks confirms the nano size of the prepared nanoparticles. The average particle size obtained from Debye Scherrerr formula [7] is 3 nm, which is also verified with TEM results as shown in Figure 2.
2.1.2. PS/CdS Semiconducting Optical Nanocoposite Preparation
Now for the preparation of PS/CdS composite, PS of
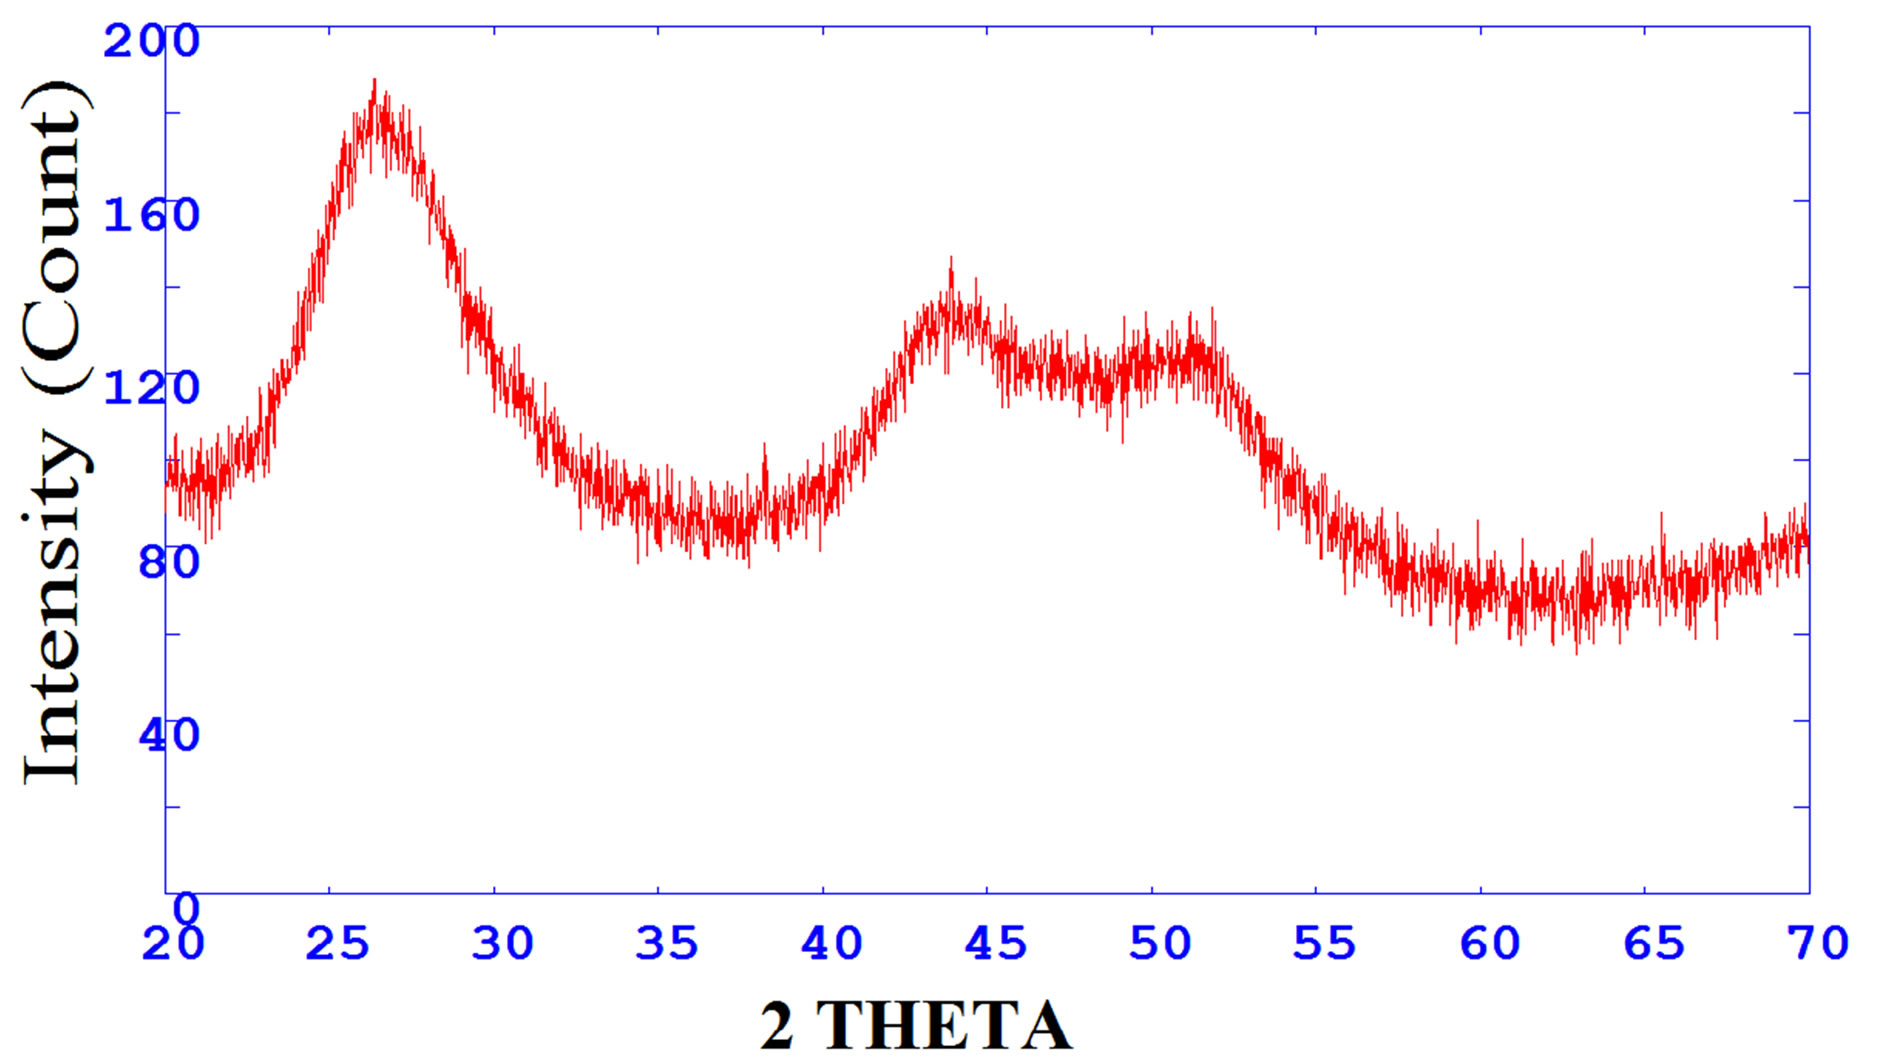
Figure 1. The XRD pattern of CdS nanoparticles.
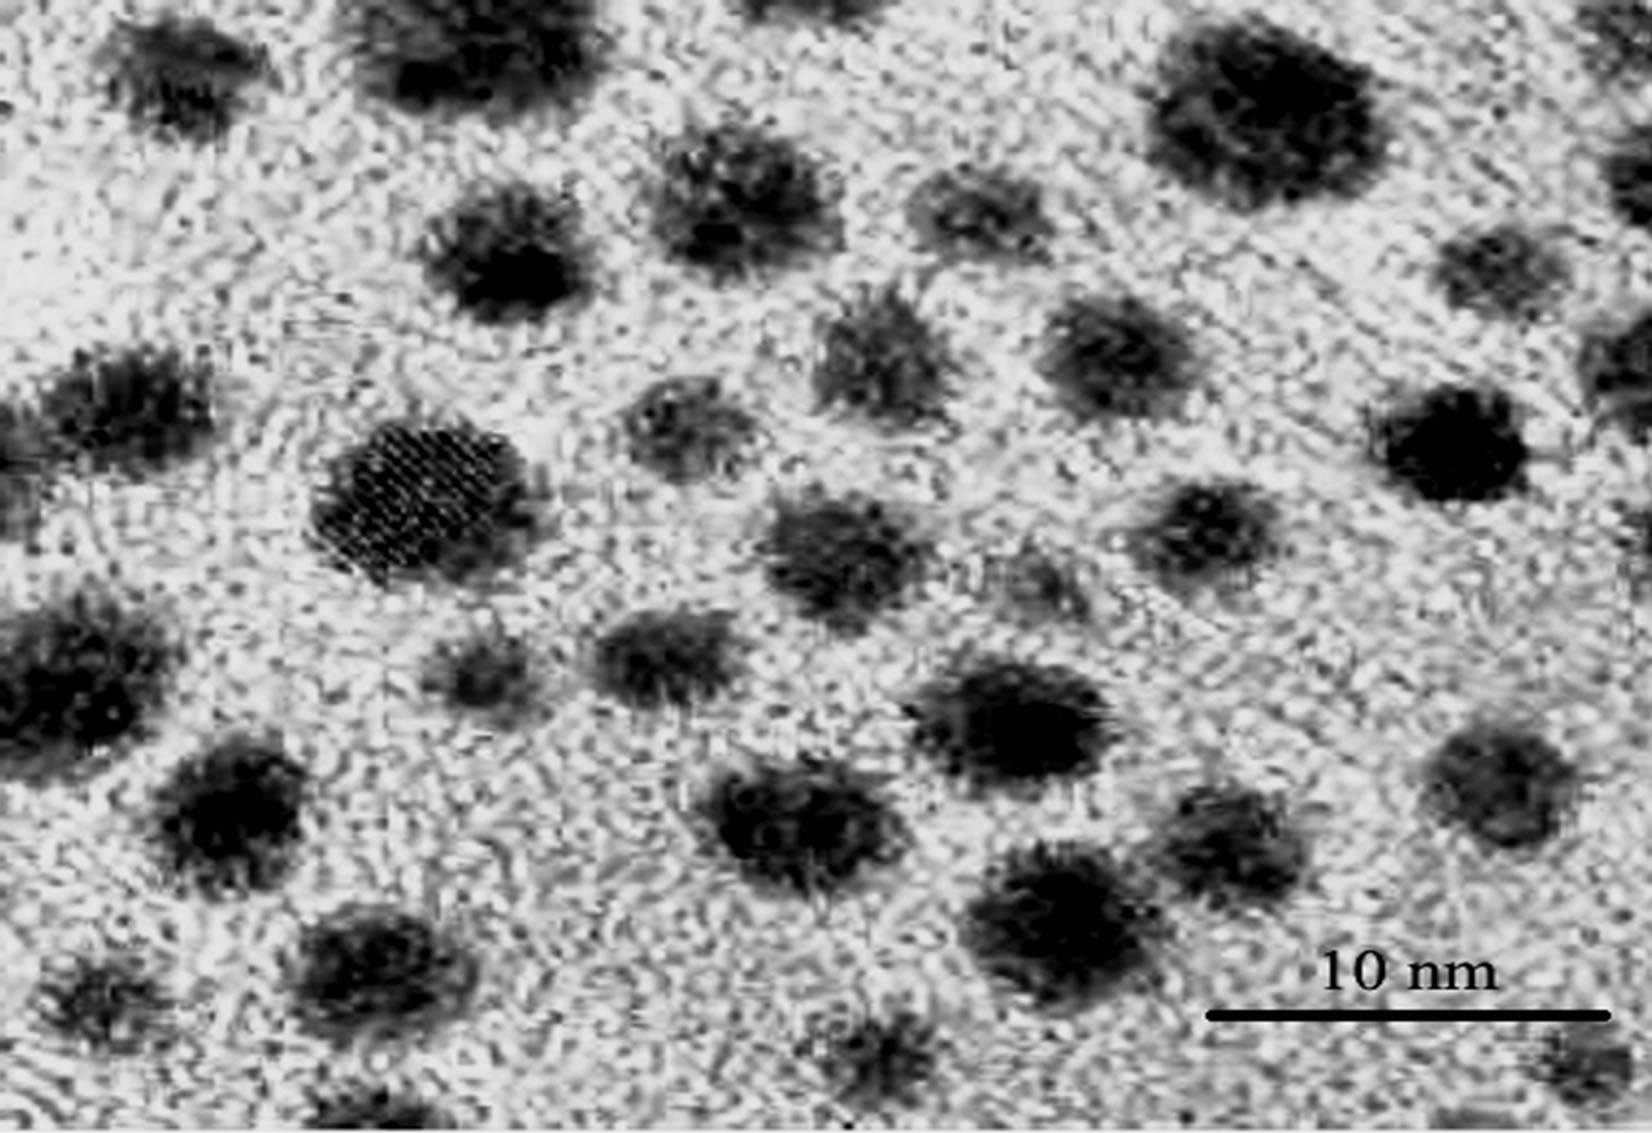
Figure 2. TEM image of CdS nanoparticles.
laboratory grade was dissolved in Tetra hydro furane (THF) solvent and 10% of PS chalcogenide CdS nanoparticles was dispersed in this PS film with a thickness of ~0.05 mm. The solvent is allowed to evaporate slowly over a period of 48 hours. This solution was then stirred with the help of magnetic stirrer and then poured into flat-bottomed petri dishes to form hours in dry atmosphere. The so obtained film was then peeled off and dried in vacuum at 60˚C, well below the boiling point of solvent to avoid bubbling, for 48 hours in order to ensure the removal of the solvent [8,9].
2.2. Measurement Techniques
2.2.1. UV-Visible Spectroscopy
Ultraviolet-visible spectroscopy or ultraviolet-visible spectrophotometry (UV-Vis or UV/Vis) involves the spectroscopy of photons in the UV-visible region. This means it uses light in the visible and adjacent (near ultraviolet (UV) and near infrared (NIR)) ranges. The absorption in the visible ranges directly affects the color of the chemicals involved. In this region of the electromagnetic spectrum, molecules undergo electronic transition. This technique is complementary to fluorescence spectroscopy, in that fluorescence deals with transitions from the excited state to the ground state, while absorption measures transitions from the ground state to the excited state. The absorption spectra of these samples have been recorded at the room temperature using Spectrophotometer. For these spectra, the prepared nanocomposite sample is directly exposed to UV rays. The energy band gap was estimated using the Tauc relation [1].
 (1)
(1)
where αhν is the photon energy, Eg is the band gap, n = 1/2 for direct band gap transition and A is constant which is different for different transitions [10].
2.2.2. Dynamic Mechanical Analyzer
Dynamic Mechanical Analyzer (TRITEC-2000 DMA) is a sensitive technique that characterizes the mechanical response of materials by monitoring property change with respect to the temperature and frequency of applied sinusoidal stress. DMA film samples were cut to be between 4 - 6 mm in width and 10 mm in length. The average thickness of each sample is of 100-micrometer order. After adjusting DMA device in tension mode, the furnace was sealed off, sample scanned over a temperature range from room temperature to 140˚C. The sample was held at that temperature for 5 minutes. The heating/ ramp rate was 2˚C/min for all temperature scan tests. Frequency of oscillations was fixed at 1 Hz and strain amplitude 0.01 mm within the linear visco-elastic region. The storage modulus E′, loss modulus E″ and mechanical loss factor (Tan δ) have been determined during the test as a function of increasing temperature [11,12].
2.2.3. Hot Disk Thermal Constants Analyser
Thermal transport properties of PS-CdS thick film were measured through the Hot Disk Thermal Constants Analyzer. It is based on transient plane source (TPS) technique. A Hot Disk Sensor is used for this purpose, which is a plane sensor consisting of a resistive pattern is etched out of a 10 µm thick Nickel foil. The pattern is covered on both sides by an insulation material to give mechanical strength to the sensor and to allow measurements on electrical conducting materials. On applying a certain output of power in the sensor, the temperature increase of the “sensing” Nickel pattern can be divided into two parts, which is particularly obvious if a metallic sample with high thermal conductivity is being studied. One part of the temperature increase is the temperature drop across the insulating layer and the other part is the transient increase of the temperature of the metal surface. The temperature drop across the insulating layer becomes constant after a short initial period of the transient. According to the theory given in this reference the thermal conductivity of the thin film sample material can be extracted from the following relation.
 (2)
(2)
where P is the total output power, A is the area of the conducting pattern, λ is the thermal conductivity of the thin sample, ∆T is the fully developed temperature difference across one of the insulating layers and ∆x is the thickness of the thin sample pieces [13].
3. Results and Discussion
3.1. Small Angle X-Ray Scattering Analysis
SAXS measurements were performed on an X’Pert Pro MPD system to investigate the size of the CdS-nanoparticles within nanocomposite sample. Figure 3 show the scattering intensity as a function of angle (2θ) for PS and its CdS nanocomposite respectively. It is observed that SAXS pattern of PS/CdS embedded polymer nanocomposites show higher scattering intensity as compared to without CdS dispersed samples. The nano-crystals of CdS act as independent scattering centers in the respective polymer matrices.
Figure 4 shows the particle size distribution curves for the PS/CdS nanocomposite. The particle size distribution report of this nanocomposite suggests that the distribu-
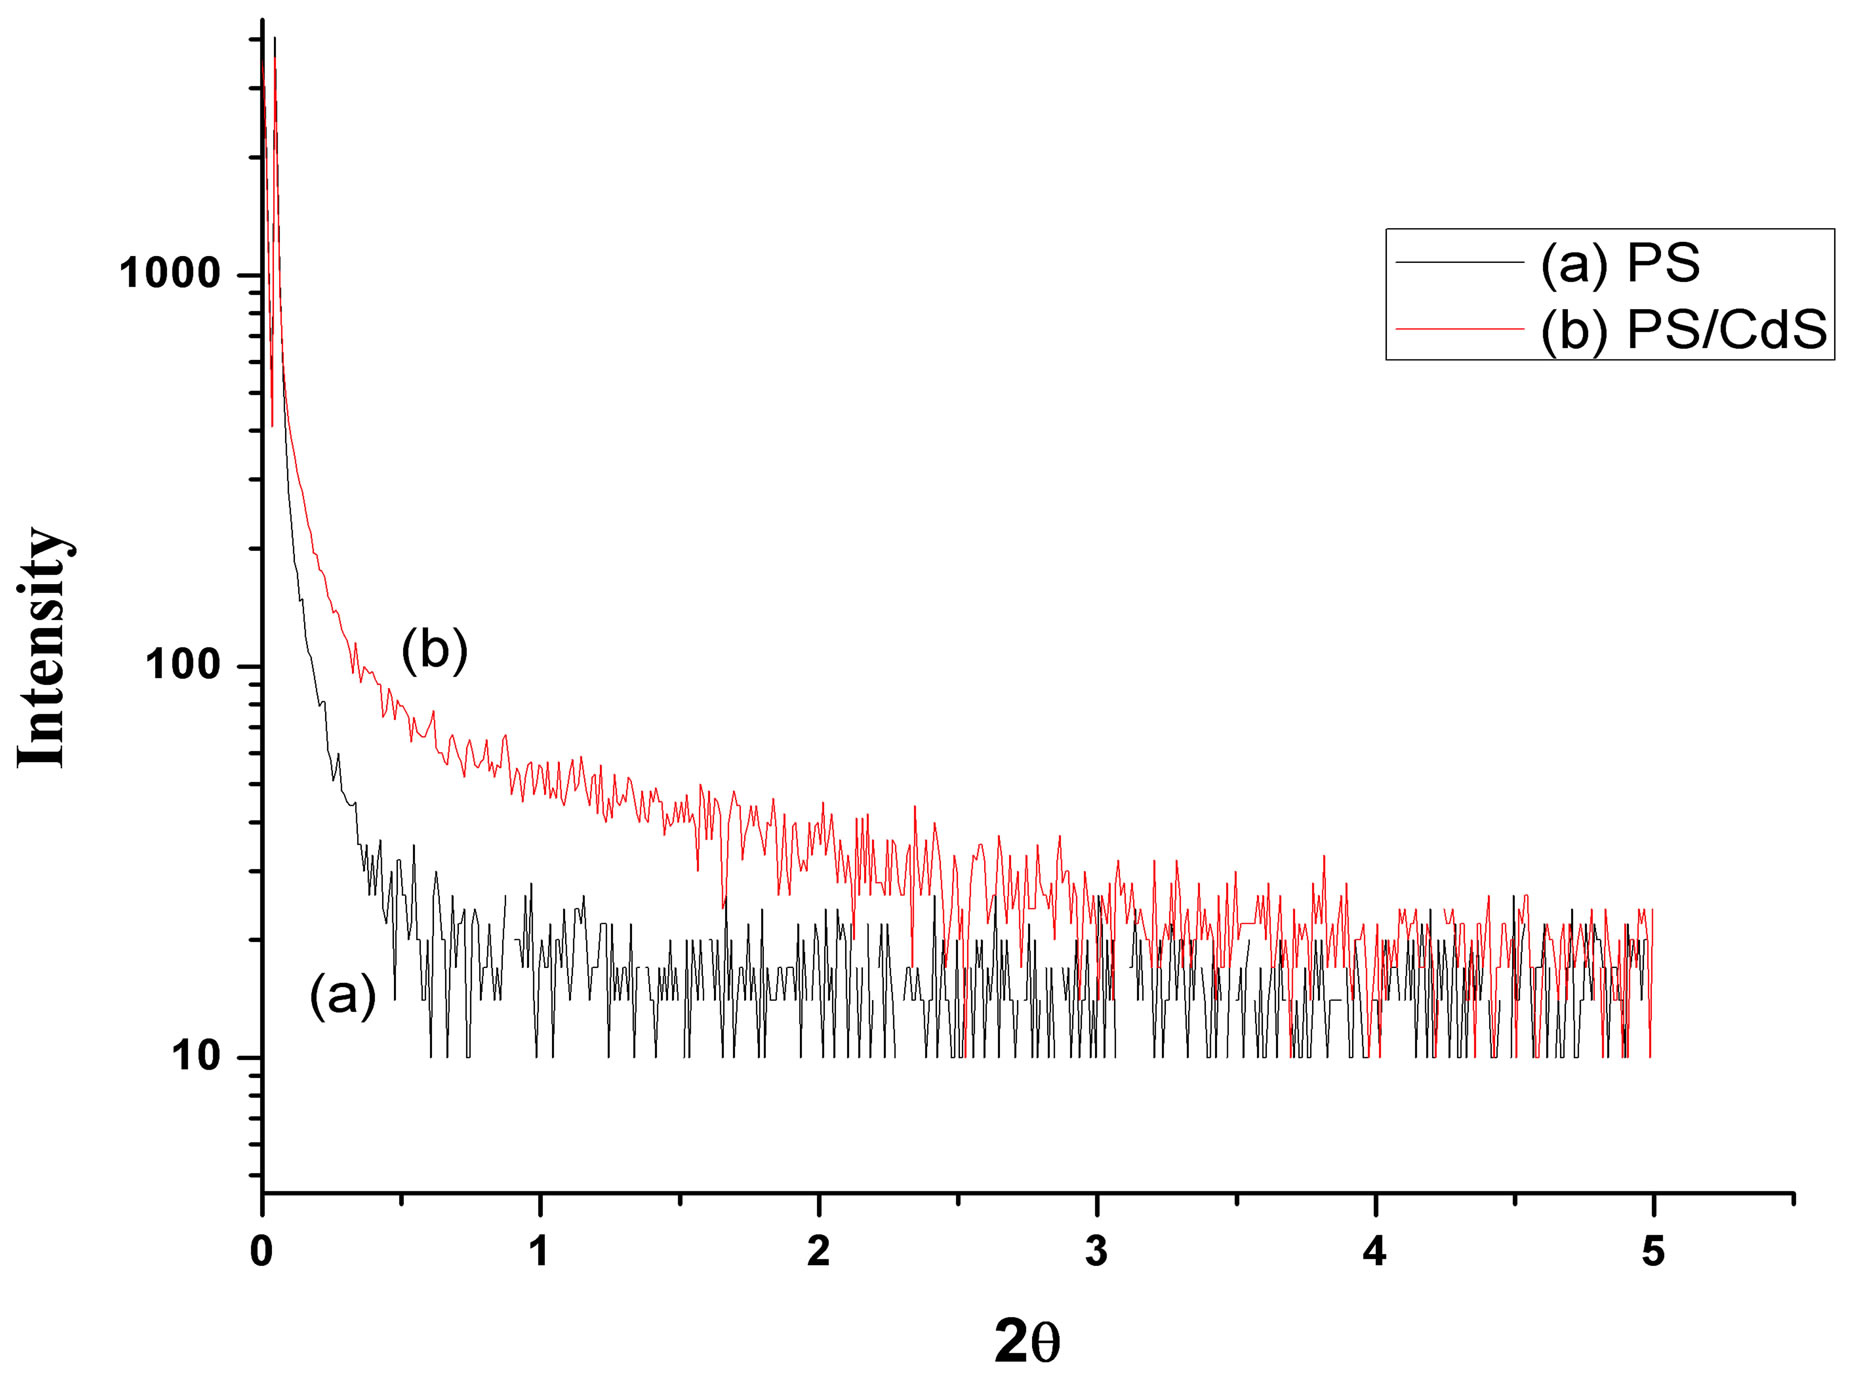
Figure 3. SAXS pattern of PS & PS-CdS.

Figure 4. Particle size distribution curve for PS-CdS nanocomposite sample.
tion is well approximated by a Gaussian. It is observed that particle size distribution curve is approximately centered at R = 1.5 nm and it means that the most frequent radius (R) of CdS nanofillers is 1.5 nm and major volume fraction of these CdS nanoparticles is exhibiting radius within 0.7 nm to 2.4 nm.
3.2. Morphological Characterization
The surface morphology of the samples has been characterized by Scanning Electron Microscopy (SEM) using a SEM (Quanta Fe-200 model). Figure 5(a) shows the micrographs of Pure PS whereas Figure 5(b) show SEM micrograph of PS/CdS nanocomposite specimen. From the figures it is observed that in SEM micrographs of PS/CdS, the concentration of CdS nanoparticles on the exterior surfaces of PS phase makes possible large number of contacts and nanophase separation is observed in this nanocomposite sample. In this way SEM images of PS/CdS showed some level of flocculation of CdS nanoparticles, but of varying sizes which alters the morphology of the pure PS matrix.
 (a)
(a) (b)
(b)
Figure 5. SEM micrographs of (a) Pure PS (b) PS/CdS samples.
3.3. Energy Band Gap Study
The UV-vis absorption spectrum of CdS nanoparticles in PS-matrix is as shown in Figure 6. The absorption edge presents the band gap of the PS/CdS nanocomposite.
The optical band gap (Eg) value was obtained from optical absorption spectra by plotting (ahn)2 versus hn, as shown in Figure 7, where a is the optical absorption coefficient and hn the photon energy. The energy band gap is determined through the Tauc-relation [1] and for PS/ CdS optical nanocomposite it is found 3.44 eV.
3.4. Thermal Conductivity Measurement
Thermal conductivity of pure PS and PS/CdS nanocomposite thin film samples (thickness ≈ 0.1 mm) have been determined through transient plane source technique using thin film method with an input power of 0.5 W for 5 seconds at room temperature (303 K). It is observed that at room temperature the value of effective thermal conductivity for pure PS and PS/CdS samples were 0.149 Wm−1K−1 and 0.202 Wm−1K−1 respectively.

Figure 6. Absorption spectra of CdS nanoparticles in PS matrix.
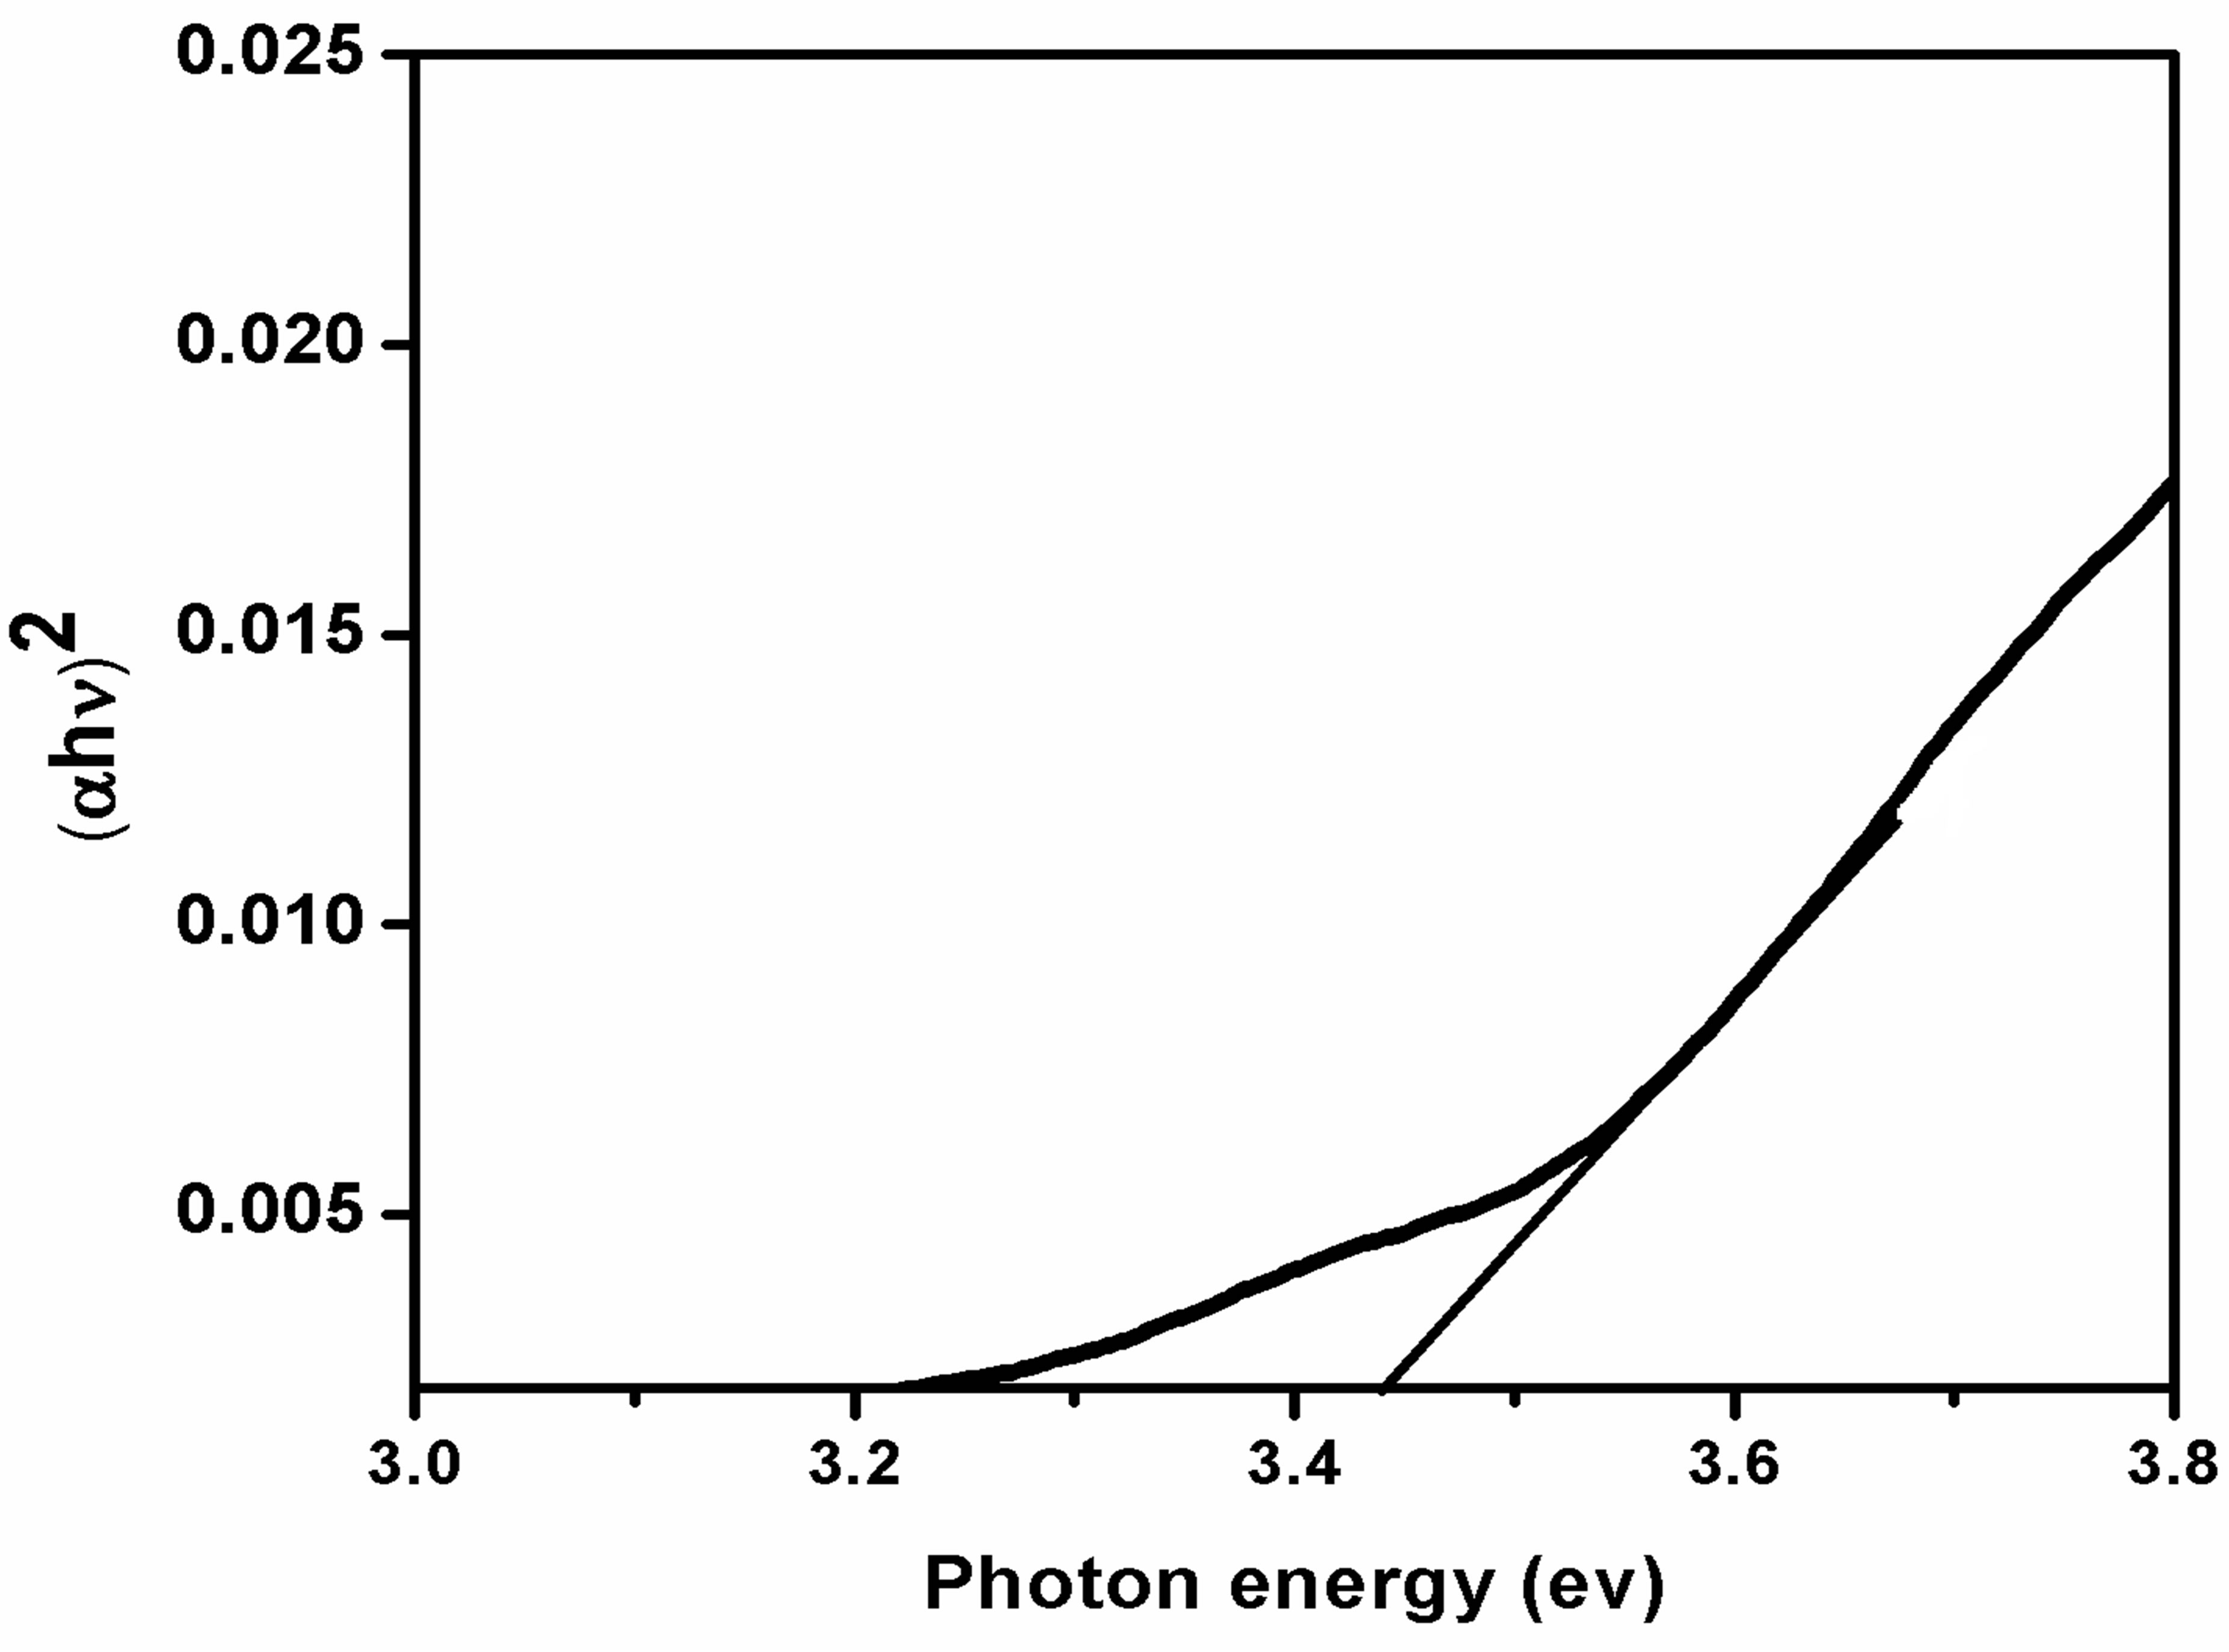
Figure 7. Energy band gap determination of CdS nanoparticles in PS matrix.
As we know in non-metallic material system like polymer and polymer blends, the thermal energy is mainly carried by phonons, which have a wide variation in frequency and the mean free paths. The heat carrying phonons often have large wave vectors and mean free paths in the order of nanometer range at room temperature. In this way the dimensions of the nanoparticles become comparable to the mean free paths which would lead to significant improvement in phonon transport within the nanocomposite materials. The phonon confinement and quantization of phonon transport results modification in thermal properties. Since CdS nanoparticles having higher thermal conductivity and act as cross-linking centers between the polymer molecules therefore promptly subserve for the phonon-phonon conduction in that respective polymer network. This causes the enhancement of thermal conduction in PS/CdS nanocomposites specimen.
3.5. Phase Transition Temperature Study
Polymeric materials are basically characterized by two major transition temperatures-phase transition temperature (Tg) and crystallization melting temperature (Tm) which characterize its properties over a wide temperature range [14]. For almost all polymers, there is temperature boundary, above which the substance remains soft, flexible and rubbery and below which it becomes hard, brittle and glassy. This temperature below which a polymer is hard and above which it is soft is known as phase transition temperature (Tg). The phase transition temperature (Tg) of a polymer material is correlated with the segmental motion of the polymer chains [15].
Figure 8 shows the variation of Tan δ with temperature for pure PS and PS/CdS nanocomposite respectively. This plot shows that the value of Tan δ for both the samples firstly increase to a maximum value and beyond a characteristic temperature decreases with increase in temperature. This characteristic temperature is identified as a phase transition temperature “Tg” (also known as alpha transition temperature) [12,16].
The observed phase transition temperature Tg for pure PS and PS/CdS nanocomposite samples are 113.01˚C and 121.91˚C respectively. A significant improvement of 7.8% in phase transition temperature is observed due to dispersion of CdS nanoparticle in PS matrix.
As morphology characterizations suggest that the pure PS polymer matrix consist of number of voids/porous sides. The dispersed CdS nanoparticles segregate on these porous sides of basic PS polymer matrix in PS/CdS nanocomposite specimen and form a localized dense system. In this way some interfacial energetic interaction is developed between dispersed CdS nanoparticles and molecules of PS polymer matrix. It causes an improvement in phase transition temperature acordingly. This study also reveals that the elastic behavior of basic PS matrix changes to viscous behavior because the value of Tan δ decreases on dispersing CdS nanoparticle, i.e. for PS/CdS nanocomposite sample.
3.6. Elastic Property
Figure 9 shows the tensile stress-strain characteristics of PS/CdS nanocomposite samples. It is observed that PS matrix becomes more brittle due to the dispersion of CdS nanoparticles. However, Young’s modulus of the PS matrix remains almost constant but fracture energy of PS matrix trims down from 0.029 J to 0.018 J. The ultimate tensile strength and fracture strain are observed 8.84 MPa and 0.83%, respectively for this nanocomposite.
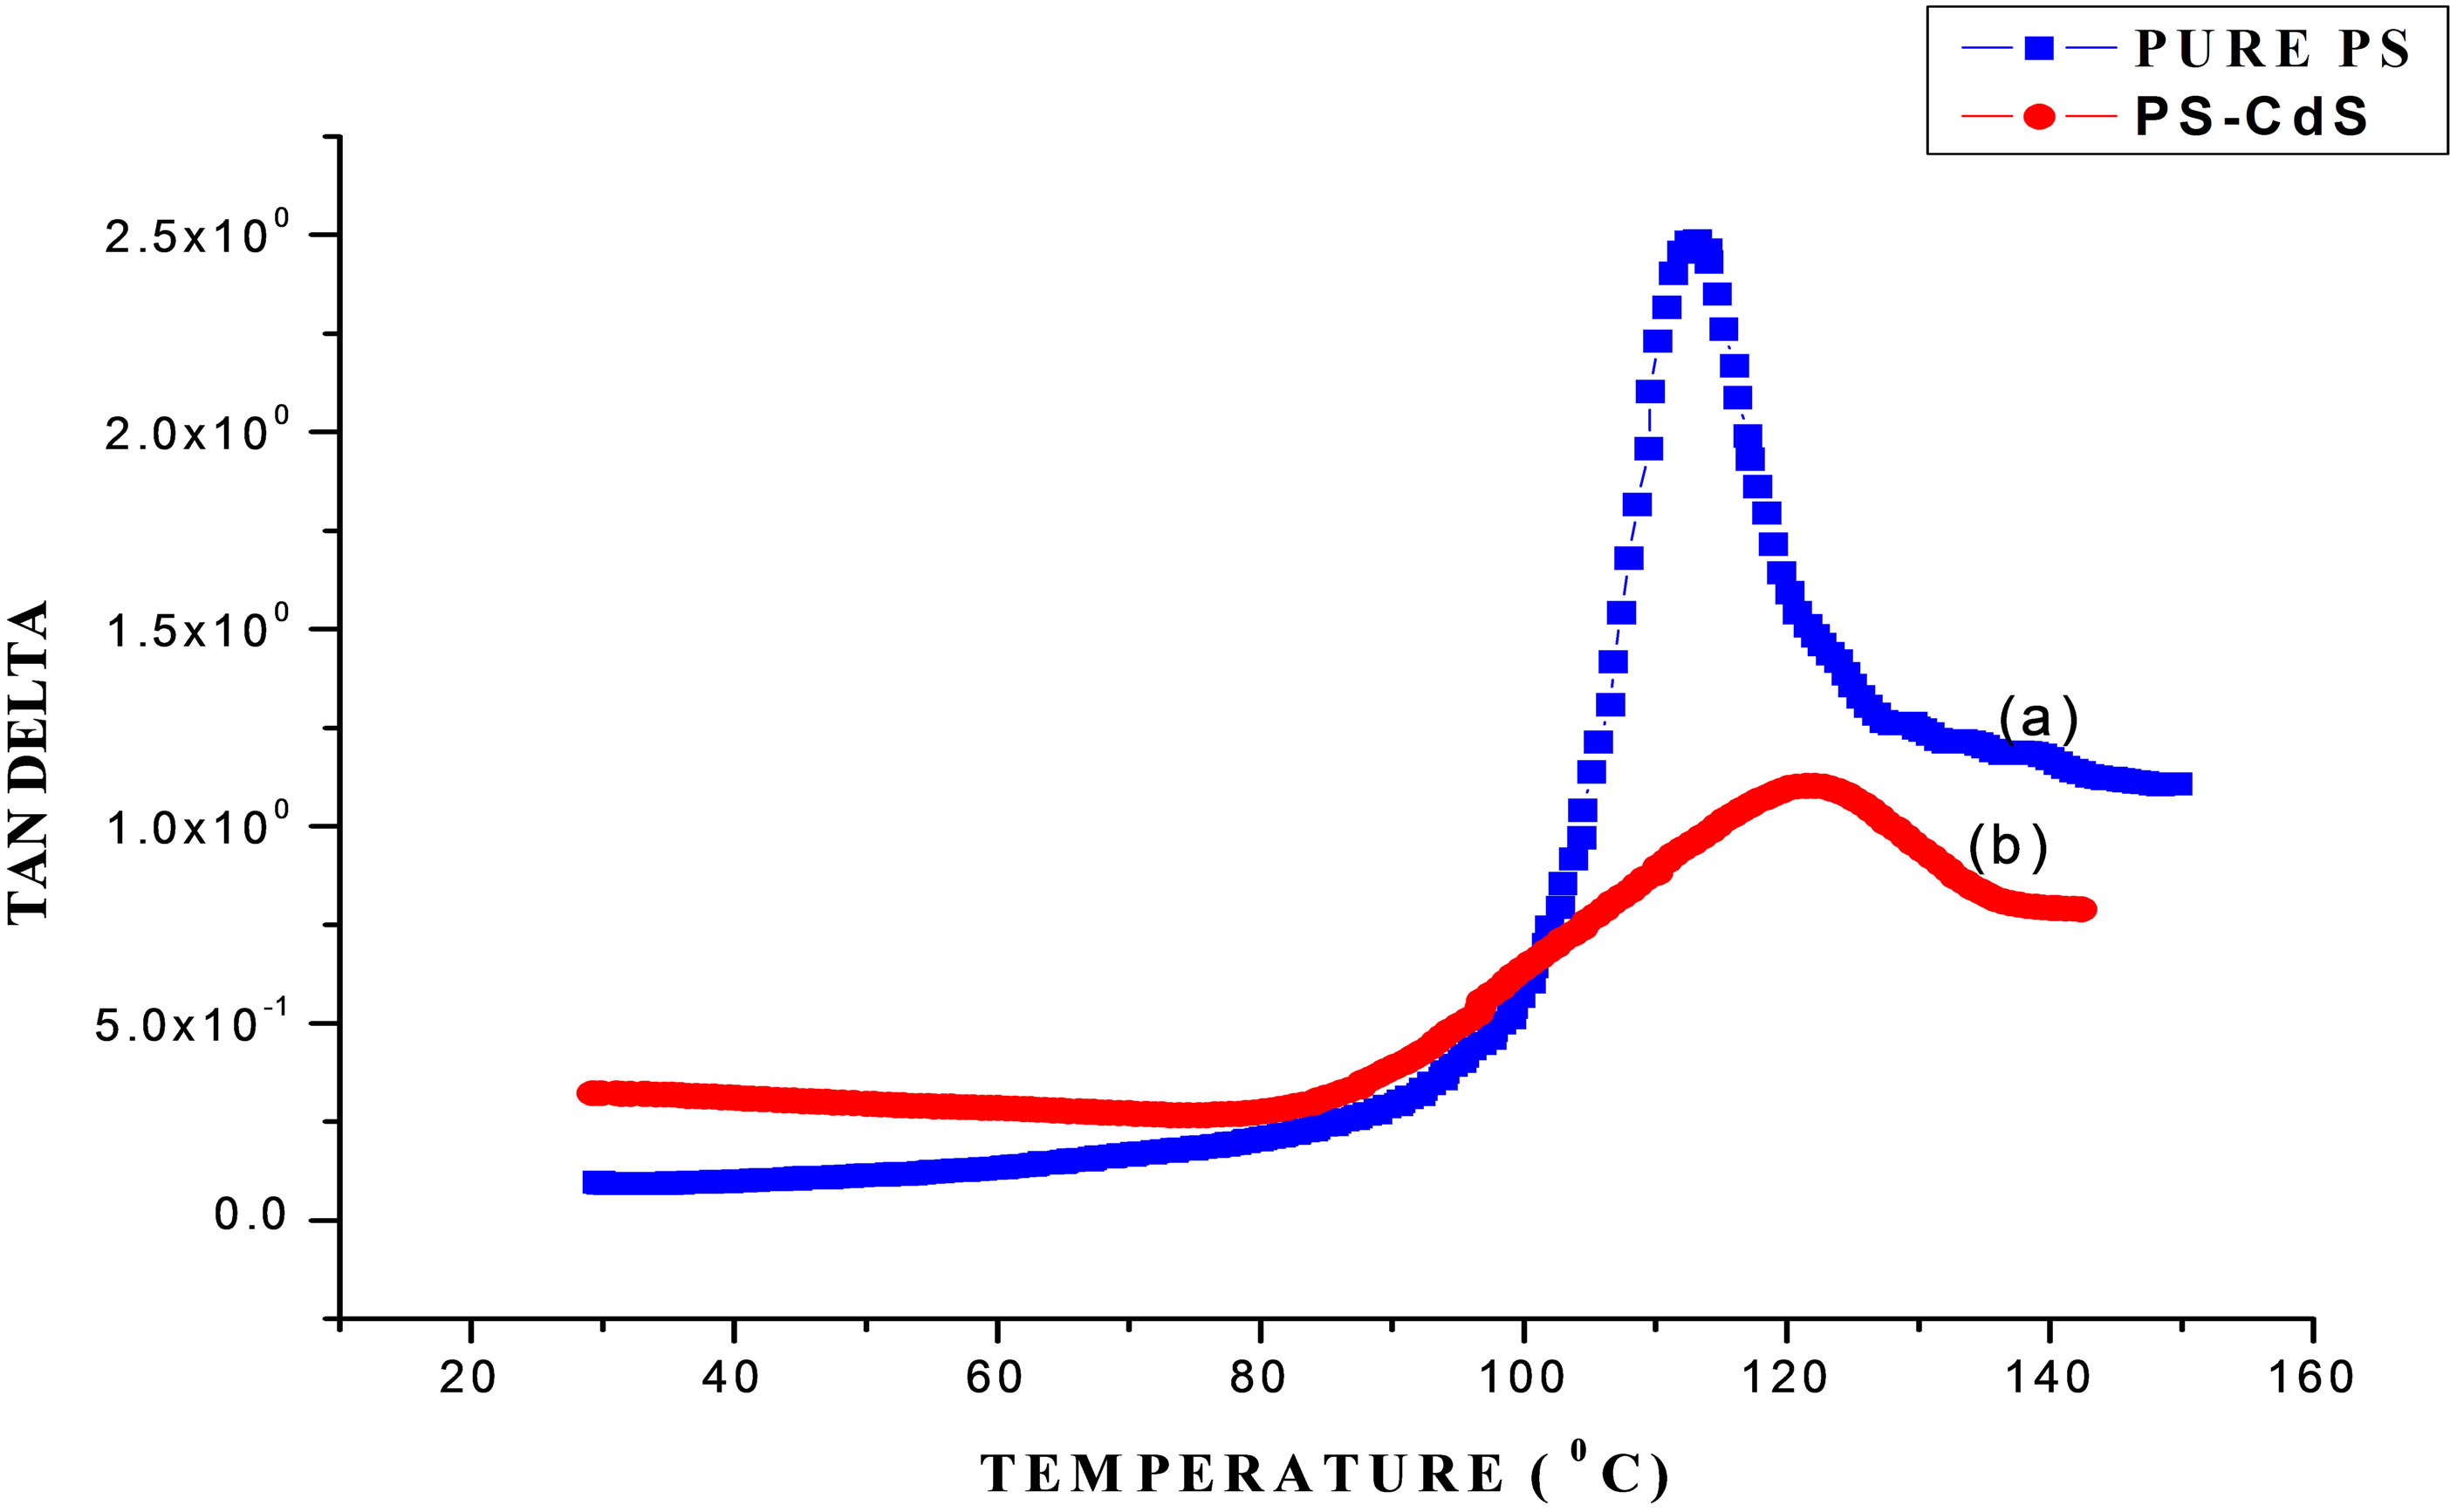
Figure 8. Plot of tan delta versus temperature for pure PS & PS-CdS samples.
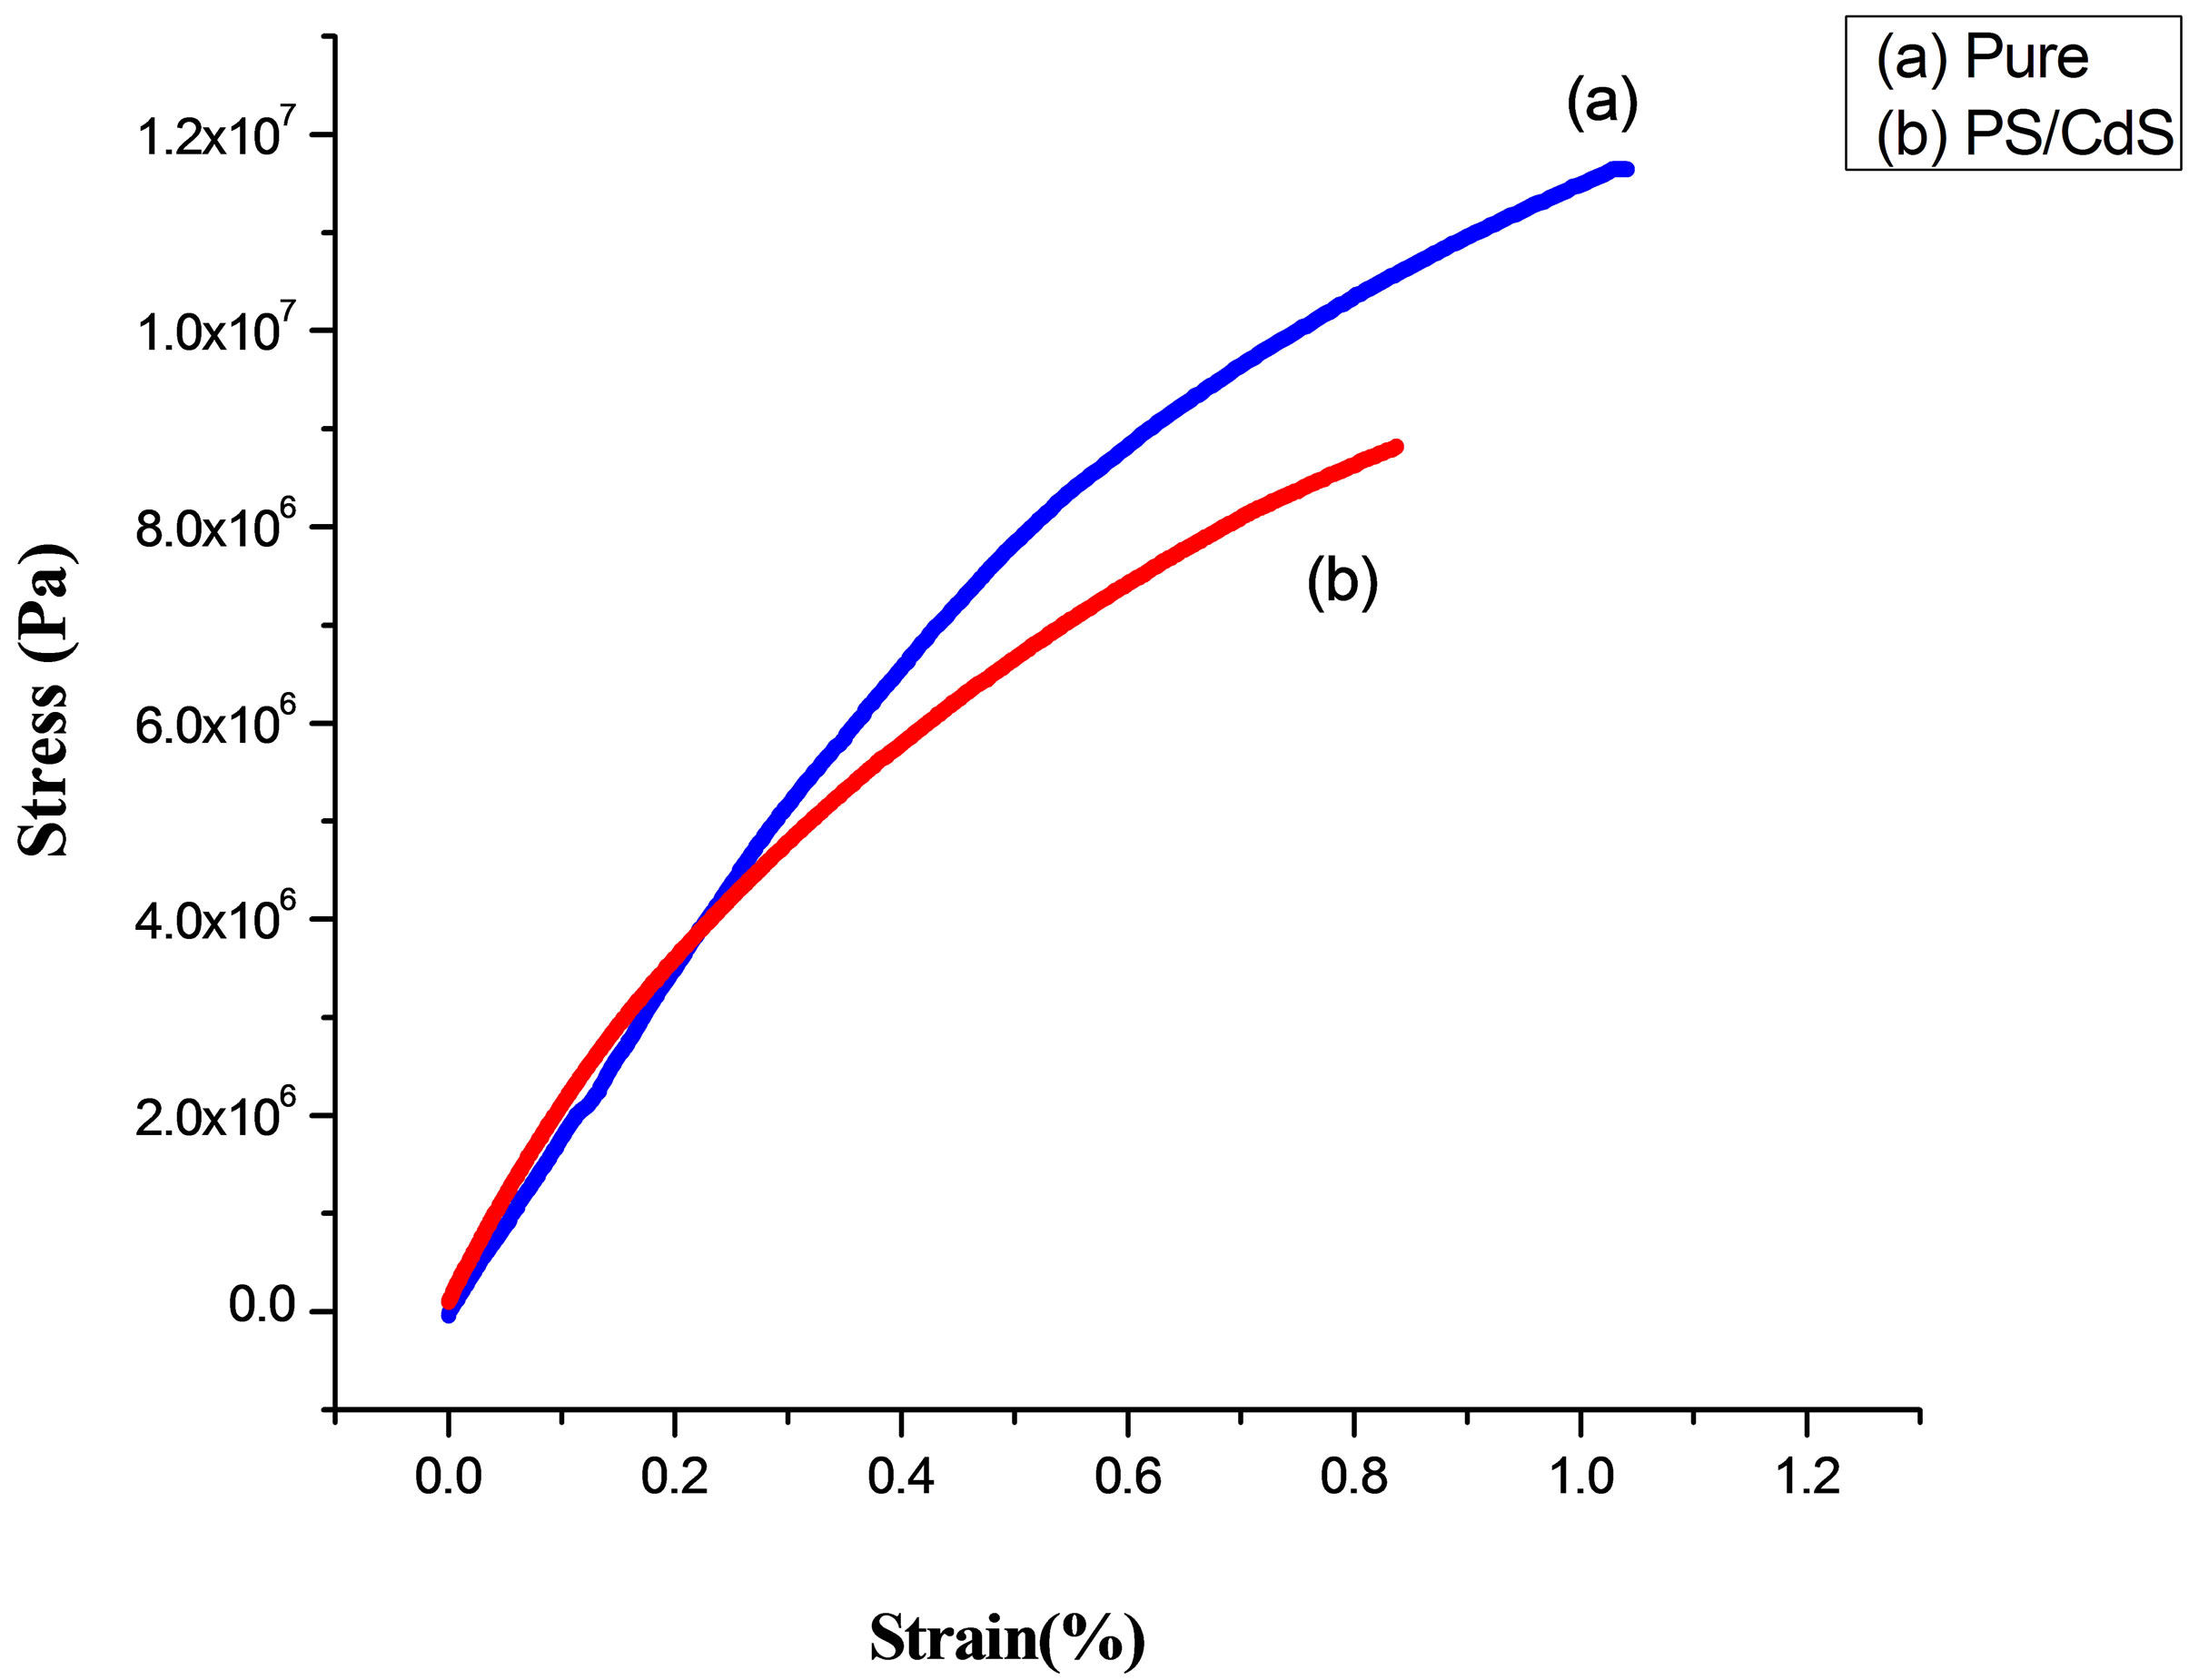
Figure 9. Stress-Strain behavior of PS & PS/CdS.

Table 1. Comparative Elastic response offered by pure PS and PS/CdS nanocomposites.
It is seemed due to the fact that the dispersion of CdS nanoparticles disturbs the molecular chain network of PS matrix. This interruption causes decrease in covalent bond molecular network and increase in van der waal interaction within the nano-CdS dispersed PS matrix. This inturn induces more brittleness in the PS matrix and causing loss in strength and fracture energy of the system. Table 1 depicts the comparative Elastic response offered by pure PS and PS/CdS nanocomposites.
4. Conclusions
In the light of findings reported in this work, some fundamental facts have been revealed as follows:
• This study shows that the optical, thermal and mechanical properties of PS are significantly influenced by the dispersion of CdS nanofiller particles. Prepared PS/CdS semiconducting optical nanocomposite shows same optical properties as the CdS nanoparticles itself shows.
• The phase transition temperature (Tg) increases due to dispersion of CdS nanoparticle in PS matix.
• The thermal conductivity of PS/CdS nanocomposite specimen is found to be increased because these dispersed CdS nanoparticles have higher thermal conductivity and form a bridged polymer network leading to the increase in the phonon-phonon interaction within the polymer nanocomposite matrix.
• Elastic response of PS/CdS nanocomposites phase is significantly changed as compared to pure PS polymeric phase. It is also observed that PS matrix becomes more brittle due to dispersion of CdS nanoparticles.
REFERENCES
- D. Barber, C. R. Pollock, L. L. Beecroft and C. K. Ober, “Amplification by Optical Composites,” Optics Letters, Vol. 22, No. 16, 1997, p. 1247. doi:10.1364/OL.22.001247
- M. Z. Rong, M. Q. Zhang, H. C. Liang and H. M. Zeng, “Surface Modification and Particles Size Distribution Control in Nano-CdS/Polystyrene Composite Film”, Chemical Physics, Vol. 286, No. 2-3, 2003, pp. 267-276. doi:10.1016/S0301-0104(02)00928-X
- M. Pentimalli, F. Antolini, E. M. Bauer, D. Capitani, T. Di Luccio and S. Viel, “A Solid State Nuclear Magnetic Resonance Study on the Thermolytic Synthesis of CdS Nanoparticles in a Polystyrene Matrix,” Materials Letters, Vol. 60, No. 21-22, 2006, pp. 2657-2661. doi:10.1016/j.matlet.2006.01.060
- L. Chen, J. Zhu, Q. Li, S. Chen and Y. Wang, “Controllable Synthesis of Functionalized CdS Nanocrystals and CdS/PMMA Nanocomposite Hybrids Original Research Article,” European Polymer Journal, Vol. 43, No. 11, 2007, pp. 4593-4601. doi:10.1016/j.eurpolymj.2007.08.008
- Wikipedia. http://en.wikipedia.org/wiki/Polystyrene
- V. Mathur, M. Dixit, K. S. Rathore, N. S. Saxena and K. B. Sharma, “Tensile Study of PVC-CdS Semiconducting Nanocomposite,” Rapid Communication Optoelectronics and Advanced Materials, Vol. 7, 2009, pp. 685-687.
- K. S. Rathore, D. Patidar, Y. Janu, N. S. Saxena, K. B. Sharma and T. P. Sharma, “Structural and Optical Characterization of Chemically Synthesized ZnS Nanoparticles,” Chalcogenide Letters, Vol. 5, No. 6, 2008, pp. 105- 110.
- V. Favier, G. R. Canova, S. C. Shrivastava and J. Y. Cavaille, “Mechanical Percolation in Cellulose Whisker Nanocomposites,” Polymer Engineering & Science, Vol. 37, No. 10, 1997, pp. 1732-1739. doi:10.1002/pen.11821
- L. Chazeau, J. Y. Cavaille, G. Canova, R. Dendievel and B. Boutherin, “Viscoelastic Properties of Plasticized PVC Reinforced with Cellulose Whiskers,” Journal of Applied Polymer Science, Vol. 71, No. 11, 1999, p. 1797. doi:10.1002/(SICI)1097-4628(19990314)71:11<1797::AID-APP9>3.0.CO;2-E
- K. S. Rathore, D. Patidar, D. Choudhary, N. S. Saxena and K. Sharma “Cadmium Sulphide Nanocrystallites: Synthesis, Optical and Electrical Studies,” American Institute of Physics Proceedings, Vol. 1004, 2010, pp. 145- 149.
- V. Mathur, M. Dixit, N. S. Saxena and K. B. Sharma, “Morphological Effects on Mechanical Properties of Polystyrene-Polyvinylchloride Blends,” Phase Transitions, Vol. 82, No. 11, 2009, pp. 769-772. doi:10.1080/01411590903445089
- K. Menard, “Dynamic Mechanical Analysis: A Practical Introduction,” LLC, CRC Press, 1999, pp. 61-64.
- D. Patidar and N. S. Saxena, “Influence of CdS Nano Additives on the Thermal Conductivity of Poly(vinyl chloride)/CdS Nanocomposites,” Advances in Nanoparticles, Vol. 2, 2013, pp. 11-15. doi:10.4236/anp.2013.21003
- T. K. Jayasree, P. Predeep, R. Agarwal and N. S. Saxena, “Thermal Conductivity and Thermal Diffusivity of Thermoplastic Elastomeric Blends of Styrene Butadiene Rubber/High Density Polyethylene: Effect of Blend Ratio and Dynamic Crosslinking,” Trends in Applied Sciences Research, Vol. 13, 2006, pp. 278-291.
- V. Mathur, M. Dixit, N. S. Saxena and K. Sharma, “Phase Transition and Mechanical Properties of PS/PVC/CdS Polymeric Nanocomposites,” American Institute of Physics Proceedings, Vol. 1249, 2010, pp. 141-144.
- V. Mathur, M. Dixit, K. S. Rathore, N. S. Saxena and K. B. Sharma, “Morphological and Mechanical Characterization of a PMMA/CdS Nanocomposite,” Frontier of Chemical Engineering, Vol. 5, No. 2, 2011, pp. 258-263. doi:10.1007/s11705-010-1014-7
NOTES
*Corresponding author.

