Journal of Behavioral and Brain Science
Vol.05 No.07(2015), Article ID:57919,14 pages
10.4236/jbbs.2015.57029
Individual Differences in Stress Responsiveness of the Hypothalamic- Pituitary-Adrenal Axis and Its Vasopressinergic Regulation in Old Monkeys
Nadezhda D. Goncharova*, Victor Yu. Marenin, Tamara E. Oganyan
Laboratory of Endocrinology, Federal State Budgetary Scientific Institution “Research Institute of Medical Primatology”, Sochi, Russia
Email: *ndgoncharova@mail.ru
Copyright © 2015 by authors and Scientific Research Publishing Inc.
This work is licensed under the Creative Commons Attribution International License (CC BY).
http://creativecommons.org/licenses/by/4.0/


Received 12 June 2015; accepted 11 July 2015; published 14 July 2015
ABSTRACT
Stress adaptation is fundamental for health, and the hypothalamic-pituitary-adrenal axis (HPA) is one of its main mechanisms. Considerable data indicate that arginine vasopressin (AVP) related disturbances of stress adaptation can occur with aging. However, most studies of such kind have been performed on rodents, give contradictory results and fail to consider individual characteristics of the animals. The purpose of this study was to investigate individual HPA responsiveness to acute stress and its vasopressinergic regulation in old female rhesus monkeys that differ in their behavioral responses to stress. Animals with depression-like or anxiety-like behavior (DAB) responded with higher plasma levels of ACTH and AVP, lower levels of corticosteroids and higher cortisol/DHEAS molar ratios to restraint stress and to insulin-induced hypoglycemia compared with animals with healthy adaptive behavior. AVP and ACTH dynamics were closely correlated in most animals. AVP treatment produced differences in HPA responses similar to those produced by the stressors. The ACTH response to hypoglycemic stress in the DAB animal with highest HPA responsiveness was dramatically reduced by prior administration of a V1b receptor antagonist. These results suggest that the dysfunctions of HPA observed in old animals with DAB are caused by increased tone of the vasopressinergic system in regulation of HPA stress reactivity.
Keywords:
Hypothalamic-Pituitary-Adrenal Axis, Stress Responsiveness, Vasopressinergic Regulation, Different Types of Adaptive Behavior, Aging

1. Introduction
Stress adaptation is fundamental for health, and the hypothalamic-pituitary-adrenal (HPA) axis is one of its main mechanisms. Considerable data indicate that arginine vasopressin (AVP) related disturbances of stress adaptation can occur with aging [1] - [10] . However, most studies of such kind have been performed on rodents, give contradictory results and fail to consider individual characteristics of the animals [1] [5] - [7] . At the same time, there is evidence that links behavioral features of the individual with peculiarities in their HPA axis function [3] [4] [8] [11] - [14] . Hyperactivation of the HPA axis occurs in persons who exhibit increased anxiety, in those with some forms of depression [15] - [18] as well as in animals with depression-like behavior [11] - [19] . Moreover, there are data showing a decline in dehydroepiandrosterone (DHEA) and dehydroepiandrosterone sulfate (DHEA-S) secretion in depressed persons [20] [21] .
Several studies have shown that age-related dysfunctions of the HPA axis of nonhuman primates are related to the adaptive behavior patterns of the animals [3] [4] [12] [13] . The most pronounced age-related dysfunctions observed in female rhesus monkeys with depression-like and anxiety-like behavior as compared with monkeys with standard adaptive behavior [3] [4] [12] [13] [22] . Pronounced disturbances of the HPA axis similar to those identified in nonhuman primates were found in elderly male patients with depression [23] . The mechanisms of differential HPA axis vulnerability to stress and aging, both in monkeys with maladaptive behavior and in humans with depression are not clear. Identifying such mechanisms is important, since disturbances of HPA axis functioning is a significant pathogenic factor in many psychiatric disorders, including depression [16] [24] [25] , the incidence of which increases in the elderly [26] [27] .
Experimental data suggest an important role of AVP in the regulation of HPA axis stress reactivity and depression-like and anxiety-like behavior [22] [28] . For example, recent experiments on female rhesus monkeys demonstrated different age-related changes in reaction of the adenohypophysis to AVP administration in female rhesus monkeys with various types of behavior [22] . While ACTH secretion did not change in response to AVP injection in old monkeys with depression-like and anxiety-like behavior as compared with young monkeys with the same behavior, it decreased in old monkeys with standard adaptive behavior compared with young ones of the same behavior [22] . These data suggest that age-related changes in the tone of the vasopressinergic system in the regulation of HPA axis stress reactivity in animals with various types of behavior are different and, perhaps, underlie individual differences in vulnerability of the HPA axis to stress and aging. Some authors believe that disturbances in the production of AVP play an important role in the pathogenesis of some forms of depression [29] [30] . The purpose of this study was to investigate individual HPA responsiveness to acute stress and its vasopressinergic regulation in physically healthy old female rhesus monkeys that differ in their behavioral responses to stress, i.e. with depression-like and anxiety-like behavior (DAB) on the one hand and healthy adaptive behavior (standard behavior, SB) on the other.
2. Material and Methods
2.1. Animals
Seven old (20 - 27 years) physically healthy female rhesus monkeys (Macaca mulatta) were used in the experiments. The monkeys originated from the Adler monkey colony (Research Institute of Medical Primatology, Sochi-Adler, Russia). The animals usually were housed in open enclosures (housing 10 - 15 or 40 - 50 individuals of various ages, including newborns and elderly animals) or cages designed for small-group housing (3 - 5 individuals). Lighting, humidity, and temperature were as per the ambient environment, though each enclosure featured a small closed section that is heated in winter, and where animals can hide in adverse weather conditions.
During the observation period the animals were moved into individual metabolic cages in a separate room with narrow windows, natural illumination (from 06:00 h to 18:00 h) and ambient surrounding temperature (22˚C - 28˚C). All experiments were carried out in the period of June-August when ovarian cycles are not typical for female rhesus monkeys (due to seasonality in the process of reproduction). Additional artificial illumination could be switched on as required, for example when taking blood samples in the evening; in such a case, soft illumination was switched on for 10 - 20 minutes. The animals were fed pellets prepared in the Institute according to the technique of Altromin Spezialfutter GmbH & Co. KG (Lage, Germany). The pellet diet was supplemented with bread, boiled eggs, fresh vegetables, and fruit. Water was available ad libitum.
The animals were adapted to living in metabolic cages and to the procedure of bleeding for 4 weeks before the experiments. During this period the animals were attended by the same keepers and researchers. The animals were subjected to blood sampling followed by food reinforcement (fruit, sweets) once or twice weekly. It was established previously that this period of time is sufficient for elimination of orientation and aggressive-defen- sive unconditional reflexes of animals to a new habitat as well as to experimental procedures (so called “procedural” stress).
The animals’ behavior was recorded while they were housed in the metabolic cages, both during the period of adaptation, and throughout experimentation. Classification of behavior into depression-like and standard was done according to recommendations for nonhuman primates [31] [32] and published previously [13] [33] . Depending on behavioral features animals were divided into two groups: the first group comprised 4 old animals with active healthy adaptive behavior (standard behavior) (SB, 27.0 ± 0.6 years, 7.7 ± 1.0 kg); the second group consisted of 2 old animals with passive, depression-like behavior and 1 old animal with anxiety behavior (DAB, 23.3 ± 1.5 years, 6.9 ± 1.9 kg).
Animals with depression-like behavior were characterized by a typical exaggerated avoidance of the experimenters, which persisted throughout the adaptation period, as well as through the rest of the experiment. The initial reactions of the animals with SB to experimenter (movements of the head and eyes in the direction of the experimenter, lying without movement, etc.) disappeared within the 2 - 4 weeks of the adaptation period. The animal with anxiety behavior showed unusually frantic motor activity and screeching during the blood-draw procedure and did not respond to food reinforcement in the presence of experimenters.
In our experiments, we used old females, not males of rhesus monkeys. The reason is simple. There are practically no old males (20 years and older) with DAB in the monkey colony of our institute just because of premature deaths of the old males with DAB compared to the males with SB.
2.2. Methods
The hormonal function of the HPA axis was evaluated by measuring cortisol (F), dehydroepiandrosterone sulfate (DHEAS), ACTH, and AVP levels in peripheral blood plasma under basal conditions, under acute stress exposure (restraint and insulin induced hypoglycemia), and during tests with AVP and vasopressin V1b receptor antagonist. Basal blood samples were taken in the afternoon (at 14:30 - 15:00 h). Stress exposure and the tests were performed at intervals between 14 and 21 days and were started at 15:00 h. Animal caretaking was performed in accordance with the bioethical rules of the Primate Committee of the Presidium of the Russian Academy of Medical Sciences (No 21/3, January 2002).
All blood samples were taken from the cubital vein of the animals. At each time point, 2.0 - 2.5 ml of blood was taken. Blood samples were collected in chilled tubes with EDTA (10.0 mg EDTA/ml blood) for hormones and glucose determination. Blood samples were immediately centrifuged at 2000 g and +4˚C, plasma was stored at −70˚C for later analysis. Plasma levels of F, DHEAS, and AVP were measured by enzyme immunoassay using standard hormone kits (AlkorBio Ltd., St. Petersburg, Russia for F and DHEA-S; Biomerica Inc., USA for ACTH; Peninsula Laboratories, LLS, USA for AVP). The intra-assay variation coefficients for F, DHEAS, ACTH, and AVP did not exceed 10% and inter-assay variation coefficients did not exceed 15%. All plasma samples obtained in the experiment with the administration of vasopressin V1b antagonist were analyzed for ACTH in one assay to eliminate inter-assay variations. Concentration of plasma glucose was measured immediately after obtaining of plasma by the glucose oxidization method using commercial kits (Vital Diagnostics, Saint Petersburg, Russia).
2.2.1. Stress
After the adaptation period all animals were subjected to psycho-emotional stress (2-h moderate restraint in metabolic cages). Restraint was achieved by using a conventional squeeze board to press the animal to the front wall of the metabolic cage. Blood samples were taken before restraint (0) and 30, 60, and 120 min during application of the stressor, and at 240 minutes, i.e., 2 hours after termination of the stressor. Further blood samples were taken 24 hours (1440 minutes) after onset of restraint. Plasma concentrations of ACTH, F, and DHEAS were determined. Furthermore, AVP concentrations were measured before restraint (0), 60, and 120 min after the beginning of restraint.
Six of the animals (all except one of the controls) were subjected to the metabolic stressor insulin-induced hypoglycemia. Insulin (Biosulin P, “Pharmstandard-UfaVita”, Russia; 0.1 IU/kg b. w.) was administered intravenously. The animals were fasted about 24 hours. Blood samples were taken before (0) and 30, 60, 120 and 240 minutes and 24 hours after administration of insulin. Plasma concentrations of glucose, ACTH, F, and AVP were determined.
2.2.2. Arginine Vasopressin Test
AVP (Sigma, USA; 1 µg/kg b. w.) was administered intravenously to all 7 animals. Blood samples were collected before the AVP injection (0) and 30, 60, 120, and 240 minutes and 24 hours after the injection. Plasma concentrations of ACTH, F, and DHEAS were determined.
2.2.3. Vasopressin V1b Receptor Antagonist Test
Insulin (Biosulin P, “Pharmstandard-UfaVita”, Russia; 0.1 IU/kg b. w.) was injected intravenously to the monkey with anxiety behavior (showing the highest responsiveness of the HPA axis to stress exposure) for the induction of hypoglycemia stress. The animal was fasted about 24 hours. Blood samples were drawn before (0) and 30, 60 minutes and 24 hours after insulin administration. Two weeks after this test vasopressin V1b receptor antagonist (SSR149415, Nelivaptan, “Axon”, Netherlands) was administered to the same female at 14:30 h (intravenously, 1 mg/kg b. w., dissolved in solution of dimethyl sulfoxide: saline 1:1) and 30 min after the antagonist administration insulin was injected again on the above mentioned scheme. Blood samples were taken before the administration of insulin (0) and 30, 60, 120 minutes and 24 hours after its administration. Plasma concentrations of glucose and ACTH were determined.
2.2.4. Statistical Analyses
The experimental values are presented in tables and figures as means ± S.E.M. The statistical comparisons of hormone level differences were performed using repeated ANOVA with behavior type as between-groups factor and time as repeated measure factor. The statistical comparisons of hormone concentration differences at various time intervals after the start of exposure in comparison with the initial levels (basal levels) of the same hormones were performed using two-sided t-test for dependent samples and statistical comparisons of hormone level concentrations in different behavior groups in the same time were performed using two-sided t-test for independent samples. Correlation analysis was performed where appropriate. The areas under curves representing hormone concentration as a function of time (min 0 to min 240) were calculated using the trapezium rule [34] .
3. Results
3.1. Dynamics of HPA Axis Activity in Response to Restraint
The initial values of ACTH in old animals with DAB were higher than in old animals with SB (84.7 ± 24.9 pg/ml and 27.5 ± 6.4 pg/ml, p < 0.05) (Figure 1). The peak ACTH concentration was recorded 60 min after the
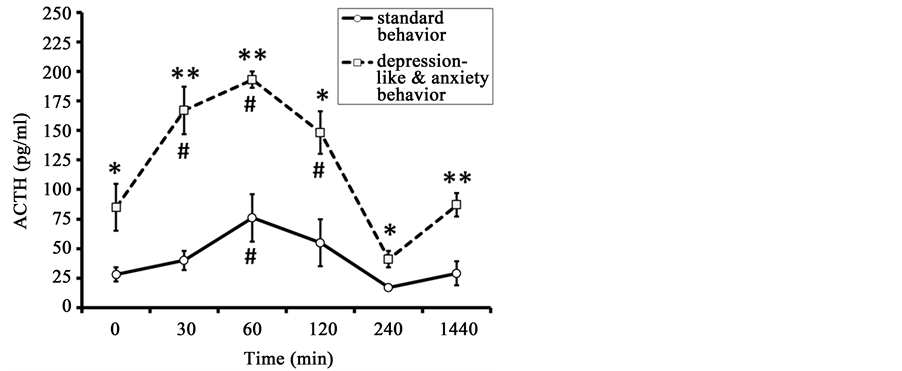
Figure 1. Dynamics of plasma ACTH concentration in response to restraint in old female rhesus monkeys with different types of behavior (mean ± S.E.M.). *p < 0.05, **p < 0.01―intergroup differences; #p < 0.05―vs. basal values before stress exposure (0 min).
onset of restraint in all animals of both behavioral groups (DAB: 193.3 ± 6.7 pg/ml; SB: 76.3 ± 21.0 pg/ml). ACTH concentration normalized after 120 - 240 minutes in animals of both groups.
Marked intergroup differences in magnitude of ACTH secretion in response to the stress exposure were identified in animals of the two behavioral groups, while the dynamics of change in ACTH levels were similar (Figure 1). The animals with DAB had significantly higher concentrations of ACTH 30, 60, 120, 240, and 1440 minutes (24 hours) after the beginning of stress as compared with the animals with SB. Significant intergroup differences were noted with regard to the area under the curve of ACTH response “concentration-time” (Table 1).
The initial values of F in old animals with DAB and in old animals with SB were not significantly different (Figure 2). The peak F concentration was recorded 120 min after the onset of stress exposure in animals of both
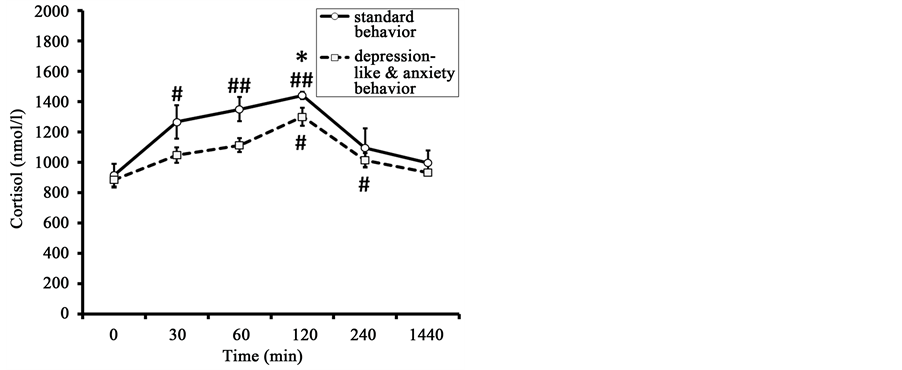
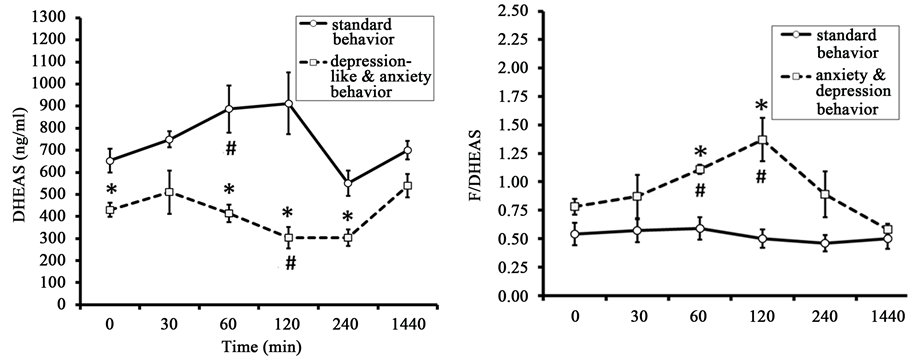
Figure 2. Dynamics of plasma F, DHEAS and the molar ratio of F to DHEAS (F/DHEAS) in response to restraint in old female rhesus monkeys with different types of behavior (mean ± S.E.M.). *p < 0.05―intergroup differences; #p < 0.05, ##p < 0.01―vs. basal values F before stress exposure (0 min).

Table 1. The area under the curves of ACTH, F, DHEAS, and the molar ratios of F/DHEAS in response to restraint in old female rhesus monkeys with different types of behavior (mean ± S.E.M.).
*p < 0.05; **p < 0.01―intergroup differences.
groups. It was lower in animals with DAB than in animals with SB (1300 ± 58 nmol/l and 1440 ± 24 nmol/l respectively for monkeys of DAB and SB, p < 0.05). F concentration normalized 240 - 1440 min after the onset of stress in animals of both behavioral groups. As for the peak values, the F response area under the curve concentration-time was significantly lower in the animals with DAB than the F response area in the animals of SB (Table 1).
DHEAS levels showed significant increase 60 minutes after the beginning of restraint in SB group and they showed no statistically significant increase in response to the same impact in animals with DAB (Figure 2). However, significant intergroup differences were detected for DHEAS concentrations in basal conditions and 60, 120, and 240 minutes after the start of stress exposure with lower values in the animals with DAB. Significant intergroup differences were also noted for the area under the curve of DHEAS response concentration-time (Table 1).
The molar ratio of F to DHEAS, i.e., the coefficient F/DHEAS increased in response to restraint in animals with DAB 60 and 120 minutes after the beginning of stress exposure (Figure 2). Marked intergroup differences in the values of the molar ratio of F to DHEAS were identified in animals of the two behavioral groups. The animals with DAB had significantly higher values of this coefficient 60 and 120 minutes after the onset of stress exposure as compared with the animals of SB. In addition, statistically significant differences between the groups in the coefficient F/DHEAS, with higher values in animals with DAB, were identified in the corresponding area under the curve (Table 1).
The concentration of AVP gradually increased in response to restraint, reaching a maximal value in both groups 120 minutes after the start of stress exposure (Figure 3). There were no significant intergroup differences in basal plasma AVP. At the same time, essential intergroup differences were found in the values of plasma AVP concentration in animals 120 minutes after the start of stress, with greater increases in animals with DAB. The dynamics of AVP concentration in the animals of DAB were positively correlated with the dynamics of ACTH (correlation coefficient r = 0.88 ± 0.07). At the same time, there was no correlation between the kinetics of AVP and ACTH in the animals of SB (r = 0.04 ± 0.03).
3.2. Dynamics of HPA Axis Activity in Response to Insulin-Induced Hypoglycemia
Injection of insulin induced hypoglycemia in all animals of both behavioral groups, severity and duration of which was of a similar character in animals with DAB and SB (Table 2).
The initial values of ACTH in old animals with DAB were higher than in old animals with SB (Figure 4). As in the case of restraint stress, old animals with DAB responded to insulin-induced hypoglycemia with significantly higher plasma ACTH levels than animals of SB (Figure 4). The animals with DAB had significantly
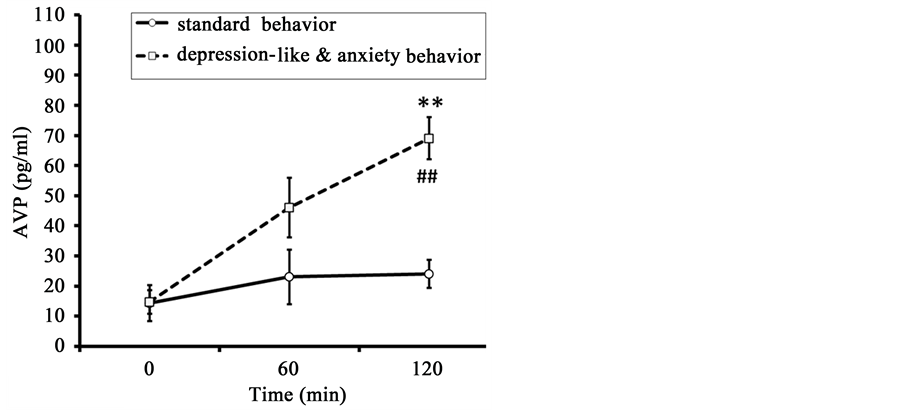
Figure 3. Dynamics of plasma AVP in response to restraint in old female rhesus monkeys with different types of adaptive behavior (mean ± S.E.M.). **p < 0.01―intergroup differences; ##p < 0.01―vs. basal values before stress exposure (0 min).
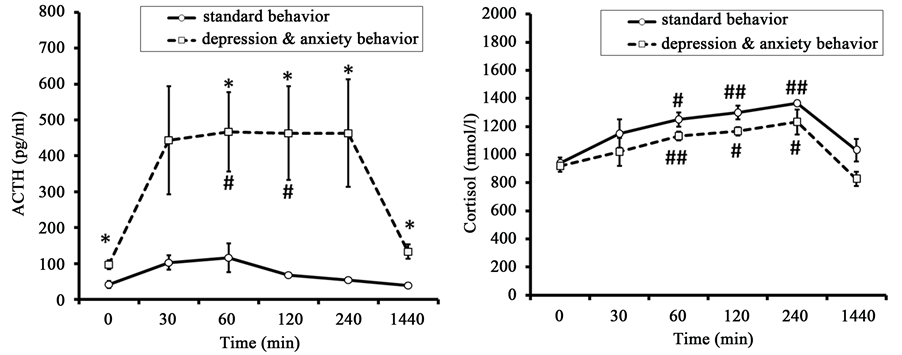
Figure 4. Dynamics of plasma ACTH and F concentration in response to insulin-induced hypoglycemia in old female rhesus monkeys with different types of behavior (injection of insulin at 15:00 h, mean ± S.E.M.). *p < 0.05―intergroup differences; #p < 0.05, ##p < 0.01―vs. basal values ACTH or F before stress exposure (0 min).
Table 2. Dynamics of plasma glucose level in response to injection of insulin in old female rhesus monkeys with different types of behavior (mean ± S.E.M., mmol/l).
#p < 0.05, ##p < 0.01―vs. basal values before stress exposure (0 min).
higher concentrations of ACTH 60, 120, 240, and 1440 minutes (24 hours) after the beginning of stress as compared with the animals with SB. However, a rise of ACTH level in animals with DAB under hypoglycemia stress was longer than in response to restraint. ACTH reached maximum concentration 30 minutes after stress exposure, remained at this level for two hours, and returned to baseline values only 1440 minutes after stress impact. At the same time the dynamics of the ACTH response in animals with SB to hypoglycemia was similar to that under restraint stress. As with restraint, significant intergroup differences were noted with regard to the area under the curve of ACTH response concentration-time (Table 3).
The initial values of F in old animals with DAB and in old animals with SB were not significantly different (Figure 4). The concentration of F increased in response to hypoglycemic stress (Figure 4). The dynamics of plasma F in animals of both groups was of a similar character, gradually reaching maximal values after 240 minutes and returning to baseline only 1440 minutes after insulin injection. Unlike responses of ACTH, there were no significant intergroup differences either in the concentrations of F at different time points or in the area under the curve of the F response (Table 3).
The dynamics of plasma AVP in response to insulin-induced hypoglycemia showed a high positive correlation with the dynamics of the ACTH response for the all animals but one. The correlations were: for the SB group, r = 0.61 ± 0.06; for one monkey, with depression-like behavior (№ 30858) r = 0.93, and for the monkey with anxiety behavior (№ 3881) r = 0.93 (Figure 5). At the same time, there was no significant correlation between the levels of AVP and ACTH in the other animal with depression-like behavior (№ 26023, r = −0.36).
The high positive correlation between the dynamics of plasma AVP and ACTH levels under both types of stress (hypoglycemia and restraint) in the part animals (mainly with DAB) (Figure 3 and Figure 5) indicates the possible involvement of AVP in the reaction of hypothalamic-pituitary axis in response to stress exposure, which associates with the behavioral characteristics of animals. In order to confirm or refute this hypothesis we performed a functional test with the administration of AVP to animals of both behavioral groups, as well as a test with the antagonist vasopressin V1b receptors.
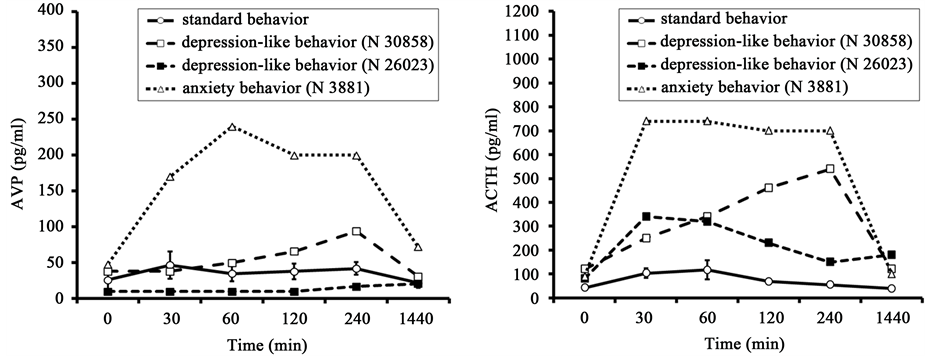
Figure 5. Dynamics of plasma AVP and ACTH in response to insulin-induced hypoglycemia (injection of insulin at 15:00 h) in old female rhesus monkeys with SB (mean ± S.E.M.) and DAB.
Table 3. The area under the curves of ACTH and F level response to insulin-induced hypoglycemia in old female rhesus monkeys with different types of behavior (mean ± S.E.M.).
*p < 0.05―intergroup differences.
3.3. Dynamics of HPA Axis Activity in Response to AVP Administration
ACTH concentration before the injection of AVP in the animals of DAB showed a trend toward higher values compared to the animals of SB (Figure 6). Administration of AVP lead to a significant rise of ACTH levels 30 min after its administration for animals of SB and of DAB. ACTH levels returned to baseline values 120 and 240 minutes after AVP administration for animals of SB and DAB respectively. The concentrations of ACTH 30, 60, 120, and 1440 minutes after administration of AVP were significantly higher in the animals with DAB than in animals of the SB group. Significant intergroup differences, with a higher rise in animals with DAB were seen in the area under the curve of the ACTH response (Table 4).
The initial values of F in old animals with DAB were lower than in old animals with SB (respectively 673 ± 98 nmol/l versus 932 ± 56 nmol/l, p < 0.05) (Figure 7). The peak F concentration was recorded 60 min after the injection of AVP in animals of SB and 120 min after AVP injection in animals with DAB. No significant between-group differences in the dynamics of F concentration were seen. In addition, the area under the curve of F responses to AVP administration was almost identical in animals of both groups (Table 4).
The dynamics of DHEAS level were similar to the dynamics of F level (Figure 7). In contrast to F, marked intergroup differences were found in the concentration of DHEAS 60 min after AVP injection, with lower values observed in the animals of DAB. Significant intergroup differences were noted for the area under the curve of the DHEAS response concentration-time (Table 4).
The molar ratio of F to DHEAS in monkeys with DAB was significantly higher 240 minutes after AVP administration than in the animals with SB (Figure 7). Significant intergroup differences were identified for the area under the curve of the coefficient F/DHEAS response, with higher values in animals with DAB (Table 4).
3.4. Dynamics of ACTH Response to Administration of a Vasopressin V1b Receptor Antagonist
Administration of the vasopressin V1b receptor antagonist to DAB animal with highest HPA responsiveness resulted in a marked reduction in the amount of plasma ACTH rise in response to insulin-induced hypoglycemia
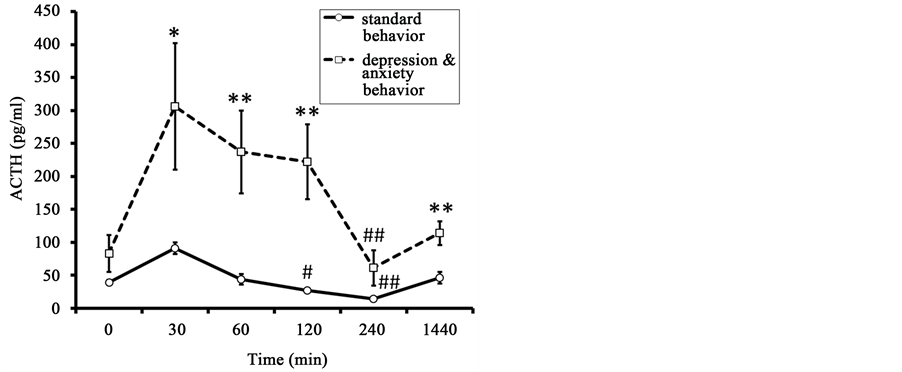
Figure 6. Dynamics of plasma ACTH in response to administration of AVP (at 15:00 h) in old female rhesus monkeys with different types of behavior (mean ± S.E.M.). *p < 0.05, **p < 0.05―intergroup differences; #p < 0.05, ##p < 0.01―vs. basal values before stress exposure (0 min).
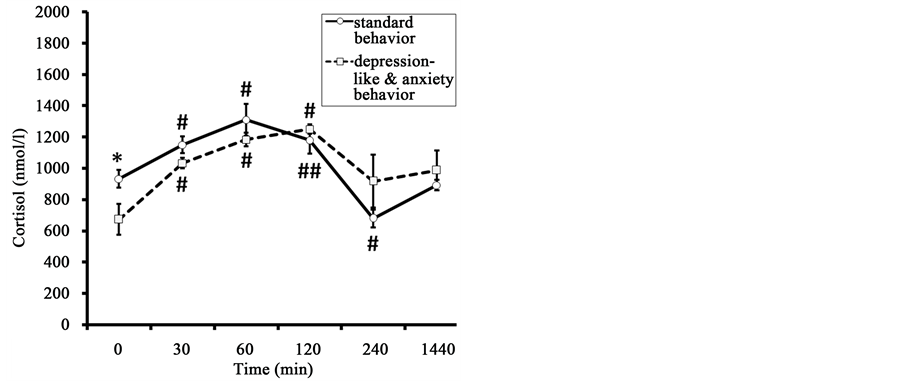
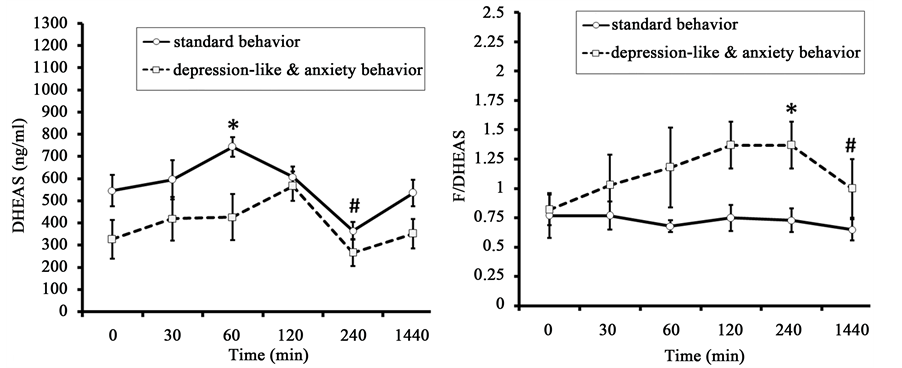
Figure 7. Dynamics of plasma F, DHEAS, and molar ratio of F to DHEAS (F/DHEAS) in response to administration of AVP (at 15:00 h) in old female rhesus monkeys with different types of behavior (mean ± S.E.M.). *p < 0.05―intergroup differences; #p < 0.05, ##p < 0.01―vs. basal values before stress exposure (0 min).
Table 4. The area under the curves of ACTH, F, DHEAS, and the molar ratio F/DHEAS level response to injection of AVP in old female rhesus monkeys with different types of behavior (mean ± S.E.M.).
*p < 0.05―intergroup differences.
(Figure 8). The baseline ACTH level was not reduced. The levels of hypoglycemia induced by insulin administration to the animal in basal conditions and after preliminary administration of the antagonist were similar (Table 5).
4. Discussion
Analysis of the characteristics of the HPA axis reaction to acute psycho-emotional stress and metabolic stress in old female rhesus monkeys revealed marked differences in animals with DAB and SB (control monkeys). It was found that the old animals with DAB had significantly higher concentrations of ACTH under basal conditions and in response to acute stress exposure compared to old animals with SB. This indicates higher secretory activity of the adenohypophysis in animals with DAB in comparison with animals of SB, both under basal conditions and under acute stress. Higher secretary response of the adenohypophysis to acute stress caused by physical exertion has been previously reported for healthy young men who showed a trend for higher ratings on trait anxiety [35] .
Along with higher levels of ACTH in response to the two kinds of stress, we found significantly lower levels of circulating corticosteroids, F and DHEAS in monkeys with DAB as compared with SB animals. The lack of correspondence between the dynamics of ACTH and corticosteroid levels in response to acute stress in the animals with DAB may be due to a decrease in sensitivity of the adrenal cortex to ACTH. It may be caused due to adrenal melanocortin receptor desensitization developing as a result of a prolonged increase of ACTH secretion. That finding is consistent with data from clinical studies showing that increase of F and DHEAS secretion in response to ACTH stimulation test is lower in old patients than in young ones [36] .
In contrast to intergroup differences in the level of corticosteroids, the molar ratio of F to DHEAS in basal conditions and in response to stress in animals with DAB, was higher compared to animals of SB. As is known, the molar ratio of F to DHEAS is a better measure of hypercortisolemia than F alone in humans and nonhuman primates [4] [13] [37] - [39] . Hypercortisolemia plays a pathophysiological role in the development of a variety of stress-related diseases: psychiatric, reproductive, immune, metabolic, and others. It is a major factor in aging and age-related pathology [4] [40] [41] . For example, we have previously identified more severe disturbances of antioxidant enzyme defense of erythrocytes and higher values of the molar ratio F/DHEAS in old animals with depression-like adaptive behavior as compared with animals of the same age but with SB [33] . Depressive symptoms that correlate with an increased F/DHEAS ratio are a major driver of reduced immunity after hip fracture [37] . Taken together, this ratio is considered an important biomarker of aging in primates, including humans [4] [13] [42] - [44] .
Along with an increase of ACTH secretion in response to acute stress plasma concentration of AVP also increased. This increase was more pronounced in the group of animals with DAB. Most of the animals showed a close correlation between the dynamics of AVP and ACTH levels. Our data are in good agreement with the results of clinical studies demonstrating a higher rise in plasma AVP concentration in peripheral blood of healthy men showing high secretion of ACTH in response to strenuous treadmill exercise as compared with the increase of AVP level in men with low secretion of ACTH in response to the same physical stress [33] [45] . Interestingly, high responders exhibited a trend toward higher trait anxiety ratings [35] . Some studies have shown a correlation between increased levels of F and AVP in the plasma of patients with depression [29] [46] .
Between-group differences in HPA axis response and in the rise of AVP concentration in peripheral blood plasma with two kinds of acute stressor indicated the possible involvement of AVP of neurohypophyseal origin, i.e., synthesized in the magnocellular neurons of the hypothalamic paraventricular nucleus (PVN) and the supraoptic nucleus, in the regulation of ACTH secretion in response to acute stress exposure. Indeed, a number of
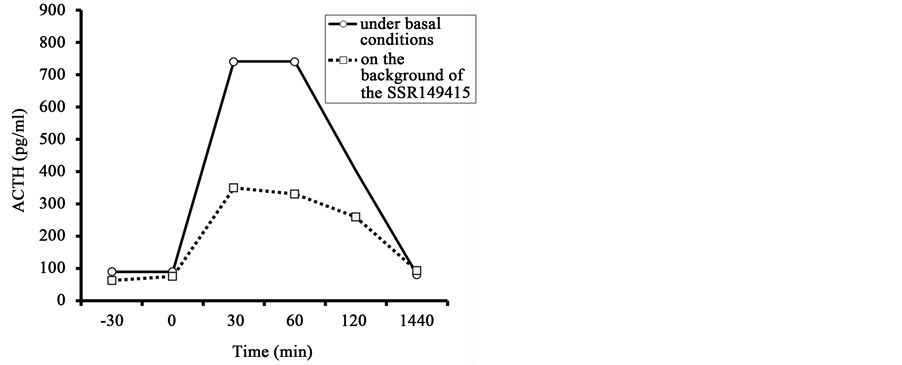
Figure 8. Dynamics of plasma ACTH level in the old female rhesus monkey with anxiety- like behavior in response to injection of insulin in basal conditions and 30 min after the preliminary administration of the antagonist of vasopressin V1b receptor (the SSR149415).
Table 5. Dynamics of the plasma glucose concentration in old rhesus monkey with anxiety-like behavior in response to injection of insulin in basal conditions and 30 min after the preliminary administration of the antagonist of vasopressin V1b receptor (the SSR149415).
anatomical studies on small laboratory animals and postmortem tissue of people have demonstrated the possibility of a certain contribution of AVP synthesized by magnocellular neurons to the activation of ACTH secretion [47] - [49] .
On the other hand, hyper-responsiveness of the anterior pituitary in response to acute stress in animals with DAB may be due to increased vasopressin-producing activity of the parvicellular neurons of the PVN, i.e., the usual suppliers of AVP into the pituitary portal vascular system and, perhaps, greater activation of vasopressin V1b receptors. This assumption is consistent with data from experimental studies showing that enhanced AVP neuronal activation and potentiated AVP systems are associated with conditioned anxiety [10] . Furthermore, experiments on mice subjected to stress in early life have shown, along with an increase in stress responsibility in adult mice, increased expression of the AVP gene by neurons of the PVN through epigenetic marking at the downstream enhancer region of the gene [50] [51] . In addition, some clinical studies have shown increased numbers of vasopressin-expressing neurons in the PVN in depression [52] .
The V1b receptor of the pituitary is known to mediate the action of AVP in control of HPA axis activity [3] [53] - [55] . To test the hypothesis that the basis for enhanced responsiveness of the adenohypophysis to acute stress exposure in animals with DAB is hyper-responsiveness of vasopressin V1b receptors, we conducted the AVP test. The results of this test revealed a similarity in HPA axis response in animals of both behavioral groups to AVP administration and acute stress exposure. As in the case of acute stress, administration of AVP induced in the animals with DAB a higher rise of ACTH level, a lower rise of DHEAS level in peripheral blood, and increase in the molar ratio of F to DHEAS as compared with SB animals.
These findings are consistent with the results of clinical studies showing that, in men with a trend toward higher trait anxiety ratings and greater response of the HPA axis to acute physical stress, higher plasma ACTH responses to administration of AVP compared to individuals with lower anxiety ratings [35] . Furthermore, several studies noted hyper-reaction of the HPA axis to AVP-stimulation in patients with depression [30] [56] .
The similarity in HPA axis responses to acute stress and to AVP administration in animals of both behavioral groups suggest that group differences in vasopressinergic regulation of the anterior pituitary with hyper-respon- siveness of corticotrophs in the animals with DAB, perhaps, underlie between-group differences in HPA axis responsiveness to acute stress.
The experiment with the vasopressin V1b antagonist, the first selective non-peptide V1b receptor antagonist, SSR149415 [55] , revealed that the prior administration of the vasopressin V1b receptor antagonist to DAB animal with highest HPA responsiveness induce a sharp reduction in the secretion of ACTH in response to insulin- induced hypoglycemia. This experiment together with previous findings suggests that increased tone of the vasopressinergic system in regulation of HPA stress reactivity may underlie the group differences in HPA axis response to acute stress exposure.
5. Conclusion
Our results illustrate that old female rhesus monkeys differ in their behavioral responses to stress and in HPA axis stress responsiveness. Animals with DAB responded with higher plasma levels of ACTH and AVP, lower levels of corticosteroids and higher cortisol/DHEAS molar ratios to restraint stress and to insulin-induced hypoglycemia compared with animals with SB (healthy adaptive behavior). AVP and ACTH dynamics were closely correlated in most animals. AVP treatment produced differences in HPA responses similar to those produced by the stressors. The ACTH response to hypoglycemic stress in the DAB animal with highest HPA responsiveness was dramatically reduced by prior administration of a V1b receptor antagonist. These results suggest that the more pronounced dysfunctions of the HPA axis observed in old monkeys with DAB and they are caused by increased tone of the vasopressinergic system in regulation of HPA stress reactivity.
Acknowledgements
This work was supported by Russian Foundation for Basic Research, project 15-04-07896. We greatly thank Mrs. T. M. Smirnova, a senior researcher of the Institute for Systems Analysis of the Russian Academy of Sci- ences (Moscow), for help with the statistical analysis.
Cite this paper
Nadezhda D.Goncharova,Victor Yu.Marenin,Tamara E.Oganyan, (2015) Individual Differences in Stress Responsiveness of the Hypothalamic-Pituitary-Adrenal Axis and Its Vasopressinergic Regulation in Old Monkeys. Journal of Behavioral and Brain Science,05,280-294. doi: 10.4236/jbbs.2015.57029
References
- 1. Сizza, G., Calogero, A.E., Brady, L.S., Bagdy, G., Bergamini, E., Blackman, M.R., Chrousos, G.P. and Gold, P.W. (1994) Male Fischer 344/N Rats Show a Progressive Central Impairment of the Hypothalamic-Pituitary-Adrenal Axis with Advancing Age. Endocrinology, 134, 1611-1621.
- 2. Goncharova, N.D. (2009) The Hypothalamic-Pituitary-Adrenal Axis in Nonhuman Primates: Circadian Rhythms of Stress Responsiveness and Aging. In: Potocki, E. and Krasinski, J., Eds., Primatology: Theories, Methods and Research, Nova Science Publishers Inc., New York, 29-52.
- 3. Goncharova, N.D. (2013) Stress Responsiveness of the Hypothalamic-Pituitary-Adrenal Axis: Age-Related Features of the Vasopressinergic Regulation. Frontiers in Endocrinology, 4, 26.
http://dx.doi.org/10.3389/fendo.2013.00026 - 4. Goncharova, N.D. (2014) Age-Related Changes in the Hypothalamic-Pituitary-Adrenal Axis: Experimental Studies in Primates. Advances in Gerontology, 4, 266-270.
http://dx.doi.org/10.1134/S2079057014040109 - 5. Hatzinger, M., Wotjak, C.T., Naruo, T., Simchen, R., Kewck, M.E., Landgraf, R., Holsboer, F. and Neumann, I.D. (2000) Endogenous Vasopressin Contributes to Hypothalamic-Pituitary-Adrenocortical Alterations in Aged Rats. Journal of Endocrinology, 164, 197-205.
http://dx.doi.org/10.1677/joe.0.1640197 - 6. Haugert, B.L., Thrivikraman, K.V. and Plotsky, P.M. (1994) Age-Related Alterations of Hypothalamic-Pituitary-Adrenal Axis Function in Male Fischer 344 Rats. Endocrinology, 134, 1528-1536.
- 7. Keck, M.E., Hatzinger, M., Wotjak, C.T., Landgraf, R., Holsboer, F. and Neumann, I.D. (2000) Ageing Alters Intrahypothalamic Release Patterns of Vasopressin and Oxytocin in Rats. European Journal of Neuroscience, 12, 1487-1494.
http://dx.doi.org/10.1046/j.1460-9568.2000.00030.x - 8. Keck, M.E., Wigger, A., Welt, T., Muller, M.B., Gesing, A., Reul, J.M.H.M., Holsboer, F., Landgraf, R. and Neumann, I.D. (2002) Vasopressin Mediates the Response of the Combined Dexamethasone/CRH Test in Hyper-Anxious Rats: Implications for Pathogenesis of Affective Disorders. Neuropsychopharmacology, 26, 94-105.
http://dx.doi.org/10.1016/S0893-133X(01)00351-7 - 9. Meijer, J.C., Topic, D., Steenbergen, P.J., Jochan, G., Huston, J.P. and Oitzl, M.S. (2005) Correlations between Hypothalamic-Pituitrary-Adrenal Axis Paremeters Depend on Age and Learning Capacity. Endocrinology, 146, 1372-1381.
http://dx.doi.org/10.1210/en.2004-0416 - 10. Zhang, L., Hernandez, V.S., Liu, B., Medina, M.P., Nava-Kopp, A.T., Irles, C. and Morales, M. (2012) Hypothalamic Vasopressin System Regulation by Maternal Separation: Its Impact on Anxiety in Rats. Neuroscience, 215, 135-148.
http://dx.doi.org/10.1016/j.neuroscience.2012.03.046 - 11. Boyle, M.P., Kolber, B.J., Vogt, S.K., Wozniak, D.F. and Muglia, L.J. (2006) Forebrain Glucocorticoid Receptors Modulate Anxiety-Associated Locomotor Activation and Adrenal Responsiveness. Journal of Neuroscience, 26, 1971-1978.
http://dx.doi.org/10.1523/JNEUROSCI.2173-05.2006 - 12. Goncharova, N.D. (2009) Individual Life History, Behavior, and Biomarkers of Ageing. Journal of Nutrition, Health, and Aging, 13, S215.
- 13. Goncharova, N.D., Marenin, V.Y. and Oganyan, T.E. (2010) Aging of the Hypothalamic-Pituitary-Adrenal Axis in Nonhuman Primates with Depression-Like and Aggressive Behavior. Aging, 2, 854-866.
- 14. Maestripieri, D. and Georgiev, A.V. (2015) What Cortisol Can Tell Us about the Costs of Sociality and Reproduction among Free-Ranging Rhesus Macaque Females on Cayo Santiago. American Journal of Primatology, Published Online.
http://dx.doi.org/10.1002/ajp.22368 - 15. Beluche, I., Chaudieu, I., Norton, J., Carriere, I., Boulenger, J.P., Ritchie, K. and Ancelin, M.L. (2009) Persistence of Abnormal Cortisol Levels in Elderly Persons after Recovery from Major Depression. Journal of Psychiatric Research, 43, 777-783.
http://dx.doi.org/10.1016/j.jpsychires.2008.10.011 - 16. Burke, H.M., Davis, M.C., Otte, C. and Mohr, D.C. (2005) Depression and Cortisol Responses to Psychological Stress: A Meta-Analysis. Psychoneuroendocrinology, 30, 846-856.
http://dx.doi.org/10.1016/j.psyneuen.2005.02.010 - 17. Swaab, D.F., Bao, A.M. and Lucassen, P.J. (2005) The Stress System in the Human Brain in Depression and Neurodegeneration. Ageing Research Reviews, 4, 141-194.
http://dx.doi.org/10.1016/j.arr.2005.03.003 - 18. Vreeburg, S.A., Hoogendijk, W.J., van Pelt, J., Derijk, R.H., Verhagen, J.C., van Dyck, R., Smit, J.H., Zitman, F.G. and Penninx, B.W. (2009) Major Depressive Disorder and Hypothalamic-Pituitary-Adrenal Axis Activity: Results from a Large Cohort Study. Archives of General Psychiatry, 66, 617-626.
http://dx.doi.org/10.1001/archgenpsychiatry.2009.50 - 19. Genud, R., Merenlender, A., Gispan-Herman, I., Maayan, R., Weizman, A. and Yadid, G. (2009) DHEA Lessen Depressive-Like Behavior via GABA-Ergic Modulation of the Mesolimbic System. Neuropsychopharmacology, 34, 577-584.
http://dx.doi.org/10.1038/npp.2008.46 - 20. Genazzani, A.R. and Pluchino, N. (2010) DHEA Therapy in Postmenopausal Women: The Need to Move forward beyond the Lack of Evidence. Climacteric, 13, 314-316.
http://dx.doi.org/10.3109/13697137.2010.492496 - 21. Micheal, A. (2000) Altered Salivary Dehydroepiandrosterone Levels in Major Depression in Adults. Biological Psychiatry, 48, 989-995.
http://dx.doi.org/10.1016/S0006-3223(00)00955-0 - 22. Goncharova, N.D., Oganyan, T.E. and Marenin, V.Y. (2015) Age-Specific and Individual Features of Vasopressinergic Regulation of the Hypothalamic-Pituitary-Adrenal System in Primates. Bulletin of Experimental Biology and Medicine, 134, 804-807.
http://dx.doi.org/10.1007/s10517-015-2866-0 - 23. Belvederi Murri, B.M., Pariante, C., Mondelli, V., Masotti, M., Atti, A.R., Mellacqua, Z., Antonioli, M., Ghio, L., Menchetti, M., Zanetidou, S., Innamorati, M. and Amore, M. (2014) HPA Axis and Aging in Depression: Systematic Review and Meta-Analysis. Psychoneuroendocrinology, 41, 46-62.
http://dx.doi.org/10.1016/j.psyneuen.2013.12.004 - 24. Hankin, B.L., Badanas, L.S., Abela, J.R.Z. and Watamura, S.E. (2010) Hypothalamic-Pituitary-Adrenal Axis Dysregulation in Disphoric Children and Adolescents: Cortisol Reactivity to Psychosocial Stress from Preschool through Middle Adolescence. Biological Psychiatry, 68, 484-490.
http://dx.doi.org/10.1016/j.biopsych.2010.04.004 - 25. Shah, J.L. and Malla, A.K. (2015) Much Ado about Much: Stress, Dynamic Biomarkers and HPA Axis Dysregulation along the Trajectory to Psychosis. Schizophrenia Research, 162, 253-260.
http://dx.doi.org/10.1016/j.schres.2015.01.010 - 26. Ferrari, A.J., Charlson, F.J., Norman, R.E., Patten, S.B., Freedman, G., Murray, C.J., Vos, T. and Whiteford, H.A. (2013) Burden of Depressive Disorders by Country, Sex, Age, and Year: Findings from the Global Burden of Disease Study 2010. PLoS Medicine, 10, e1001547.
http://dx.doi.org/10.1371/journal.pmed.1001547 - 27. Hidaka, B.H. (2012) Depression as a Disease of Modernity: Explanations for Increasing Prevalence. Journal of Affective Disorders, 140, 205-214.
http://dx.doi.org/10.1016/j.jad.2011.12.036 - 28. Landgraf, R. and Wigger, A. (2002) High vs. Low Anxiety-Related Behavior in Rats: An Animal Model of Extremes in Trait Anxiety. Behavior Genetics, 32, 301-314.
http://dx.doi.org/10.1023/A:1020258104318 - 29. de Winter, R.F., van Hemert, A.M., DeRijk, R.H., Zwinderman, K.H., Frankhuijzen-Sierevogel, A.C., Wiegant, V.M. and Goekoop, J.G. (2003) Anxious-Retarded Depression: Relation with Plasma Vasopressin and Cortisol. Neuropsychopharmacology, 28, 140-147.
http://dx.doi.org/10.1038/sj.npp.1300002 - 30. Dinan, T.G., O’Brien, S., Lavelle, E. and Scott, L.V. (2004) Further Neuroendocrine Evidence of Enhanced Vasopressin V3 Receptor Responses in Melancholic Depression. Psychological Medicine, 34, 169-172.
http://dx.doi.org/10.1017/S0033291703001004 - 31. McKinney, W.T., Moran, G.W. and Kraemer, G.W. (1984) Neurobiology and Mood Disorders. In: Post, R. and Ballenger, J., Eds., Separation in Non-Human Primates as a Model for Human Depression: Neurobiological Implications, Williams and Wilkins, Baltimore, 393-406.
- 32. Boccia, M.L., Laudenslager, M.L. and Reite, M.L. (1995) Individual Differences in Macaques’ Responses to Stressors Based on Social and Physiological Factors: Implications for Primates Welfare and Research Outcomes. Laboratory Animals, 29, 250-257.
http://dx.doi.org/10.1258/002367795781088315 - 33. Goncharova, N.D., Marenin, V.Y. and Vengerin, A.A. (2013) Age-Related Changes in the Reliability of Antioxidant Enzyme Defense in Monkeys with Different Types of Adaptive Behavior. Current Aging Science, 6, 163-169.
http://dx.doi.org/10.2174/18746098112059990004 - 34. Vygodsky, M.Y. (1962) Guide to Higher Mathematics. State Publishing Company of Physical and Mathematical Literature, Moscow.
- 35. Petrides, J.S., Gold, P.W., Mueller, G.P., Singh, A., Stratakis, C., Chrousos, G.P. and Deuster, P.A. (1997) Marked Differences in Functioning of the Hypothalamic-Pituitary-Adrenal Axis between Groups of Men. Journal Applied Physiology, 82, 1979-1988.
- 36. Lekkakou, L., Tzanela, M., Lymberi, M., Consoulas, C., Tsagarakis, S. and Koutsilieris, M. (2013) Effects of Gender and Age on Hypothalamic-Pituitary-Adrenal Reactivity after Pharmacological Challenge with Low-Dose 1-μg ACTH Test: A Prospective Study in Healthy Adults. Clinical Endocrinology, 79, 683-688.
http://dx.doi.org/10.1111/cen.12198 - 37. Duggal, N.A., Upton, J., Phillips, A.C., Hampson, P. and Lord, J.M. (2013) Depressive Symptoms Are Associated with Reduced Neutrophil Function in Hip Fracture Patients. Brain, Behavior, Immunity, 33, 173-182.
http://dx.doi.org/10.1016/j.bbi.2013.07.004 - 38. Ferrari, E., Cravello, L., Muzzoni, B., Casarotti, D., Paltro, M., Solerte, S.B., Fioravanti, M., Cuzzoni, G., Pontiggia, B. and Magri, F. (2001) Age-Related Changes of the Hypothalamic-Pituitary-Adrenal Axis: Pathophysiological Correlates. European Journal of Endocrinology, 144, 319-329.
http://dx.doi.org/10.1530/eje.0.1440319 - 39. Grillon, C., Pine, D.S., Baas, J.M., Lawley, M., Ellis, V. and Charney, D. (2006) Cortisol and DHEA-S Are Associated with Startle Potentiation during Aversive Conditioning in Humans. Psychopharmacology, 186, 434-441.
http://dx.doi.org/10.1007/s00213-005-0124-2 - 40. Perez-Neri, I., Montes, S., Ojeda-Lopez, C., Ramirez-Bermudez, J. and Rios, C. (2008) Modulation of Neurotransmitter Systems by Dehydroepiandrosterone and Dehydroepiandrosterone Sulfate: Mechanism of Action and Relevance to Psychiatric Disorders. Progress in Neuropsychopharmacology and Biological Psychiatry, 32, 1118-1130.
http://dx.doi.org/10.1016/j.pnpbp.2007.12.001 - 41. Kassi, E.N. and Chrousos, G.P. (2013) The Central CLOCK System and Stress Axis in Health and Disease. Hormones, 12, 172-191.
http://dx.doi.org/10.14310/horm.2002.1402 - 42. Blevins, J.K., Coxworth, J.E., Herndon, J.G. and Hawkes, K. (2013) Adrenal Androgens and Aging: Female Chimpanzees (Pan troglodytes) Compared with Women. American Journal of Physical Anthropology, 151, 643-648.
http://dx.doi.org/10.1002/ajpa.22300 - 43. Takeshita, R.S.C., Huffman, M.A., Bercovitch, F.B., Mouri, K. and Shimizu, K. (2013) The Influence of Age and Season on Fecal Dehydroepiandrosterone-Sulfate (DHEAS) Concentrations in Japanese Macaques (Macaca fuscata). General and Comparative Endocrinology, 191, 39-43.
http://dx.doi.org/10.1016/j.ygcen.2013.05.019 - 44. Sorwell, K.G., Kohama, S.G. and Urbanski, H.F. (2014) Testosterone Increases Circulating Dehydroepiandrosterone Sulfate Levels in the Male Rhesus Macaque. Frontiers in Endocrinology, 5, 101.
http://dx.doi.org/10.3389/fendo.2014.00101 - 45. Petrides, J.S., Mueller, G.P., Kalogeros, K.T., Chrousos, G.P., Gold, P.W. and Deuster, P.A. (1994) Exercise-Induced Activation of the Hypothalamic-Pituitary-Adrenal Axis: Marked Differences in the Sensitivity to Glucocorticoid Suppression. Journal of Clinical Endocrinology and Metabolism, 79, 377-383.
- 46. van Londen, L., Goekoop, J.G., van Kempen, G.M., Frankhuijzen-Sierevogel, A.C., Wiegant, V.M., van der Velde, E.A. and De Wied, D. (1997) Plasma Levels of Arginine Vasopressin Elevated in Patients with Major Depression. Neuropsychopharmacology, 17, 284-292.
http://dx.doi.org/10.1016/S0893-133X(97)00054-7 - 47. Antoni, F., Fink, G. and Sheward, W. (1990) Corticotrophin-Releasing Peptides in Rat Hypophysial Portal Blood after Paraventricular Lesions: A Marked Reduction in the Concentration of 41-Residue Corticotropin-Releasing Factor, but No Change in Vasopressin. Journal of Endocrinology, 125, 75-183.
http://dx.doi.org/10.1677/joe.0.1250175 - 48. Dinan, T.G. and Scott, L.V. (2005) Anatomy of Melancholia: Focus on Hypothalamic-Pituitary-Adrenal Axis Overactivity and the Role of Vasopressin. Journal of Anatomy, 207, 259-264.
http://dx.doi.org/10.1111/j.1469-7580.2005.00443.x - 49. Kalogeras, K.T., Nieman, L.K., Friedman, T.C., Doppman, J.L., Cutler, G.B., Chrousos, G.P., Wilder, R.L., Gold, P.W. and Yanovski, J.A. (1996) Inferior Petrosal Sinus Sampling in Healthy Subjects Reveals a Unilateral Corticotrophin-Releasing Hormone-Induced Arginine Vasopressin Release Associated with Ipsilateral Adrenocorticotropin Secretion. Journal of Clinical Investigations, 97, 2045-2050.
http://dx.doi.org/10.1172/JCI118640 - 50. Murgatroyd, C., Patchev, A.V., Wu, Y., Micale, V., Bockmuhl, Y., Fischer, D., Holsboer, F., Wotjak, C.T., Almeida, O.F. and Spengler, D. (2009) Dynamic DNA Methylation Programs Persistent Adverse Effects of Early-Life Stress. Nature Neuroscience, 12, 1559-1566.
http://dx.doi.org/10.1038/nn.2436 - 51. Murgatroyd, C. and Spengler, D. (2014) Plycomb Binding Precedes Early-Life Stress Responsive DNA Methylation at the Avp Enhancer. PLoS ONE, 9, e90277.
- 52. Purba, J.S., Hoogendijk, W.J., Hofman, M.A. and Swaab, D.F. (1996) Increased Number of Vasopressin- and Oxytocin-Expressing Neurons in the Paraventricular Nucleus of the Hypothalamus in Depression. Archives of General Psychiatry, 53, 137-143.
http://dx.doi.org/10.1001/archpsyc.1996.01830020055007 - 53. Aguilera, G. (2011) HPA Axis Responsiveness to Stress: Implications for Healthy Aging. Experimental Gerontology, 46, 90-95.
http://dx.doi.org/10.1016/j.exger.2010.08.023 - 54. Roper, J.A., O’Carroll, A.-M., Young, W.S. and Lolait, S.J. (2011) The Vasopressin Avpr1b Receptor: Molecular and Pharmacological Studies. Stress, 14, 98-115.
- 55. Serradeil-Le Gal, C., Derick, S., Brossard, G., Manning, M., Simiand, J., Gaillard, R., Griebel, G. and Guillon, G. (2003) Functional and Pharmacological Characterization of the First Specific Agonist and Antagonist for the V1b Receptor in Mammals. Stress, 6, 199-206.
http://dx.doi.org/10.1080/1025389032000114524 - 56. Thomson, F. and Craighead, M. (2008) Innovative Approaches for the Treatment of Depression: Targeting the HPA Axis. Neurochemical Research, 33, 691-707.
http://dx.doi.org/10.1007/s11064-007-9518-3
NOTES

*Corresponding author.