Journal of Behavioral and Brain Science
Vol.4 No.1(2014), Article ID:42443,11 pages DOI:10.4236/jbbs.2014.41008
Neuroimaging Phenomenology of the Central Self-Regulation Mechanisms
1Research Institute of Molecular Biology and Biophysics, Siberian Branch of the Russian Academy of Medical Sciences, Novosibirsk, Russia
2Company “Biofeedback Computer Systems”, Novosibirsk, Russia3Research Institute “International Tomography Center”, Siberian Branch of the Russian Academy of Sciences, Novosibirsk, RussiaEmail: mark@soramn.ru, mazhirina_k@soramn.ru, jafarova@soramn.ru, avmavik@mail.ru, as@tomo.nsc.ru, mikhail@soramn.ru
Copyright © 2014 Mark B. Shtark et al. This is an open access article distributed under the Creative Commons Attribution License, which permits unrestricted use, distribution, and reproduction in any medium, provided the original work is properly cited. In accordance of the Creative Commons Attribution License all Copyrights © 2014 are reserved for SCIRP and the owner of the intellectual property Mark B. Shtark et al. All Copyright © 2014 are guarded by law and by SCIRP as a guardian.
Received November 14, 2013; revised December 26, 2013; accepted January 14, 2014
Keywords:Functional Magnetic Resonance Imaging; Adaptive Feedback; Real and Imitation Biofeedback; Self-Regulation Strategies
ABSTRACT
Functional MRI was used to map the brains of subjects on-line during the process of media training for the acquisition and improvement of self-regulation mechanisms. The temporal and spatial dynamics of the new neural network formation were studied in real and simulated (false) biofeedback game, and their qualitative characteristics were discussed. It has been shown that immersion into a virtual competitive game, controlled by physiological responses, causes a wide involvement of the cortices, characterized by a high volume of activation in the mid-temporal, occipital and frontal areas, the cuneus and the precuneus. In both forms of media training, high values of activation volume were identified in the cerebellar structures.
1. Introduction
The results of investigations of the mechanisms of real brain activity are known to be based mainly on several sources of knowledge. These are, first of all, experimental animal models, intrascopic (static), and most frequently, invasive studies of the human brain using a radioactive agent (CT, PET, FET-PET, etc.), psychophysiological studies based on deductive and inductive testing, the evaluation of electrical activity of the open (during neurosurgical interventions) or intact human brain, and finally, analysis of its activity in the presence of local lesions in specific cerebral areas. The knowledge obtained by all these means is extrapolated to the area of active brain activity in healthy or sick persons and forms the basis of today’s understanding of the functions of the central structures and higher neural activity.
The technology of functional magnetic resonance imaging (fMRI) is known to be fundamentally different from all the indirect ways of studying the brain that are mentioned above: it is a non-invasive in vivo dynamic study of the central structures during their activity, based on the difference in magnetic properties between the oxygen carrier oxyhemoglobin (Hb) and deoxyhemoglobin (dHb), which is produced in the brain parenchyma; their ratio is reflected by the BOLD phenomenon (blood oxygenation level dependent), a marker of neural activity.
Stereotypical or, on the contrary, heuristic actions, including cognitive mnemonic actions that have to do with solving creative tasks, as well as motor-sensory, visualauditory and verbal operations, are accompanied by the formation of new neural ensembles (NE) in the brain and/or de-repression of pre-existing ones. Their spontaneous or environmentally-caused activity is evidenced by increased local blood supply to the brain tissue and changes in the regulation mechanisms of cerebral blood flow volume and velocity. These phenomena are observed in the magnetic field in the form of activation areas —three-dimensional indicators of local dynamics of neural activity that are distributed within the functioning neural networks [1-9, etc.]. We believe that fMRI should be today considered the technology of choice for studying the brains of humans and animals, both healthy and with pathological conditions.
When considering the problems of fMRI and its role in cognitive science, it becomes clear that one of its major conceptual links is neurobiofeedback—the technology of voluntary self-regulation of brain activity, the key mechanism of which is adaptive feedback and the means of voluntary control—the basis for the selection of optimal cognitive strategies [10-15]. Neurobiofeedback displays and creates previously absent self-regulation skills in people, forms new NE and/or updates the activity of preexisting ones, with the real temporal and spatial dynamics of the brain visualized with the help of fMRI.
This study is dedicated to the attempts to study the intracerebral localization of self-regulation mechanisms of cognitive activity and their dynamics, and to analyze voluntarily controlled brain activity modification by means of game biofeedback in a virtual environment.
The relevance of the proposed work is also dictated by the fact that the virtual world is steadily becoming a regular feature in today’s life. Adaptive social interactions mediated through a synthesized visual environment, in our case in the form of a virtual game, controlled and developed by a physiological characteristic, represent a unique opportunity to reveal and visualize a person’s certain latent abilities, or behavior characteristics that are usually blocked by the real environment. In the context of our study, the game is a psychological reality, a set of atypical, non-standard situations that do not allow stereotypical behavior, so that it is necessary to develop new strategies and patterns of behavior to achieve a result. A computer player gets used to moving from one virtual world to another, quickly perceives unfamiliar situations and adapts to them, according to their personal disposition and preference. From this point of view, the technology of game biofeedback (media training), with its modern multimedia, is a powerful tool for teaching a person new behavioral strategies. Adaptive feedback allows one not only to “play out” different types of behavior, but also to evaluate their effectiveness, thus being one of the new tools for enriching the human behavioral repertoire. Thus any game training [4,14,17-19], and virtual gaming in particular, can give a person, whether healthy or sick, the ability to find a hidden radical that will be then successfully implemented in their real life.
The main results obtained today are an attempt to visualize via fMRI the phenomenology of new neural network formation using real and simulated (false) biofeedback, when the actual acquisition of a behavioral strategy is replaced by the random uncontrolled development of the game.
2. Study Design
The design of the experiment included two series of studies: the first one was dedicated to self-regulation training on a real biofeedback model, with voluntary cognitive control of involuntary physiological functions, during which the monitor showed the game and feedback signals, showing the body’s current functional state and the reactions, with new adaptive strategies and regulation methods developed. The main objective of this experiment was to search for markers of brain self-regulation mechanisms, in the form of a set of distributed voxels, which are areas of activity (AA).
The second experiment series allowed the qualitative characteristics of the true and simulated (so-called “false”) periods of the game to be described, based on a comparison of the AA dynamics between real learning of self-regulation skills, and conditions when the storyline changed randomly, independent of the actions of the subject.
The key characteristics of the chosen model of game biofeedback are as follows:
1) Every game is efficient, but the objectives pursued by players are subjective. Game biofeedback does not aim to gain material products, the “obvious” purpose here is to win, which is mentally and emotionally satisfying; an indirect goal is to develop new self-regulation and behavior strategies.
2) The main feature of game training is its competitive nature, which eliminates the monotony of the training procedure, since a fascinating story motivates the subject, making him emotionally interested in the result and contributing to a more effective method of self-regulation skills learning.
3) Winning requires non-trivial, innovative decisions, so the game can be described as a creative productive activity, which is also attractive due to the unpredictability of the result and the creative contribution required from the subject to remove this uncertainty. During the game new meanings are not only transferred but also created.
4) Regulated time—the start and finish times of the game are set so that the phenomenon of temporal uncertainty disappears.
5) The tension of the game tests the player’s abilities, as he/she is motivated by a desire to win and has to stay within the rules defined by the game and stay calm. The technology of game biofeedback allows one to determine the physiological markers of emotional stress, assess the current psychophysiological state. Generally speaking, one can monitor a number of physiological parameters as EEG rhythms, electromyogram (muscle tension), skin temperature, heart rate (HR), respiratory rate, and galvanic skin response during the game. In our study we used heart rate to control the game.
6) As every following game trial is based on the result of the previous one, game biofeedback is the key to the subject’s self-improvement and an impulse to search for new and efficient self-regulation strategies.
3. Materials and Methods
The study was conducted on volunteers, after their written consent and instructions from the Ethics Committee of the Institute of Molecular Biology and Biophysics SB RAMS were obtained. Fifteen healthy men, aged 18 to 30 years, with higher/incomplete higher education and without any prior experience of self-regulation and unfamiliar with the technology of biofeedback, were involved in the study. Each participant underwent two sessions of experimental self-regulation training. One of them was performed under real feedback conditions (socalled real training), during the other one there was simulation of controlling game (false training). Two types of sessions were randomly assigned and the subjects were not informed about the fact that there was no real feedback in one of two media trainings. Duration of each session was about 1 hour, the second session was conducted in 1 - 2 months after the first one to eliminate the residual skills obtained during training.
The scheme of the dynamic mapping of areas of brain activity during game biofeedback sessions is as follows: during the fMRI study, the subject was presented with the game “Vira!”, a virtual diving and treasure hunting competition. The subject controls one of the divers descending to the bottom. The player’s speed is determined by the heart rate: the slower the heart rate, the higher the speed. To defeat a competitor, one needs to develop the skills to voluntarily slow down one’s heart rate. Throughout the study, information about the state of the cardiovascular system—the heart rate—is transmitted via external feedback in the form of a visual bar on the screen, accessible to the subject through a system of mirrors. Based on the received information, a person uses certain techniques to develop the skill of self-regulation, while being in a magnetic field (Figure 1).
Design of the experiments: a) Monitoring the formation of activity zones and scanning them while the subject controls the game. b) The registering laptop and operators” computers are connected into a local network via an optical cable. The monitor displaying the game is located behind the magnet. c) Head receiving and transmitting coil with an oblique mirror allows the subject to see the screen. d) HR (pulse) is monitored by a wireless pulse detector device. II. The game “Vira!” screenshot.
The subjects performed tasks according to commands given via the intercom. The hardware and software complex “BOS-Pulse” (“Biofeedback Computer Systems”, Russia) and the game “Vira!” were used, including 15 trials.
The instructions to the subjects were as follows: a simulated diving competition is shown on the screen, and it is necessary to control the diver in a blue suit. The slower the heart rate, the higher the diver’s speed, and the faster he will descend to the bottom. The heart rate graph is shown in the bottom right window at the screen.
The competitor’s speed is calculated as the average heart rate in the previous trial. If a person wins, the screen displays the messages “Congratulations!” and the prize appears in the window. If a person loses, all the prizes disappear. The task for the subject is to win as many races as possible and to “bring up” all the treasures from the seabed. Neither keyboard nor mouse is required; the game is controlled using only a pulse detector.
Results of the game biofeedback were analyzed using “Report” software of “BOS-Pulse” complex and a spreadsheet in MS Excel 2007.
Completing the experiment task required alternating activity and rest phases, therefore, one minute rest periods were provided between the game trials. The duration of the RR interval (ms, the inverse value of HR) was monitored throughout the experiment, as it was the “target” of voluntary control. The subjects’ inter-beat-interval, while placed in the circular magnetic tomography device, was monitored by photoplethysmographic method using a wireless device, which was attached to the left index finger. The measurement values were transmitted using Bluetooth interface to the registering laptop placed behind the magnet, and running the app for the biofeedback of the “Vira!” game. Visibility of the monitor screen, located along the axis of the magnet at a distance of 2.5 m from the center, was provided with the help of the receiving and transmitting head coil with an oblique mirror.
Dynamic mapping was carried out using the Achieva Nova Dual (Philips, the Netherlands) MRI system with the magnetic field induction equal to 1.5 T. The main working T2*-weighted images were obtained using the 3D EPI (Echo Planar Imaging) with the 64 × 64 × 32 matrix, voxel size of 4 × 4 × 4 mm, repetition time TR = 3500 ms, echo time TE = 50 ms, and frame 3.5 seconds = TR. The experiment structure included periodic activations lasting 30 - 90 seconds, with one minute rests in between. A typical experiment consisted of 5 “rest-work” cycles, combining 3 game attempts in each of the five arrays. Statistical analysis and obtaining the fMRI images was performed using the software package Matlab
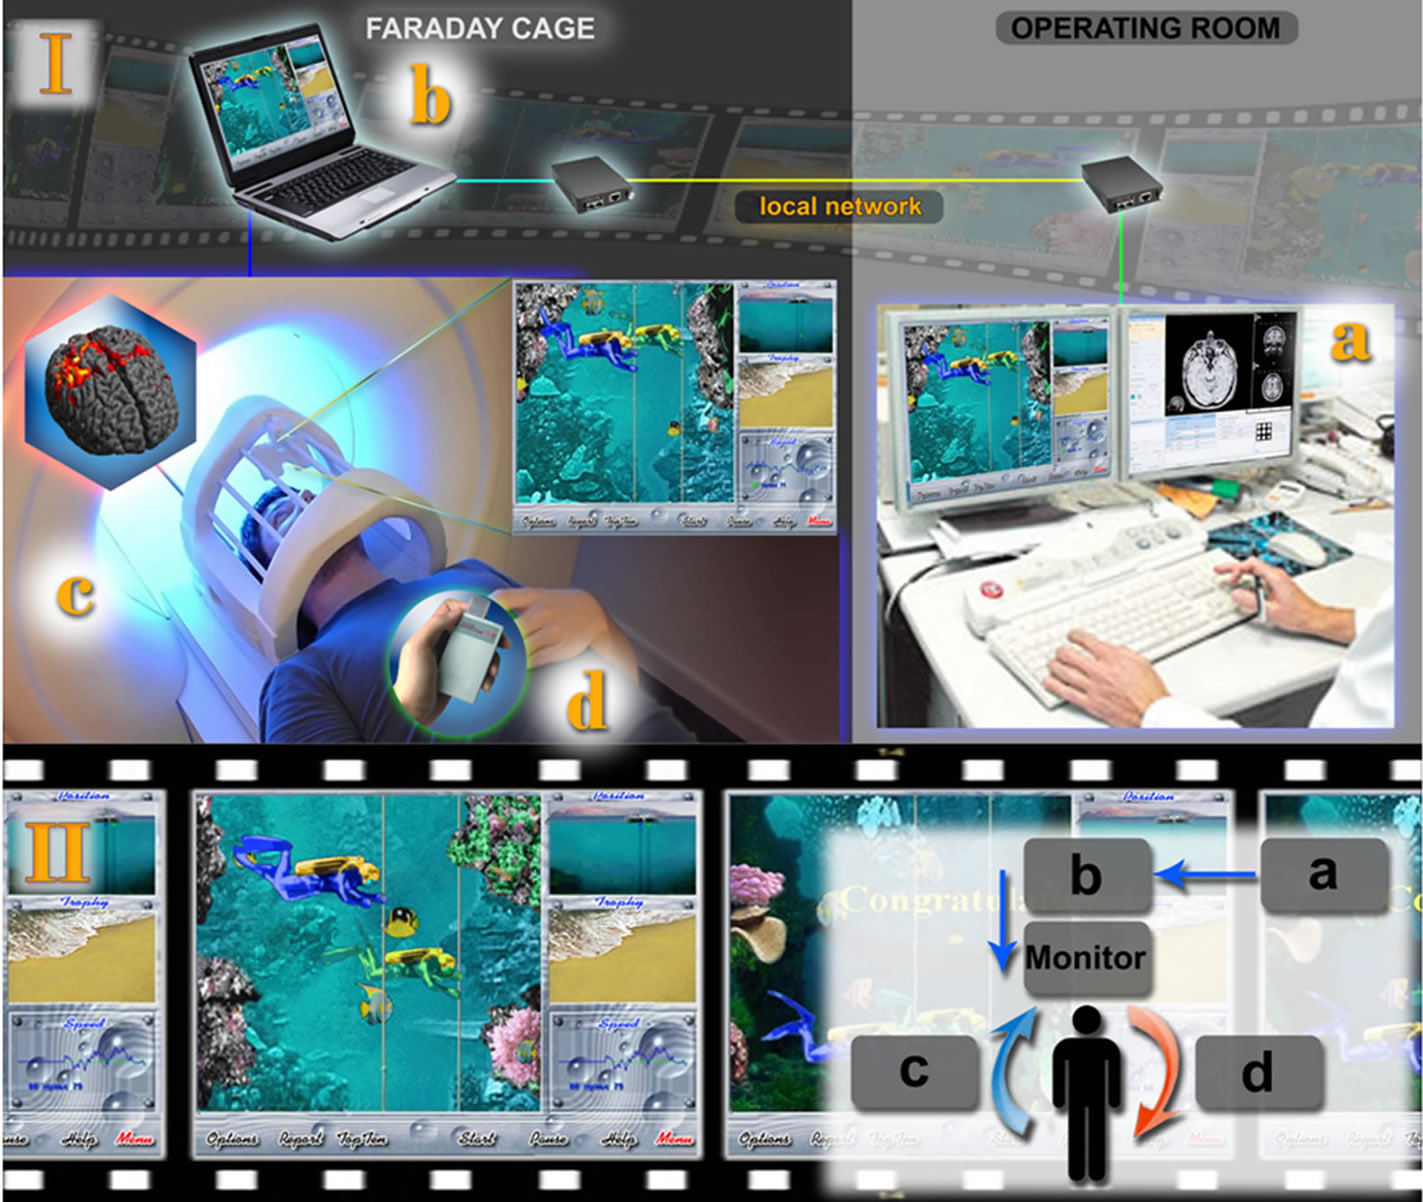
Figure 1. Design of the experiments on voluntary heart rate control in a competitive virtual game “Vira!” in a magnetic field.
(Mathworks Inc.) + SPM8 (Wellcome Trust Centre for Neuroimaging UC London). The data processing procedure included realignment of the frames to eliminate the effects of involuntary head movements of the trial subject, the normalization of images to obtain the standard brain form according to the Talairach atlas [20], the calculation of statistically significant zones of activation (the probability of a false-positive result, P < 0.05 FWE corrected). The result is presented as a reference T1- weighted 3D image in gray scale with colored zones applied to reflect the intensity of the BOLD-effect.
Data analysis was performed using the Statistics 8.0. The principal hypothesis to be tested statistically was the following, whether there were significant differences in activation of different brain structures during real or false “media training” in any of five game blocks. The within-subject (repeated measures) ANOVA in GLM procedure was used. There were three factors included into design: brain structures—to study spatial differences in neural network formation, game blocks—to follow temporal dynamics of learning, and feedback presence—to assess the effectiveness of the cognitive processes. MRI data in the form of statistically significant areas of activation (voxel volumes) were standardized according to the average volume of brain structures to which they belonged. This operation was performed to prevent the bias in comparison of activation zones caused by the variability of the volumes of brain structures. These standardized values were used as the dependent variable in the analysis of variance. Factor “structure” had 70 levels but under some conditions the activation volume was equal to zero for all 15 subjects. For example, there was no activation registered in Vermis cerebelli at Block 3 in real feedback regime, however all other 9 data sets of activation volumes of this brain structure had non-zero variance. Therefore we performed ANOVA for “structure” as a single independent variable with varied number of levels for each condition of 5 levels of “block” factor and of 2 levels of “feedback” factor, excluding constant (zero) data. The most activated areas were selected by means of post hoc comparison, Fisher LSD and Duncan’s range tests (alpha = 0.05). T-test was used for paired data comparison in testing activation differences between real and “false” feedback at some brain structures. Next, using repeated measures ANOVA with all 3 factors the main effects and interactions of all available experiment levels were analyzed simultaneously.
4. Results
1) The results of within-subject ANOVA for “structure” factor under ten combinations of temporal blocks and feedback presence are shown in Table 1. In each case F-statistics was obtained for all nonzero levels of brain structures activation, for example in first game block of real game biofeedback there were 60 variables to be included into analysis. The main effect of AA differences across the brain structures was significant in first three game blocks, there was no explicit diversity revealed in fourth and fifth blocks of real training session. As contrasted to first experimental series with real feedback in game training, all blocks of “false” feedback in second experimental series demonstrated high significance of this main effect.
The first study series demonstrated, specifically the data of dynamic brain mapping during cognitive (mental) control of a virtual competitive game, the wide involvement of the cortical areas, characterized by maximal values of activation in the mid-temporal, occipital, parietal and frontal regions, i.e. practically the whole cortex and cerebellum (Table 2).
Details of table 2: AA dynamics throughout the experiment undergo the following changes: the Middle Occipital Gyrus activation value increases significantly during the second stage of the experiment (mean value 1 = 33.8, 2 = 211.8) and the level of activation is maintained up to the fifth stage (the average activation volume = 129.4). The dynamics of cerebellar structures activation is also characterized by an increase in volume during the second stage of the game, followed by a decrease back to the initial values. Average values of Inferior Frontal Gyrus AA volume are 50.9; 251.5 and 126.8 during stages 1 to 3, respectively. The Middle Temporal Gyrus shows similar behavior, its average value is 115.4 voxels during the first stage, doubling in value by the second stage (240.5) and maintaining the activation volume of 211.7 voxels at the third stage. Unlike these structures, the Precuneus activation peak occurs during the third stage of the game when the activation volume increases five-fold as compared to the initial value.
The same trends can be observed in the simulation series as well. It should be mentioned, that the activation at the first two game stages under “false” feedback was several times higher than that under real feedback, and in the following blocks this distinction was decreasing.
2) The question about the temporal characteristics of the AA dynamics in the various brain structures remains the principal one; therefore, we tried to evaluate the changes of activation volume in graph mode, indicating the steepness of these simultaneous changes (Figure 2). In other words, this idea of AA growth may indicate the speed of the involvement (or vice versa, of decay) of new neural ensembles at a certain stage of voluntary mental control. The “nature” of the involvement and gradual shutdown of NE, forming new neural ensembles, which present the most important stage of cognitive control, was studied using this method. It indicated the predominantly cortical nature of the first stages of the game.
The “peak” activation of the newly formed neural network occured during the second stage of game biofeedback.
The data of the BOLD-effect spatial dynamics—the activation zones—of one of the study subjects is shown as an example (Figure 3).
3) The analysis of game biofeedback dynamics allowed the leading self-regulation strategy (SS) for each subject to be determined, according to the classification we proposed earlier [13], as well as the degree of its effectiveness. The dynamics of RR intervals were evaluated by analyzing 15 game trials. The comparison of the “real” and “simulated” (false) biofeedback data was performed. The dynamics of RR interval length were similar during both stages of the experiment, but the lack of true feedback encouraged the subjects to search more intensively for a way of “solving” the game, which was reflected by an increase in the spread of RR values (Figure 4).
Both real and simulated biofeedback, when there was random plot development, were accompanied by a significantly expressive dynamic picture of redistribution of the regions of interest (Table 3).
The maximum increase in volume activation occurs during the second stage of game biofeedback, after 8 - 12 minutes of engaging in the real or false game, when AA increase multiple times as compared to the initial values. As the game progresses, these values decrease considerably. The patterns detected are quite common for both designs, with qualitatively similar changes (trends) in the true and false modes (Figure 5). Regretfully, a significant difference between these versions was not revealed by means of GLM analysis.
Repeated-measures ANOVA with three factors (“feedback” * “block” * “structure”) was performed for all 5 game blocks, 2 levels of factor “feedback” and for 53 brain structures with non-zero activation under all condi-
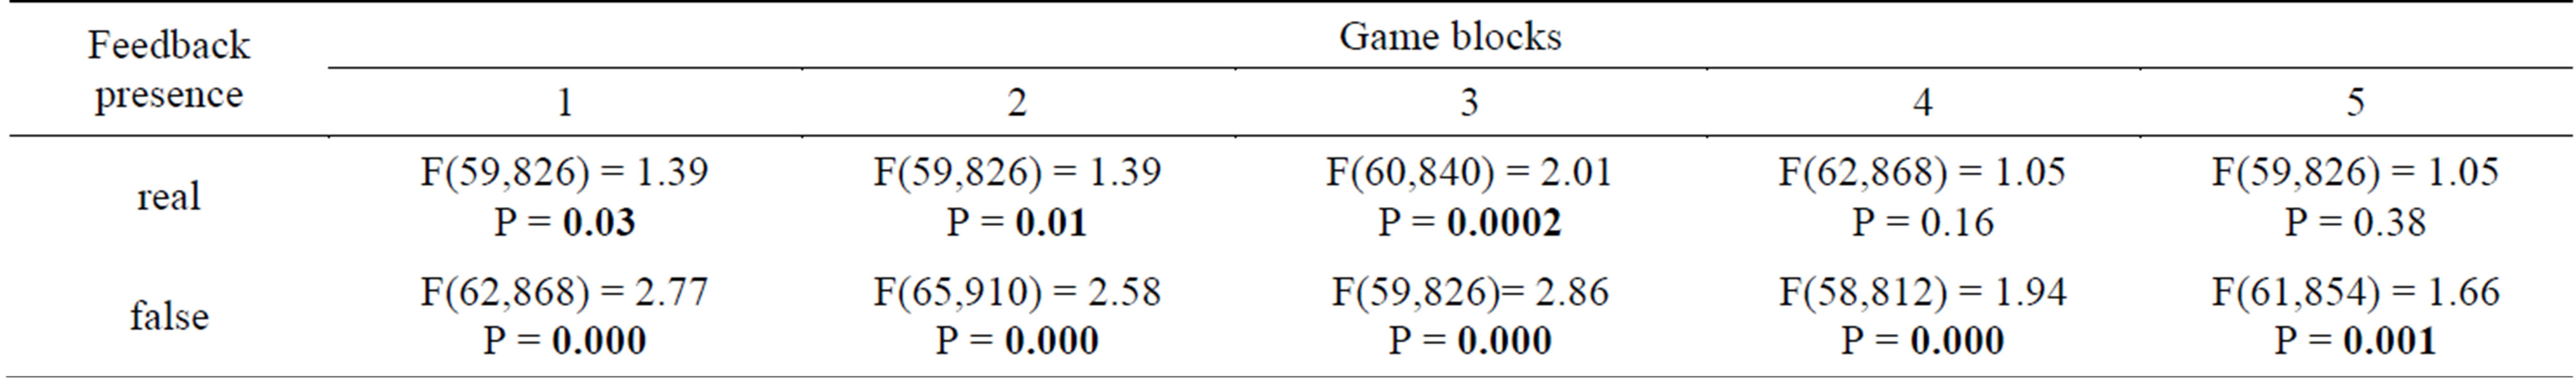
Table 1. The spatial differences in neural network formation testing by Within-Subject ANOVA (main effects). Dependent variable—standardized values of voxel volumes.
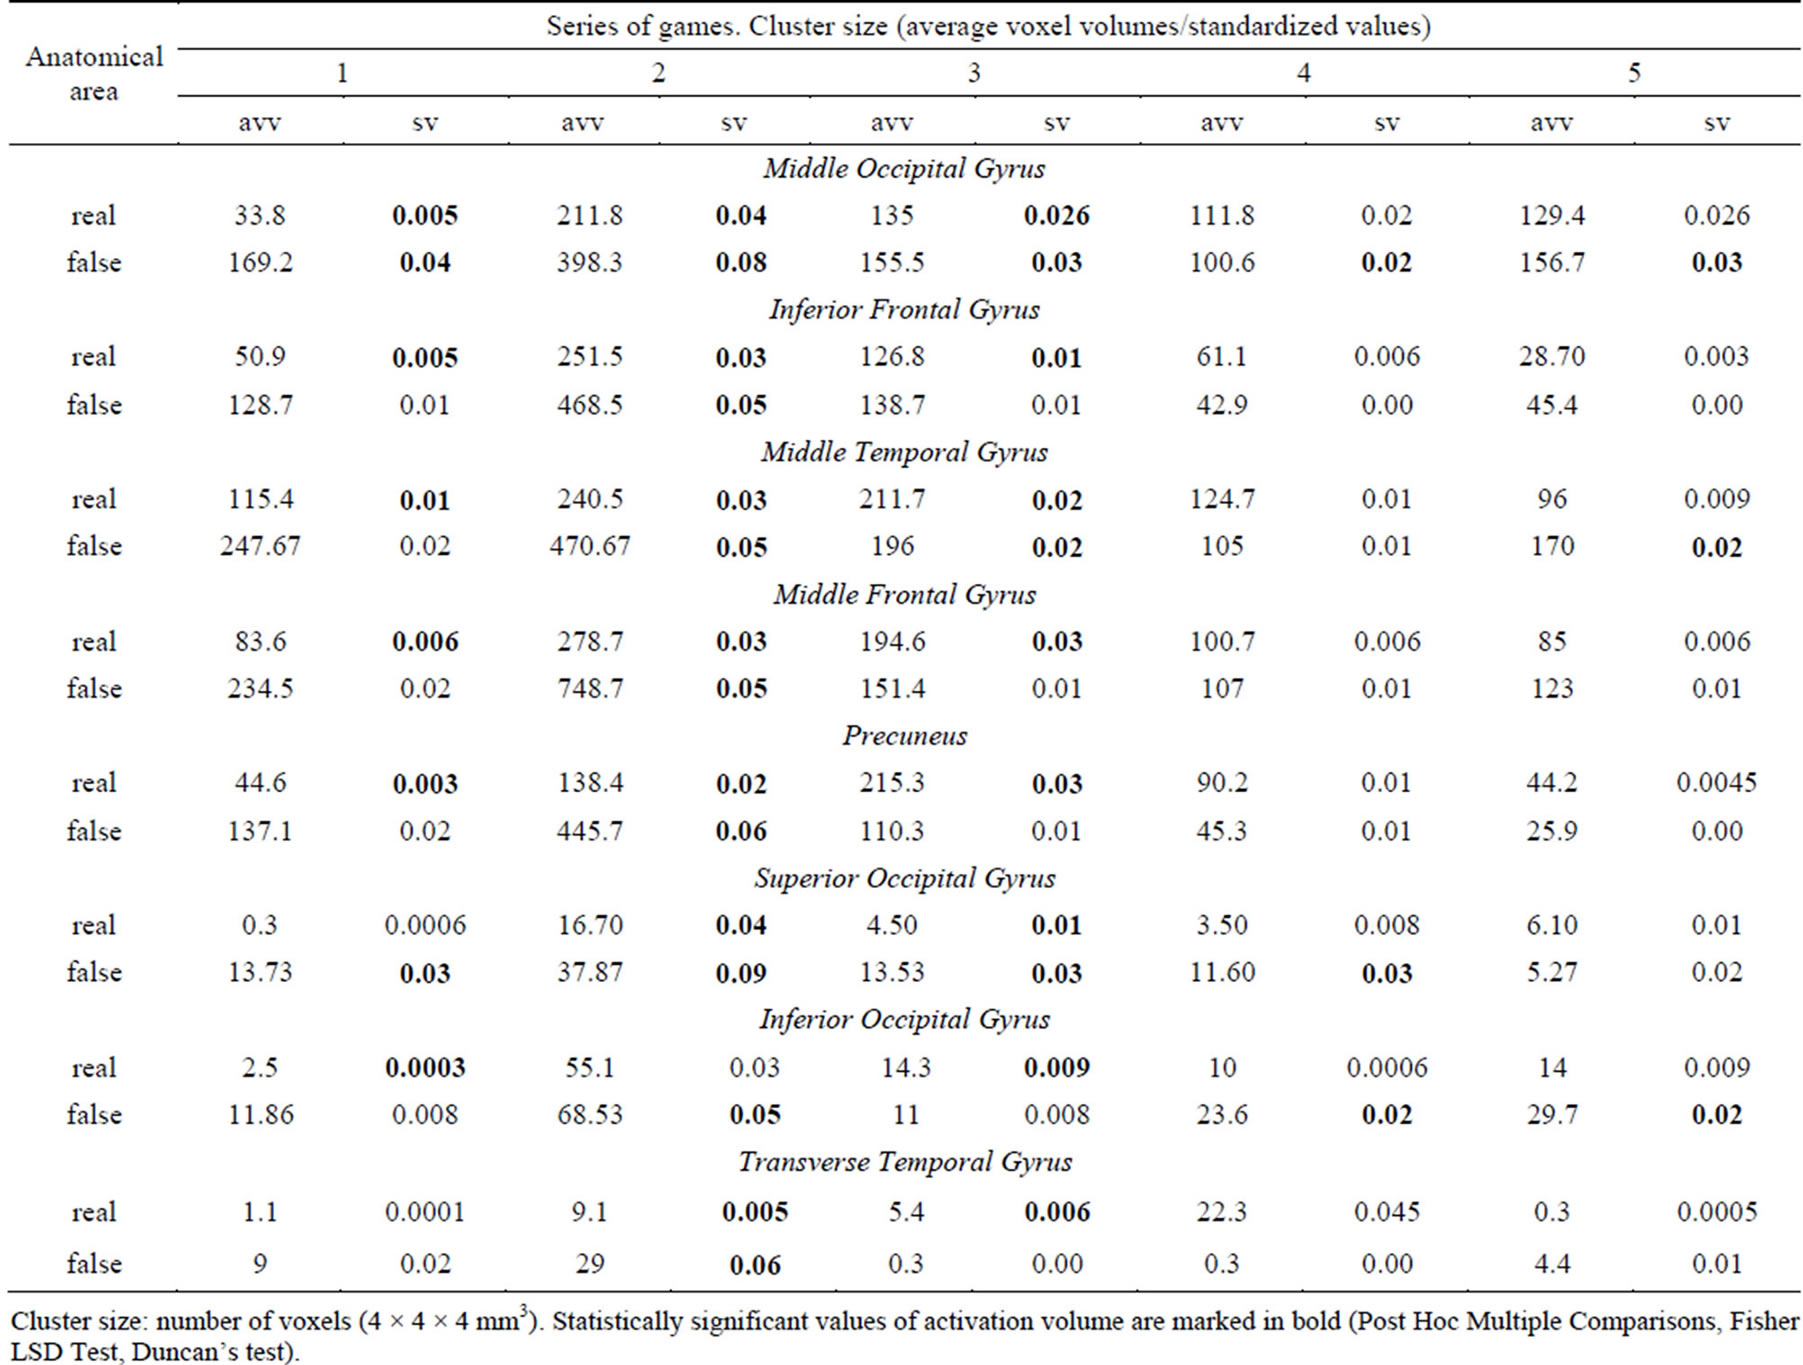
Table 2. Stage-by-stage AA dynamics during real and simulation biofeedback. A list of important activation areas.
Cluster size: number of voxels (4 × 4 × 4 mm3). Statistically significant values of activation volume are marked in bold (Post Hoc Multiple Comparisons, Fisher LSD Test, Duncan’s test).
tions. The result of effective hypothesis decomposition was the following: main effect of factor “feedback” was not significant, F(1, 14) = 1.69, p = 0.213, main effect of “block” might be considered as marginally significant, F(4, 56) = 2.17, p = 0.083, “structure” factor was high significant, F(52, 728) = 5.34, p < 0.0001. The last result was easily predictable on the basis of one-way analysis of variance discussed above. All paired interactions with “structure” factor were significant; for “block” it was F(208, 2912) = 1.37, p = 0.0004, and for “feedback” – F(52, 728) = 1.88, p = 0.0002. Interaction “feedback” * “block” and all three factors interaction (“feedback” * “block” * “structure”) were not significant (F(4, 56) = 1.28, p = 0.286 and F(208, 2912) = 0.88, p = 0.87, respectively). It may be explained by within-group variability of AA variable since there were almost always zero values at some subjects among data of high activation of other participants. Increasing the sample size may provide a more reliable assessment of the effects of interactions in the time domain.
4) A comparative analysis of the dynamics of the experimental models of biofeedback showed overlapping areas, the regions of interest, in both versions of the experiment, but the simulation mode was represented by

Figure 2. AA dynamics during the fMRI study (a model of real biofeedback).
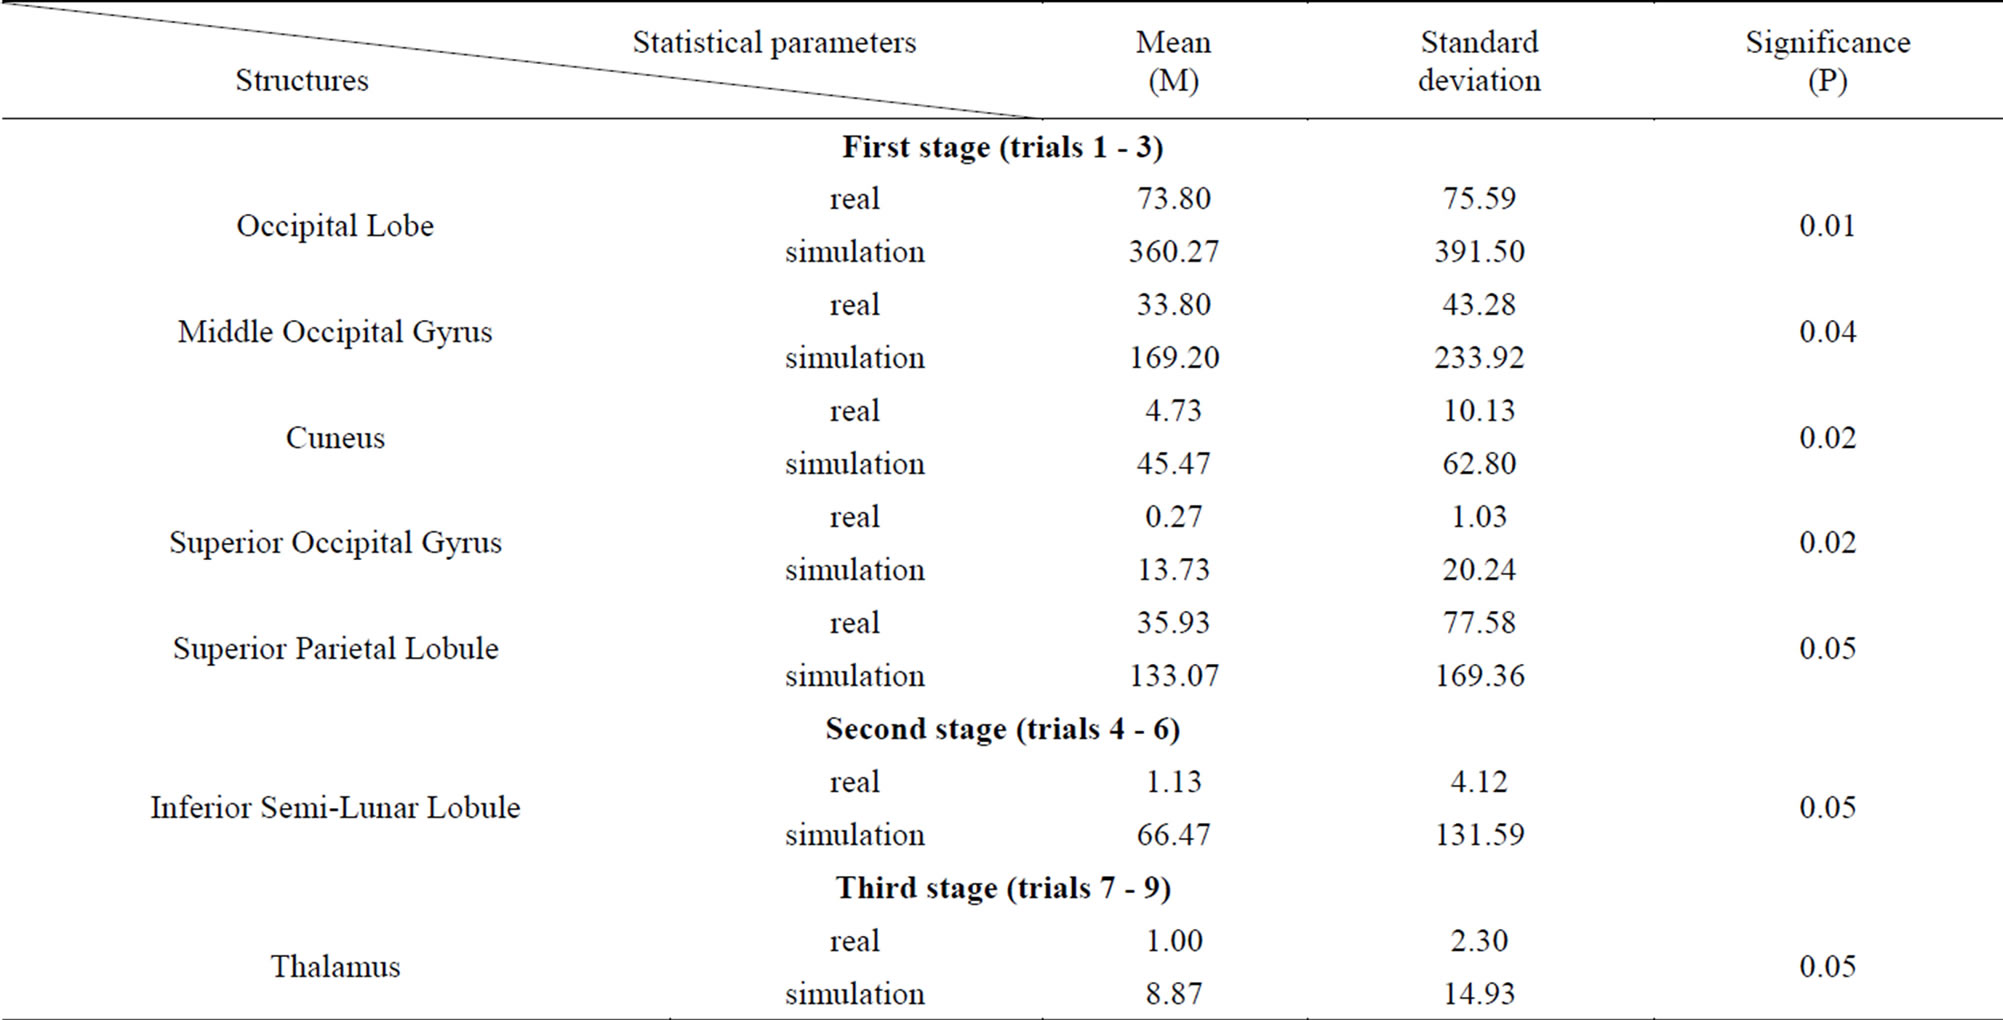
Table 3. A comparative analysis of the dynamics of real and imitation biofeedback (T-test for dependent samples).
higher AA values (Table 3). The largest difference in activation during the first stage is represented by such structures as the Middle Occipital Gyrus (Brodmann area 17), the Superior Occipital Gyrus (Brodmann area 19), the Cuneus, and the Superior Parietal Lobule (Brodmann area 7), where the feedback simulation mode is characterized by significantly higher AA than those during real media training. Almost all the sensory modalities are present in these cerebral cortex areas.
The biggest difference between the real and false biofeedback during the second stage of the study (game trials 4 - 6) is found in the cerebellar Inferior Semi-Lunar Lobule, whose activation volume is 58 times larger during the simulation mode of the experiment. Both the lower and upper segments correspond to the Tuber Vermis and form the posterior lobe of the cerebellum. These structures are included in the descending cerebellar nucleus tract, connecting the vermis and the reticular formation of the medulla oblongata.
Data analysis from the fourth and fifth stages of the game did not reveal any significant differences in the volume of brain activation between the presented models of biofeedback, which is explained by an overall decrease in the activated zones, as compared to the first stage of the game.
Let”s consider the dynamics of inclusion of the newly created neural network of cortical areas (according to Brodmann) into the organization, during real and simulated biofeedback (Figure 6).
The figure shows the AA distribution during real and “false” (simulation) training. The projection of real training onto the map of architectonic areas of the cortex,
 (a)
(a)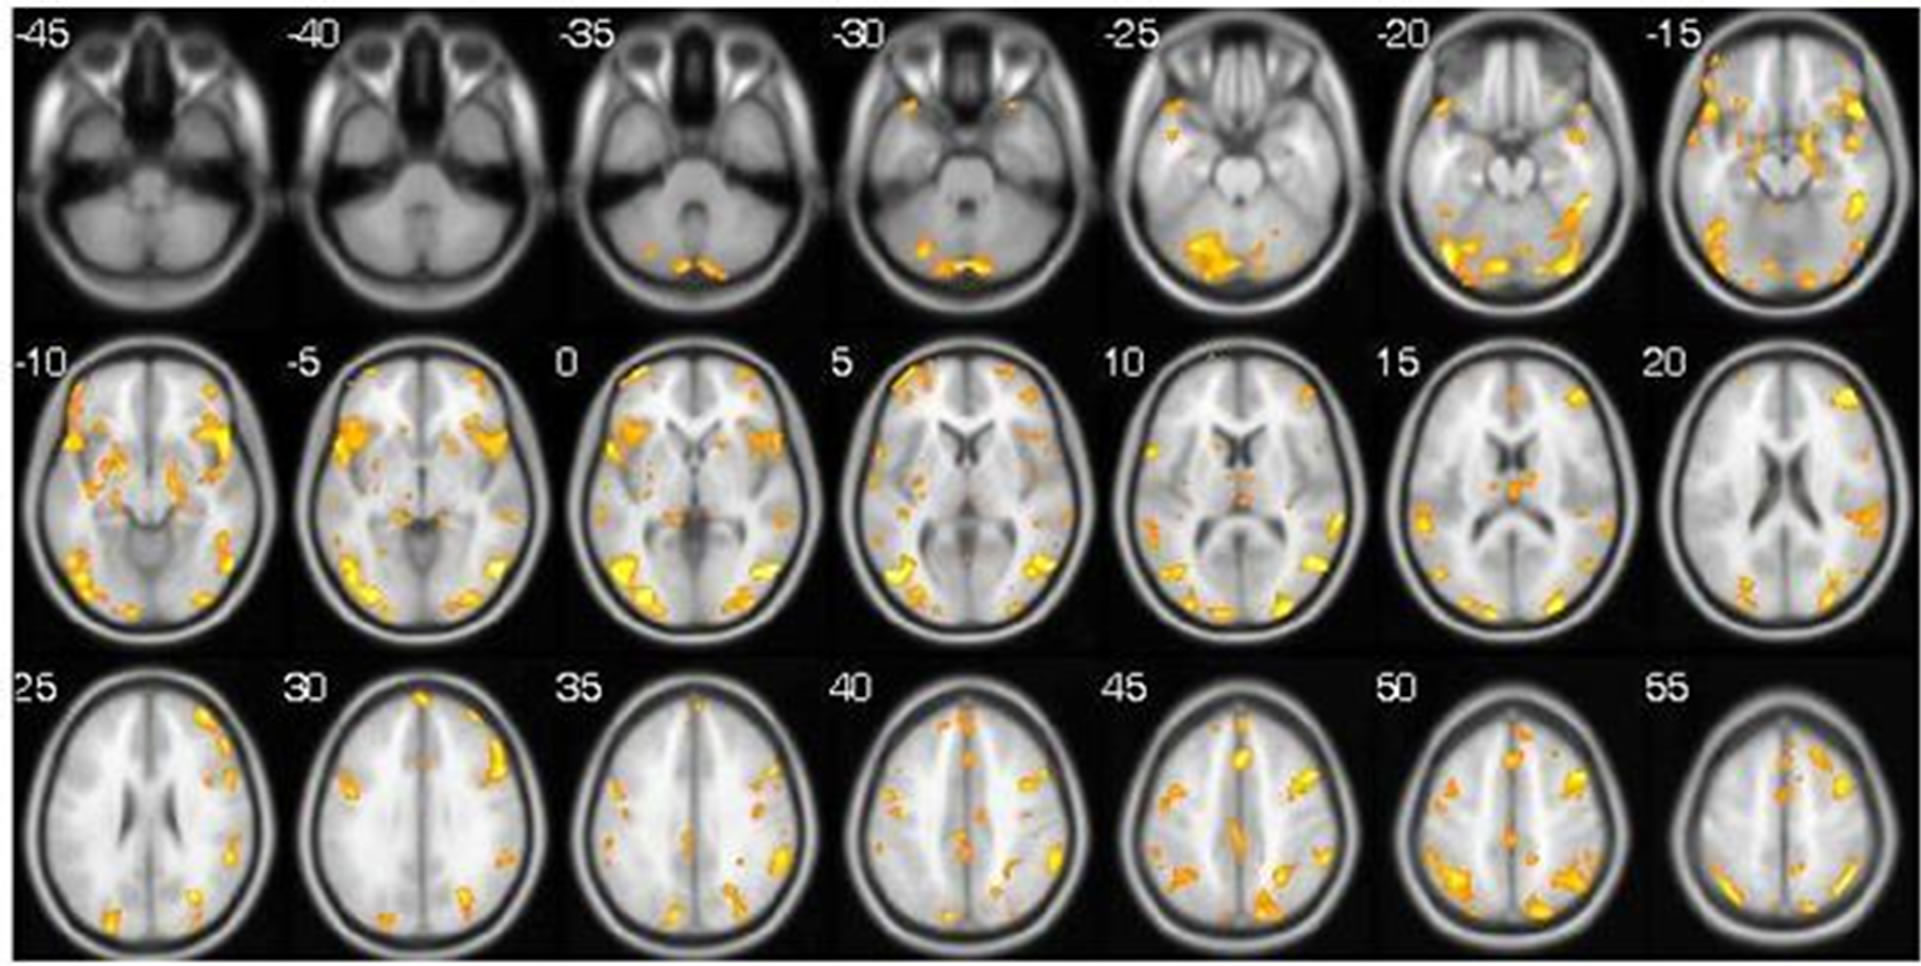 (b)
(b) (c)
(c)
Figure 3. (a) The beginning of the experiment. Main activity areas are the 7th, 37th and 40th Brodmann areas, bilateral hemispheres of the cerebellum, and the parahippocampal gyrus. (b) Second stage of the competition. The number and volume of activity areas are increased. New AA are formed in the cerebellum (compare 35, 30, 20, 15) and Brodmann areas 19, 37, 39, 40 and 47 (visual, mnemonic and affective volition areas of the cerebral cortex). Immersion in a virtual story brings about the large involvement of cortical areas, which are characterized by high values of voxels in the middle-temporal, occipital and frontal regions. (c) Game finish. Activity areas are maintained in the bilateral posterior cerebellar lobes, the pyramids, declive, the middle frontal and occipital gyrus. The volumes of the remaining AA are decreasing.
according to Brodmann [20], is as follows: it is mainly the 37th area during the first stage (average activation volume = 30.8 voxels), areas 2, 7, 39 and 44, with the second and the third stages characterized by further involvement of activation areas of the cortical structures of areas 9, 19, 22 and 40. During the subsequent stages, the activation volumes decline and AA are maintained in

Figure 4. Examples of changing RR interval length during fMRI studies in the game “Vira!”: real and simulation modes.
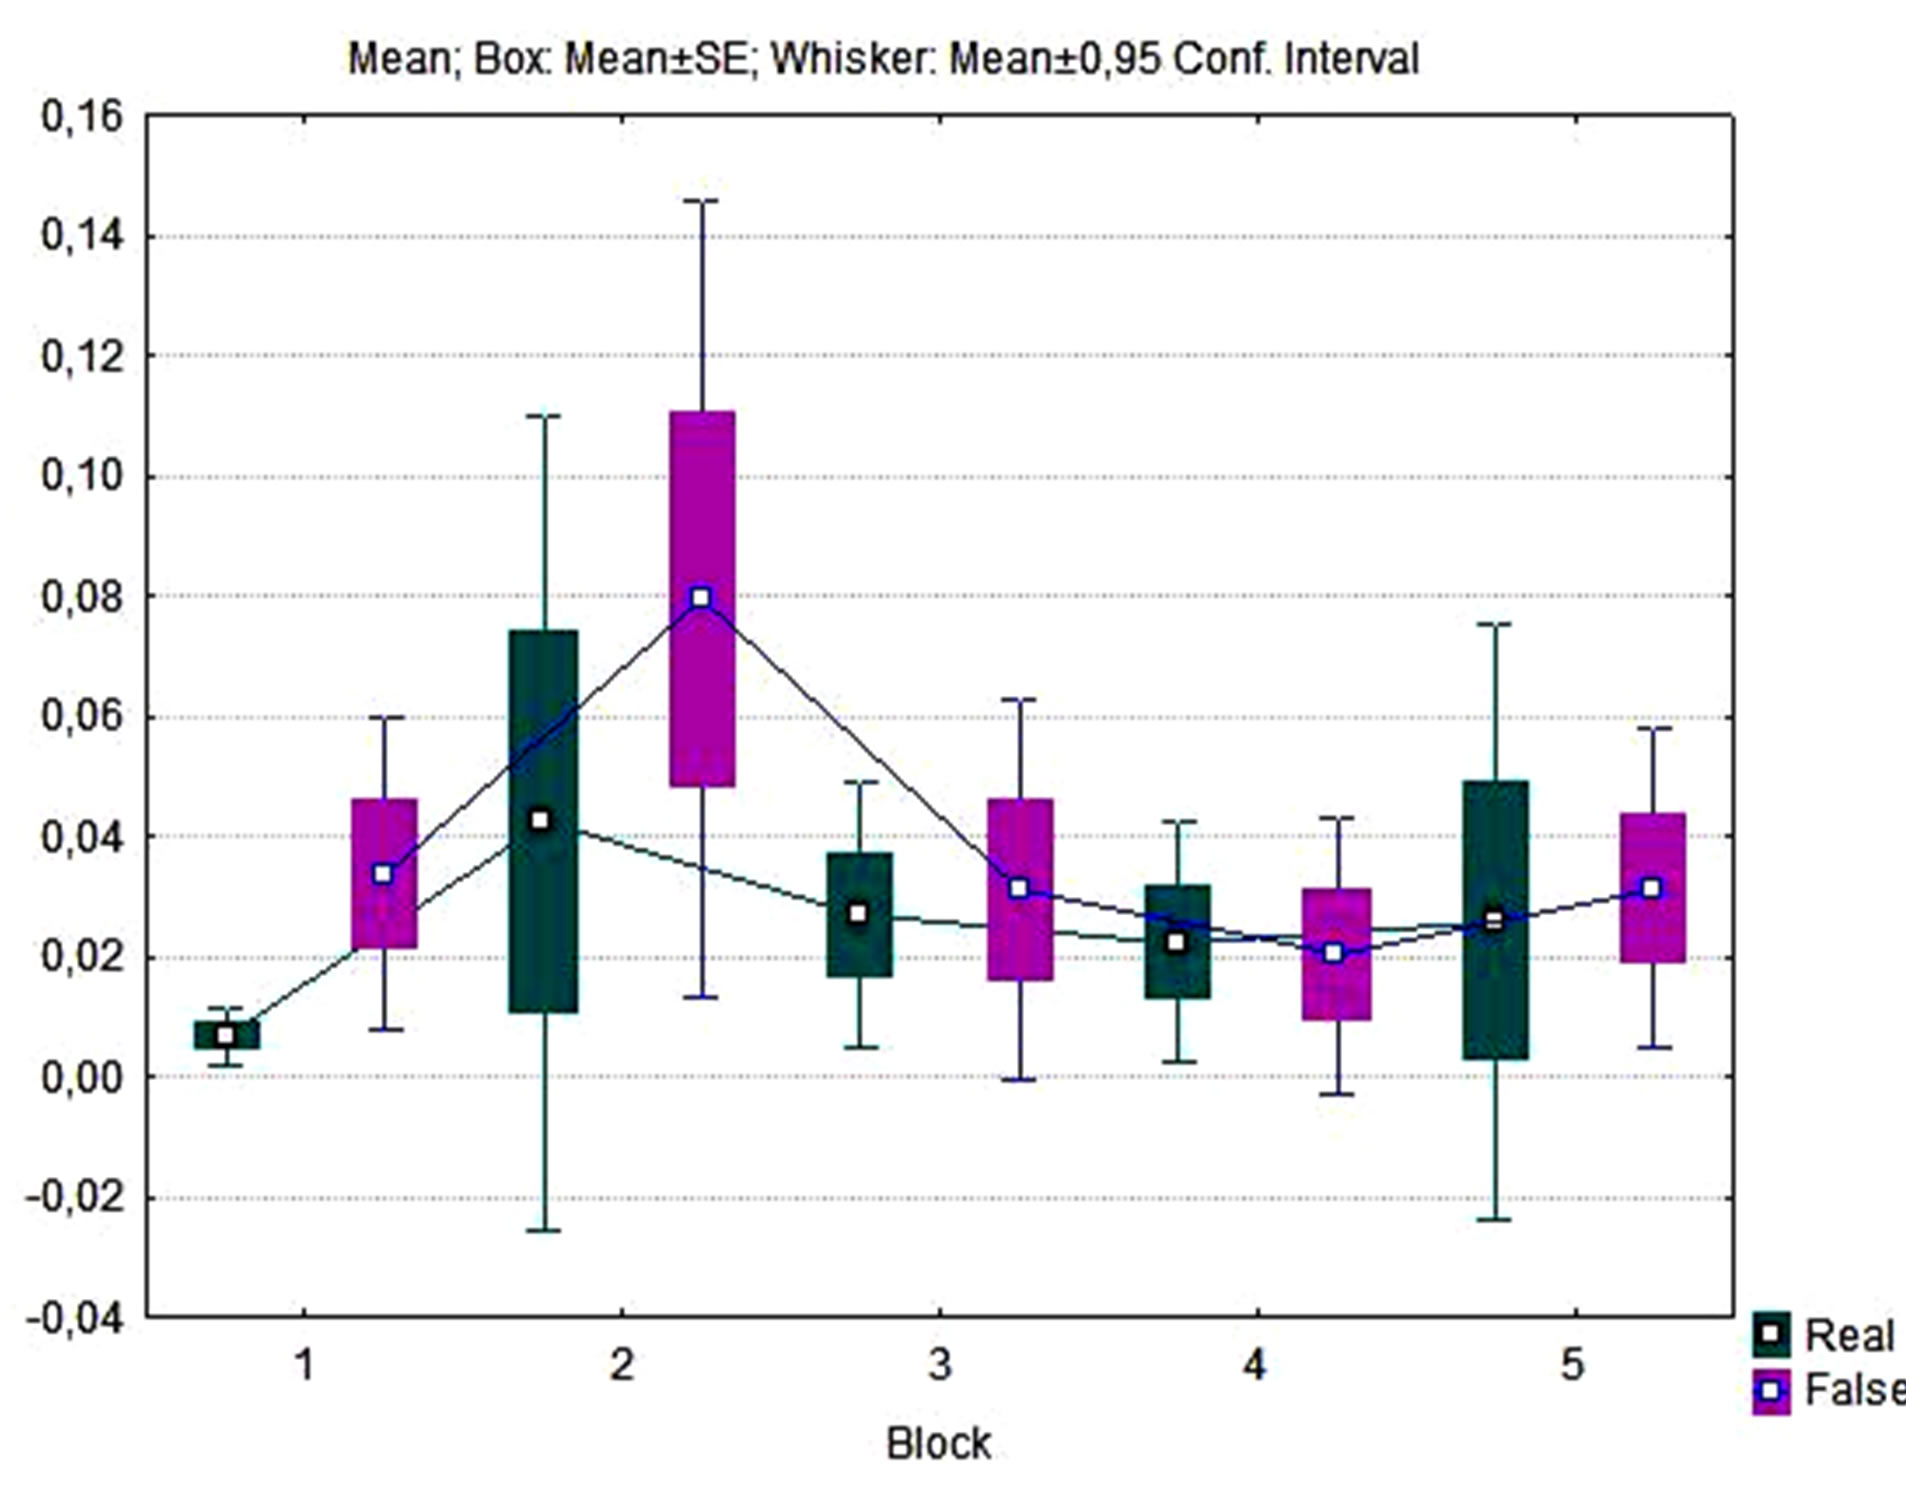
Figure 5. Box plot of dynamics of Superior Occipital Gyrus AA (in standardized values) grouped by game blocks observed in real biofeedback and false feedback experiment series.
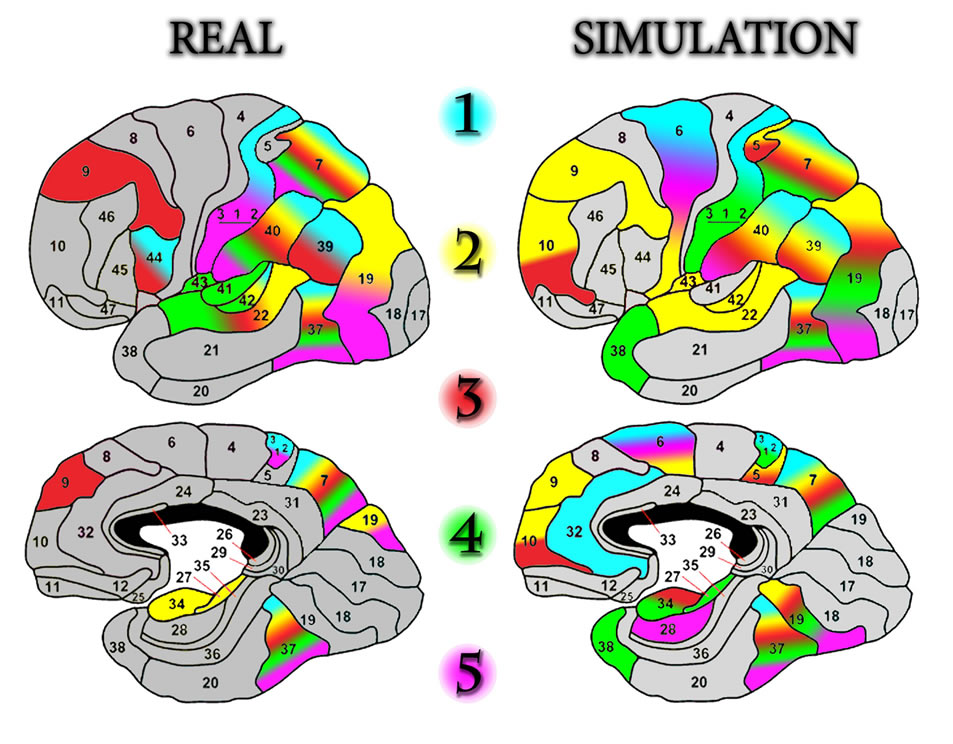
Figure 6. The dynamics of activation of the Brodmann areas during the study. Each of the five experimental stages (blocks) is marked with a specific color to reflect the dynamics of brain activation in a particular Brodmann area.
areas 7, 37 and 40. The dynamics of the Brodmann area volumes, represented at all stages of the real training, is as follows: the average activation volume of Brodmann area 7 during the first stage = 38.73, second stage = 109.20, third stage = 126.07, fourth stage = 78.27, fifth stage = 48.27. For Brodmann area 37, the values are: 30.8, 50.3, 48.6, 33.3, 25.0. For Brodmann area 40, the values are: 31.9, 120.5, 124.1, 73.3, 70.4.
The simulation model of biofeedback mainly involves areas 7, 19, 37, 39 and 40. Unlike the real training, large activation volumes are found in area 5 (max. average value during the experiment is 41.1) and area 6 (the dynamics of average activation volume values at stages 1-5: 181.9, 316.9, 94 8, 46.5 and 104).
5. Discussion
The initial limitations specified by the authors are obvious when looking carefully at the article title. The study aimed to describe the time-related changes occurring in the brain structures as detected by fMRI, at different stages of the real and the simulated game, mentally controlled by a physiological characteristic, the heart rate, with a subsequent attempt to link the AA changes with the psychological stages of the competition. Of course, we wanted to use the fMRI vocabulary to explain key psychological game moments, but this seems unattainable at the present time. We had to get the results of the mapping and transport them to the obvious psychophysiological aspects of game training, and we think that we succeeded in this task.
The start and finish “territories”, created by the controlled game, are different from each other. The initial picture is characterized by areas of activity primarily in the 7th, 37th and 40th Brodmann fields of corresponding areas in the hemispheres. The posterior parts of the brain, particularly the cerebellum, are in a state of “default”. Everything changes qualitatively at the peak of the game, during the 4th to 6th attempts: the paired cerebellar hemispheres, the cerebellar vermis, cerebellar pyramids, the declive, and the amygdala, become the new regions of interest. Clusters form in the Brodmann areas 19, 22, 39, 40, 42 of the cortex, more clearly during false media training. This suggests the subsequent involvement of new and/or the recruitment of pre-existing cortical NE, occurring at the 8th to 12th minute of the game. False biofeedback is accompanied by a strong clustering of these AA, which first of all can indicate an expanding scope of the participating neural ensembles and the mobilization of additional network resources.
The localization of the dynamics of the activity areas in the cerebellum allows us to hypothesize that the cerebellum acts here as a modulator of cognitive function, controlling, in this case, the speed, strength, rhythm and precision of thought, similar to the list of properties of the motor functions that it controls, sequentially deploying the program of cognitive operations in the gaming mode, organized by the adaptive feedback.
If one attempts to make a temporal “road map” of the real cognitive control of a virtual competitive game, the sequence of brain structures involvement is as follows: initially the extensive cortical fields are involved, then the area of the cuneus and the precuneus, and only after that the cognitive route reaches the cerebellum.
Thus it can be said that a frontal-temporal-parietaloccipital network is formed in the process of media training, which is responsible for focused attention (Brodmann area 7) and the cognitive control of the virtual game. In the early stages, the occipito-temporal, the rostral portion of the post-central gyrus (related to the primary somato-sensory projection) and the upper parietal operculum are activated. The second stage is characterized by a significant expansion of the activated areas by the bilateral superior temporal and supramarginal gyri.
When comparing the dynamics and quantitative characteristics of the AA during false and real biofeedback, we found them to be very close to the trends described by G. Jackson, made in the paradigm of “polyglot” [21]. Let us recall the aim of the research: several subjects, who were in a magnetic field, were encouraged to compose a story in four languages—English, German, French and Italian, while having a good knowledge of only two of them. Mapping of successful and unsuccessful experiments showed overlapping regions of interest, but the volume of activation in the case of poor knowledge of the language was much larger. A “similar” result was obtained in our research: the simulation and real modes of biofeedback were characterized by overlapping AA, but the quantitative characteristics were significantly larger during the simulated “false” stage (Table 2). These two experimental situations are identical in their psycho-physiological sense: the lack of feedback (poor knowledge of the language or virtual game simulation) requires a substantial expansion of brain activity areas and the volume of their activation. The presence of real feedback reduces the number and volume of AA (without changing their topography), thereby optimizing the learning of self-regulation skills; in this case feedback is a means of monitoring the effectiveness of the cognitive activity “product”.
Certainly visualization technologies are these days providing a completely new dimension of psychological and psycho-physiological phenomena to the researchers, providing a deeper insight into the problems. It is natural to want to bring the psychological vocabulary closer to the specific vocabulary of MRI, which seems difficult at present.
The results obtained in this study suggest that using a combination of fMRI and high-resolution computer EEG allows the visualization of the intracerebral structures that control the particular strategy of self-regulation, with the mechanisms of these strategies obviously dictated by the psycho-physiological and genetic characteristics of the phenomenon itself. Further accurate analysis of the dynamics of AA in the process of the development of self-regulation skills using biofeedback technology will continue, however, the factual material presented in this paper seems to be sufficient to introduce it to the problem community1.
6. Conclusion
Summing up the discussion on the use of real feedback or its imitation, it should be noted that the effects of media training are not only necessarily limited to an increase or decrease of the RR interval length, but as a result, the acquisition of self-regulation skill. In the context of the study, the concept of perfecting may be possibly more informative, which correlates not only with the category of the game’s aim (learning to reduce the heart rate), but also with the category of means (methods and strategies of self-control), allowing one to reach a goal. Indeed, if the same result can be achieved with less exertion of the body’s regulatory systems, with greater confidence and flexibility, such as in the case of real feedback, it is reasonable to accept these characteristics of a completed task as signs of improvement.
Acknowledgements
This work was supported by an integration grant from the Siberian Branch of the Russian Academy of Sciences and Siberian Branch of the Russian Academy of Medical Sciences No. 28B-2012..
REFERENCES
- G. N. Boldyreva, L. A. Zhavoronkova, E.V. Sharov, et al., “EEG-fMRI Analysis of the Functional Specialization of the Human Brain in Normal and Cerebral Pathology,” Medical Imaging, Vol. 1, 2012, pp. 15-25.
- G. N. Boldyreva, L. A. Zhavoronkova, E. V. Sharov, et al., “EEG-fMRI Study of Healthy Human Brain Responses to Functional Loads,” Human Physiology, Vol. 35, No. 3, 2009, pp. 20-30. http://dx.doi.org/10.1134/S0362119709030037
- H. Endepols, S. Sommer, H. Backes, et al., “Effort-Based Decision Making in the Rat: An [18F]Fluorodeoxyglucose Micro Positron Emission Tomography Study,” The Journal of Neuroscience, Vol. 30, No. 29, 2010, pp. 9708- 9714. http://dx.doi.org/10.1523/JNEUROSCI.1202-10.2010
- H. Lee, M. W. Voss and R. S. Prakash, “Videogame Training Strategy-Induced Change in Brain Function during a Complex Visuomotor Task,” Behavioral Brain Research, Vol. 232, No. 2, 2012, pp. 348-357. http://dx.doi.org/10.1016/j.bbr.2012.03.043
- S. Ogawa, T. Lee, A. S. Nayak and P. Glynn, “Oxygenation-Sensitive Contrast in Magnetic Resonance Image of Rodent Brain at High Magnetic Fields,” Magnetic Resonance in Medicine, Vol. 14, No. 1, 1990, pp. 68-78. http://dx.doi.org/10.1002/mrm.1910140108
- N. A, Schnaider S. N. Shilov, M. B. Shtark, et al., “Techniques of Functional Magnetic Resonance Imaging Used in the Diagnosis of Attention Deficit and Hyperactivity Disorder,” Functional Diagnostics, Vol. 2, 2007, pp. 75- 81.
- M. B. Shtark, A. M. Korostishevskaya, M. V. Rezakova and A. A. Savelov, “Functional Magnetic Resonance Imaging and Neuroscience,” Successes of Physiological Sciences, Vol. 43, No. 1, 2012, pp. 3-29.
- V. L. Ushakov, V. M. Verhlyutov, P. A. Sokolov, et al., “Activation of the Brain Structures on fMRI Data When Viewing Movies or Recalling Demonstrated Actions,” Journal of Higher Nervous Activity, Vol. 61, No. 5, 2011, pp. 553-565.
- M. Wilke, S. K. Holland, J. S. Myseros, et al., “Functional Magnetic Resonance Imaging in Рediatrics,” Neuropediatrics, Vol. 34, 2003, pp. 225-233.
- L. A. Chernikova, M. E. Ioffe, S. N. Busheneva, et al., “Electromyographic Biofeedback and Functional Magnetic Resonance Imaging in Post-Stroke Rehabilitation (Demonsrated in the Learning of Precision Grasp),” The Bulletin of Siberian Medicine, Vol. 2, 2010, pp. 12-16.
- A. Y. Kaplan, J. J. Lim, K. S. Jin, et al., “Unconscious Operant Conditioning in the Paradigm of Brain-Computer Interface Based on Color Perception,” International Journal of Neuroscience, Vol. 115, 2005, pp. 781-802.
- A. Ya. Kaplan and A. Yu. Zhigalov, “The Dynamic of Human EEG Alpha-Activity in the Loop of Brain-Computer Interface during Trigger Photo Stimulation,” Bulletin of Siberian Medicine, Vol. 9, No. 2, 2010, pp. 7-11.
- K. G. Mazhirina, “Personality Characteristics and Dynamics of Self-Regulation during Game Control,” Thesis for PhD in Psychology, Novosibirsk, 2009.
- M. W. Voss, R. S. Prakash and K. I. Erickson, “Effects of Training Strategies Implemented in a Complex Videogame on Functional Connectivity of Attentional Networks,” Neuroimage, Vol. 59, No. 1, 2012, pp. 138-148. http://dx.doi.org/10.1016/j.neuroimage.2011.03.052
- N. Weiskopf, F. Scharnowski, R. Veit, R. Goebel, et al., “Self-Regulation of Local Brain Activity Using Real-Time Functional Magnetic Resonance Imaging (fMRI),” Journal of Physiology (Paris), Vol. 98, 2004, pp. 357-373.
- K. G. Mazhirina, M. A. Pokrovsky, M. V. Rezakova, A. A. Savelov, O. A. Savelova and M. B. Shtark, “Neuroimaging of the Dynamics of Real and Simulated Biofeedback In-Line of Functional Magnetic Resonance Imaging,” The Bulletin of Experimental Biology and Medicine, Vol. 154, No. 12, 2012, pp. 664-669.
- M. V. Rezakova, K. G. Mazhirina, M. A. Pokrovsky, A. A. Savelov, O. A. Savelova and M. B. Shtark, “Dynamic Mapping of the Brain and Cognitive Control of a Virtual Game (Research by Using Functional Magnetic Resonance Imaging),” The Bulletin of Experimental Biology and Medicine, Vol. 154, No. 12, 2012, pp. 669-674.
- M. V., Rezakova K. G. Mazhirina, M. A. Pokrovsky, A. A. Savelov, O. A. Savelova and M. B. Shtark, “Functional Magnetic Resonance Imaging in the Study of Dynamic Brain Mapping and Cognitive Control of a Virtual Game,” The Bulletin of Siberian Medicine, Vol. 5, 2012, pp. 105- 107.
- J. Sulzer, S. Haller, F. Scharnowski, N. Weiskopf, et al., “Real-Time fMRI Neurofeedback: Progress and Challenges,” NeuroImage, Vol. 76, 2013, pp. 386-399. http://dx.doi.org/10.1016/j.neuroimage.2013.03.033
- J. Talairach, “Co-Planar Stereotactic Atlas of the Human Brain,” Thieme Medical Publishers, New York, 1988.
- G. Jackson, R. Briellmann, A. Waites, et al., “Functional MRI,” In: G. A. Webb, Ed., Modern Magnetic Resonance, Pt. 2, Springer, New York, 2008, pp. 1037-1050.
NOTES
1The authors were inspired by the article of James Sulzer and colleagues (NeuroImage, 2013) [19], who perfectly analyzed the organic complementarity between biofeedback and fMRI. We are sincerely grateful to the author.