Agricultural Sciences
Vol.4 No.8A(2013), Article ID:36456,10 pages DOI:10.4236/as.2013.48A008
Evaluation of alternative methods for estimating reference evapotranspiration
![]()
1USDA Agricultural Research Service, Crop Production Systems Research Unit, Stoneville, USA; *Corresponding Author: daniel.fisher@ars.usda.gov
2Mississippi State University, Delta Research and Extension Center, Stoneville, USA
Copyright © 2013 Daniel K. Fisher, H. C. Pringle III. This is an open access article distributed under the Creative Commons Attribution License, which permits unrestricted use, distribution, and reproduction in any medium, provided the original work is properly cited.
Received 6 July 2013; revised 6 August 2013; accepted 25 August 2013
Keywords: Reference Evapotranspiration; FAO-56; Penman-Monteith; Turc; Hargreaves; Reduced Set; Irrigation Scheduling
ABSTRACT
Evapotranspiration is an important component in water-balance and irrigation scheduling models. While the FAO-56 Penman-Monteith method has become the de facto standard for estimating reference evapotranspiration (ETo), it is a complex method requiring several weather parameters. Required weather data are oftentimes unavailable, and alternative methods must be used. Three alternative ETo methods, the FAO-56 Reduced Set, Hargreaves, and Turc methods, were evaluated for use in Mississippi, a humid region of the USA, using only measurements of air temperature. The Turc equation, developed for use with measured temperature and solar radiation, was tested with estimated radiation and found to provide better estimates of FAO-56 ETo than the other methods. Mean bias errors of 0.75, 0.28, and −0.19 mm, mean absolute errors of 0.92, 0.68, and 0.62 mm, and percent errors of 22.5%, 8.5%, and −5.7% were found for daily estimates for the FAO-56 Reduced Set, Hargreaves, and Turc methods, respectively.
1. INTRODUCTION
In many places throughout the world, increasing demands are being placed on limited water supplies. Increases in water-use efficiency are being sought in irrigated agriculture, a large user of water resources. Irrigation scheduling has long been advocated as an improved water-management technique which agricultural producers can apply to better use water resources and improve crop yields.
A common method of scheduling irrigations involves maintaining a daily account of soil-water resources via a water balance model. The water balance model estimates the amount of water available in the soil for crop use, and accounts for water removed from the soil through evapotranspiration and for water added to the soil through rainfall and irrigation. When remaining soil-water reserves, or total soil-water depletion, reach a critical level, an irrigation is required to replace depleted soilwater resources.
Evapotranspiration (ET) is an important component in water-balance models and irrigation scheduling, and is often estimated in a two-step process. The evaporative demand of the environment is estimated based on weather conditions, and is often estimated as the evapotranspiration from a theoretical, reference grass crop (ETo) with the crop defined as an actively growing, uniform surface of grass, completely shading the ground, and not short of water [1]. The ETo value is then adjusted to estimate the evapotranspiration of the particular crop of interest using a crop-specific crop coefficient [2].
Many methods have been proposed for estimating ETo based on weather data, and range from locally developed, empirical relationships to physically based energyand mass-transfer models. To allow for greater understanding, sharing, and intercomparison of evapotranspiration information worldwide, under varying climatic and agronomic conditions, a standardized method of estimating ETo was developed [2], referred to as the FAO-56 Penman-Monteith method. While the FAO-56 method has become the de facto standard worldwide for estimating ETo, it is a complex method requiring several weather parameters, including air temperature, humidity, solar radiation, and wind speed, to be measured under strict instrumentation, siting, and maintenance conditions. Oftentimes, limitations (including financial, personnel, instrumentation, and maintenance) make the weather data required for using the FAO-56 method unavailable, and alternative reference ET methods must be used.
While there is no consensus on the most appropriate method to use when required data are not available [3], two methods are recommended [2]. One method involves using a reduced set of weather data, estimating missing weather parameters, and inputting these to the standard FAO-56 method. Air temperature is commonly measured, and procedures are outlined for estimating missing humidity, solar radiation, and wind speed data. A second recommendation is to use the Hargreaves equation [4], an empirical model based on air temperature and extraterrestrial radiation. This method requires only air temperature as input, estimating the radiation term from air temperature data.
Researchers from many parts of the world have compared available reference ET equations to the FAO-56 method to determine suitable alternatives for use in their regions, including the FAO-56 reduced-set method [5-7]. A number of these efforts have been aimed at identifying methods suitable for use in humid regions [8-12]. One method which has consistently performed well under humid conditions is that of Turc [13]. The Turc method is an empirical equation which uses only air temperature and solar radiation as inputs, and is simple to implement. While the Turc method was originally developed with solar radiation as an input, the radiation term could be estimated in a manner similar to that used in the Hargreaves method, making it possible to use this method based only on air temperature.
The objective of this study was to evaluate alternative methods of estimating reference ET (ETo) under humid conditions when weather data are limited to only air temperature. Three alternative methods were tested: 1) the FAO-56 method with a reduced set of weather data as input, 2) the Hargreaves equation, and 3) the Turc equation with estimated solar radiation. ETo estimates from these alternative methods and limited weather data were evaluated by comparing the estimates to those made using the FAO-56 method and a complete set of weather data.
2. MATERIALS AND METHODS
2.1. ETo Estimation Methods
2.1.1. FAO-56 Method
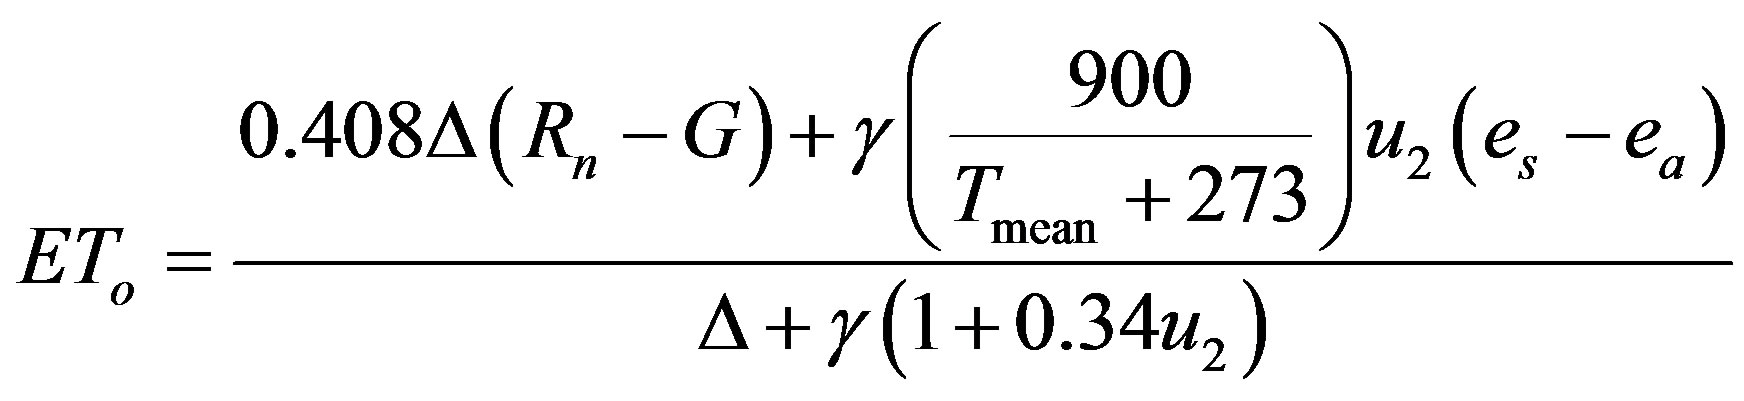
The FAO-56 Penman-Monteith method [2] for estimating reference evapotranspiration on a daily time scale is written as
 (1)
(1)
where ETo = reference evapotranspiration (mm·day−1), Rn = net radiation (MJ·m−2), G = soil heat flux (MJ·m−2), Tmean = average air temperature (˚C), u2 = wind speed at 2-m height (m·s−1), es = saturation vapor pressure (kPa), ea = actual vapor pressure (kPa), Δ = slope of vapor pressure curve (kPa·˚C−1), and γ = psychrometric constant (kPa·˚C−1). Supporting equations, tables, and descriptive information for determining each of the terms in the equation are extensive, and are detailed in [2]. To simplify the implementation of the FAO-56 method, computer software, such as RefET: Reference Evapotranspiration Calculator [14], are available. RefET, which was used in this study, performs all calculations based on weather data input by the user.
2.1.2. Reduced-Set Method
When the complete set of weather data required for the FAO-56 method are not available, procedures are described for using a reduced set of weather data as input [2]. While air temperature measurements are almost always available, reliable measurements of solar radiation, relative humidity, and windspeed may not be. Extensive discussion and methods for estimating missing values are presented based on temperature measurements and historical and general knowledge of local environmental conditions. The reduced set of values, consisting of measured data and estimated values, is then input to the FAO-56 equation, Eq.1. In this study, this method (hereafter referred to as the FAO-56 RS method) was used to estimate ETo assuming the availability of maximum and minimum air temperatures only.
2.1.3. Hargreaves Method
The Hargreaves method [4] estimates ETo based on maximum and minimum air temperature, and is written as
 (2)
(2)
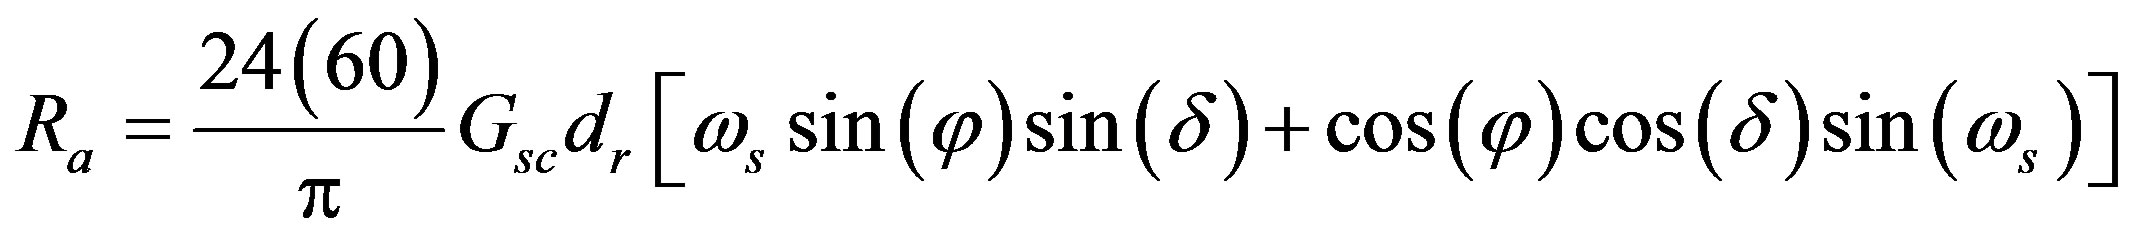
where Tmax = maximum air temperature (˚C), Tmin = minimum air temperature (˚C), Ra = extraterrestrial radiation (MJ·m−2), and 0.408 is a factor to convert MJ m−2 to mm. Extraterrestrial radiation, Ra, is estimated based on the location’s latitude and the calendar day of the year by
 (3)
(3)
where Gsc = solar constant (0.0820 MJ·m−2·min−1), φ = latitude (radians), converted from degrees latitude to radians (radians = degrees(π/180)), and the term 24(60) is a factor to convert min to day.
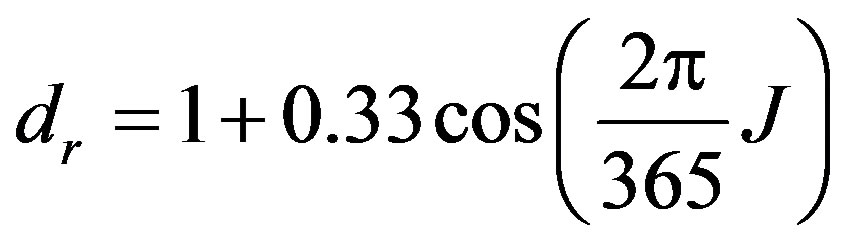
Based on the calendar day of the year, remaining factors are determined:
 (4)
(4)
where dr = inverse relative distance from earth to sun, and J = calendar day of the year,
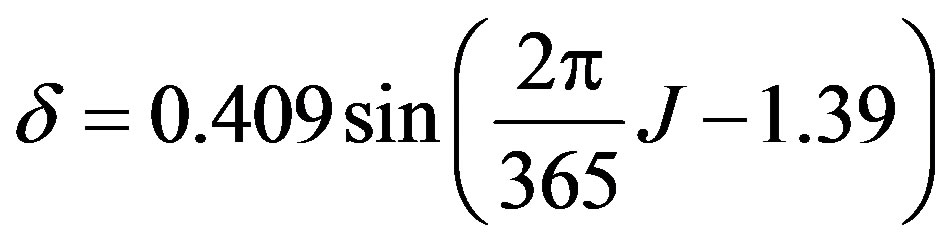 (5)
(5)
where δ = solar declination (radians), and
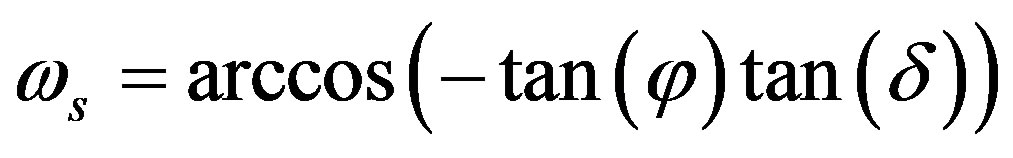 (6)
(6)
where ωs =sunset hour angle (radians).
2.1.4. Turc Method
The Turc method [13] estimates monthly ETo based on measurements of maximum and minimum air temperature and solar radiation using the equation
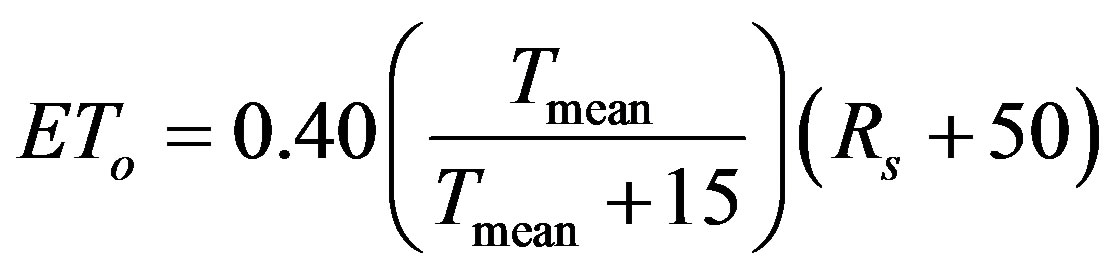 (7)
(7)
where ETo = reference evapotranspiration (mm·mon−1), Rs = solar radiation (MJ·m−2), and Tmean = average air temperature (˚C) calculated as (Tmax + Tmin)/2. To estimate ETo on a daily basis, the factor 0.40 is divided by 30 (average days per month), and Eq.7 becomes
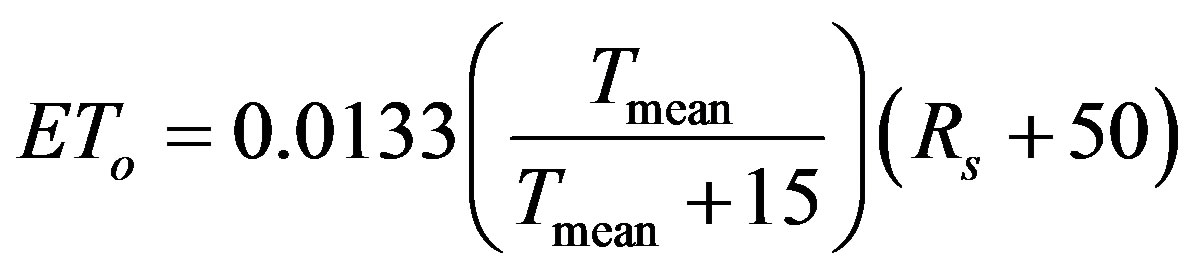 (8)
(8)
where ETo = reference evapotranspiration (mm·day−1).
To estimate ETo using the Turc equation with only air temperature as input, measurements of solar radiation, Rs, in Eq.8 are replaced with estimates made using the method developed by Hargreaves and Samani [15] and used in the Hargreaves equation (Eq.2):
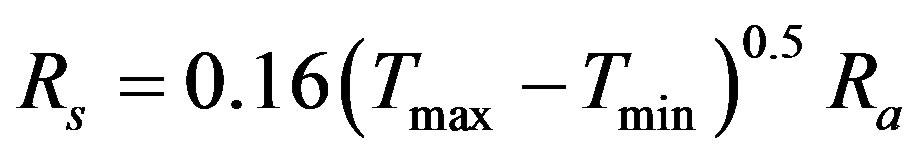 . (9)
. (9)
2.2. Weather Data
Weather data were obtained for six locations in Mississippi; Lyon, Macon, Onward, Sidon, Stoneville, and Verona, shown in Figure 1. Automated weather stations at each location, operated by Mississippi State University (www.msucares.com), provided daily measurements of maximum and minimum air temperature, solar radiation, relative humidity, wind speed, and precipitation. Data from each location were screened to remove observations with missing or erroneous readings, and the data sets
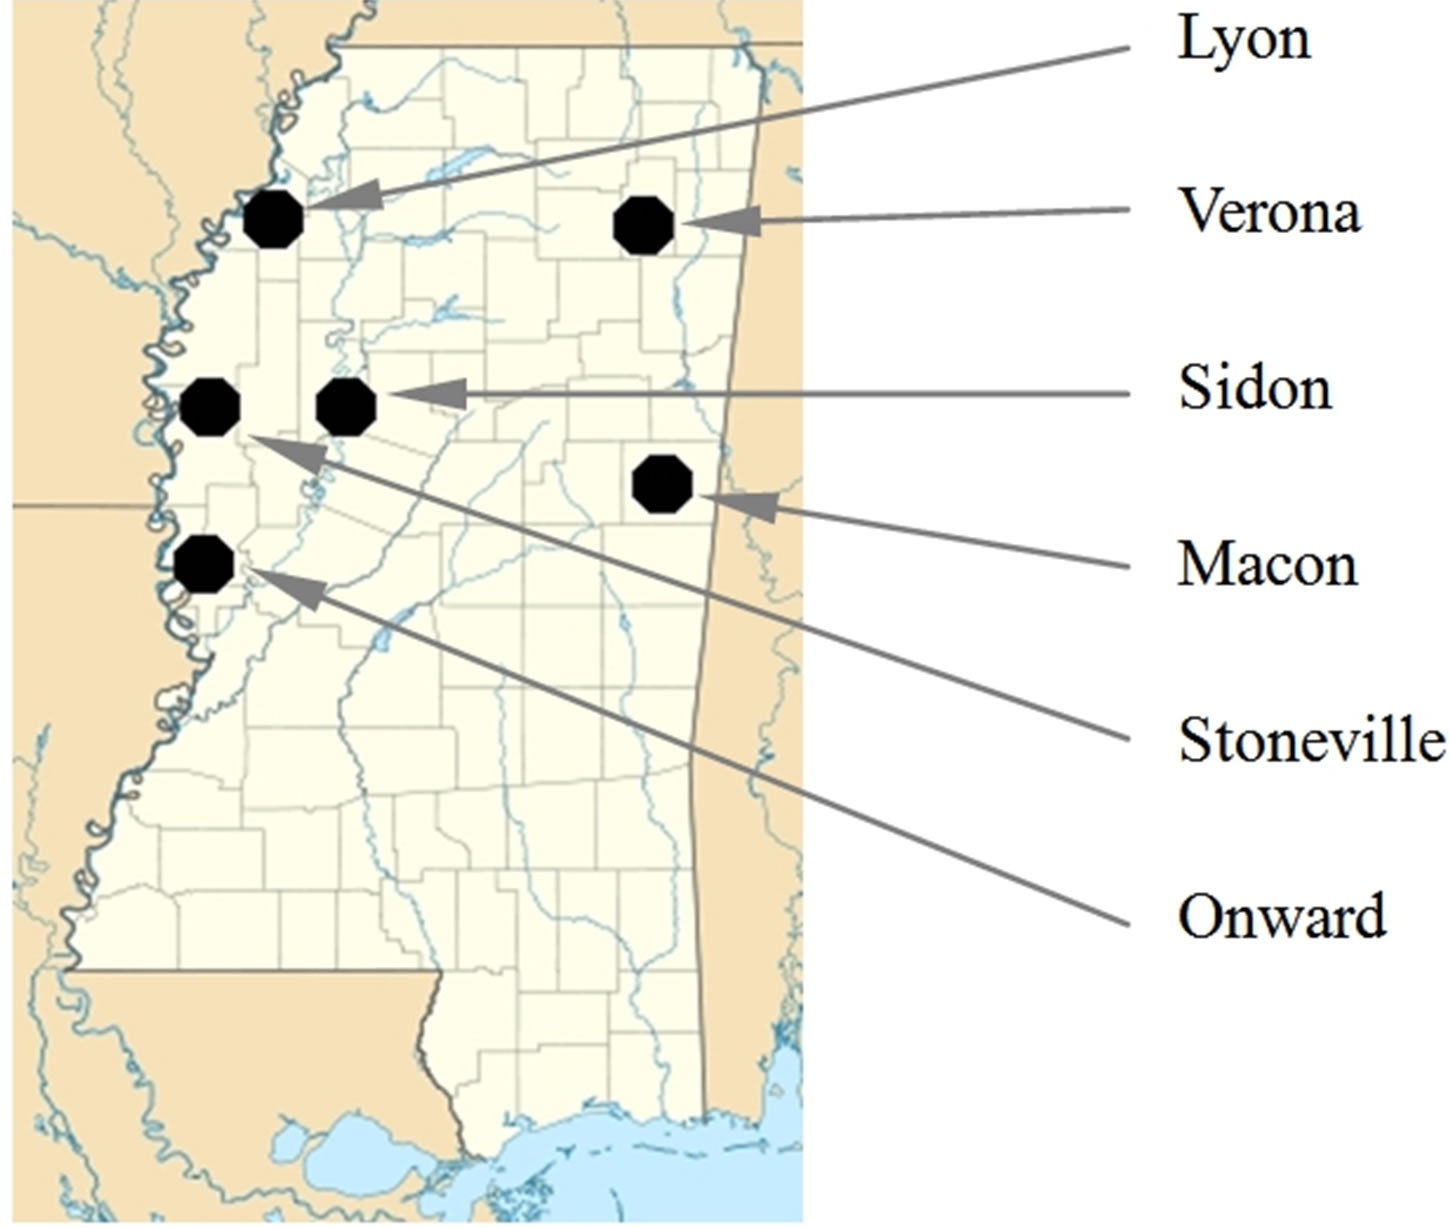
Figure 1. Locations of weather stations.
were reduced to include only those daily observations which included all parameters necessary (maximum and minimum air temperature, maximum and minimum relative humidity, total solar radiation, and total windrun) for estimating daily evapotranspiration with each of the reference ET methods. Geographic information and time periods of weather data for each location are shown in Table 1.
2.3. Evaluation Criteria
To perform the evaluation of the alternate ETo methods, the three methods were programmed into a spreadsheet and weather data from the six locations were input to the spreadsheet. The weather data were also input to the RefET software to generate ETo estimates for the FAO-56 method, which were then entered into the spreadsheet. The spreadsheet was then used to graphically and statistically analyze the data.
Error in ETo estimates from the alternative methods compared with those from the FAO-56 method was quantified using three statistical parameters; Mean Bias Error (MBE), Mean Absolute Error (MAE), and Percent Error (PE). MBE is defined as
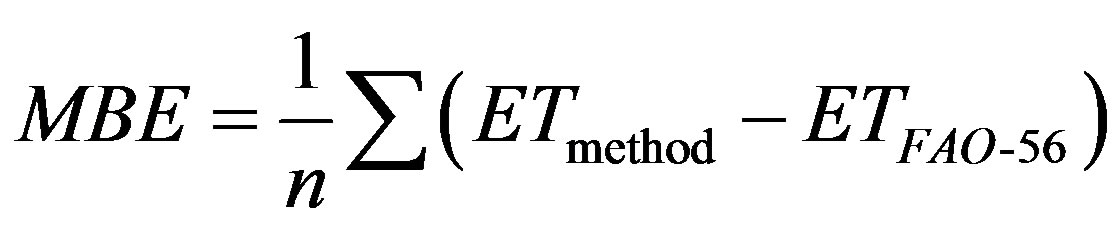 (10)
(10)
where MBE = mean bias error (mm), ETmethod = daily ETo estimate from alternate ETo method (mm), ETFAO-56 = daily ETo from FAO-56 method (mm), and n = number of samples. MBE provides an overall average of the error, accounting for underand over-estimates of ETo by including the sign of the error (negative indicating that ETmethod < ETFAO-56, and positive indicating that ETmethod > ETFAO-56).
As a measure of the average magnitude of the error, MAE is recommended [16]. MAE removes the sign by taking the absolute value of the error, and is defined as
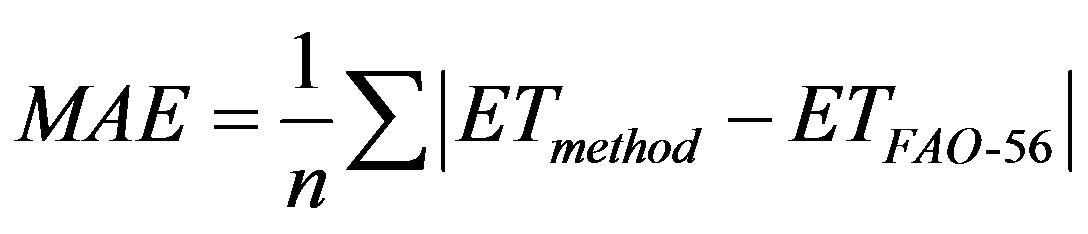 (11)
(11)
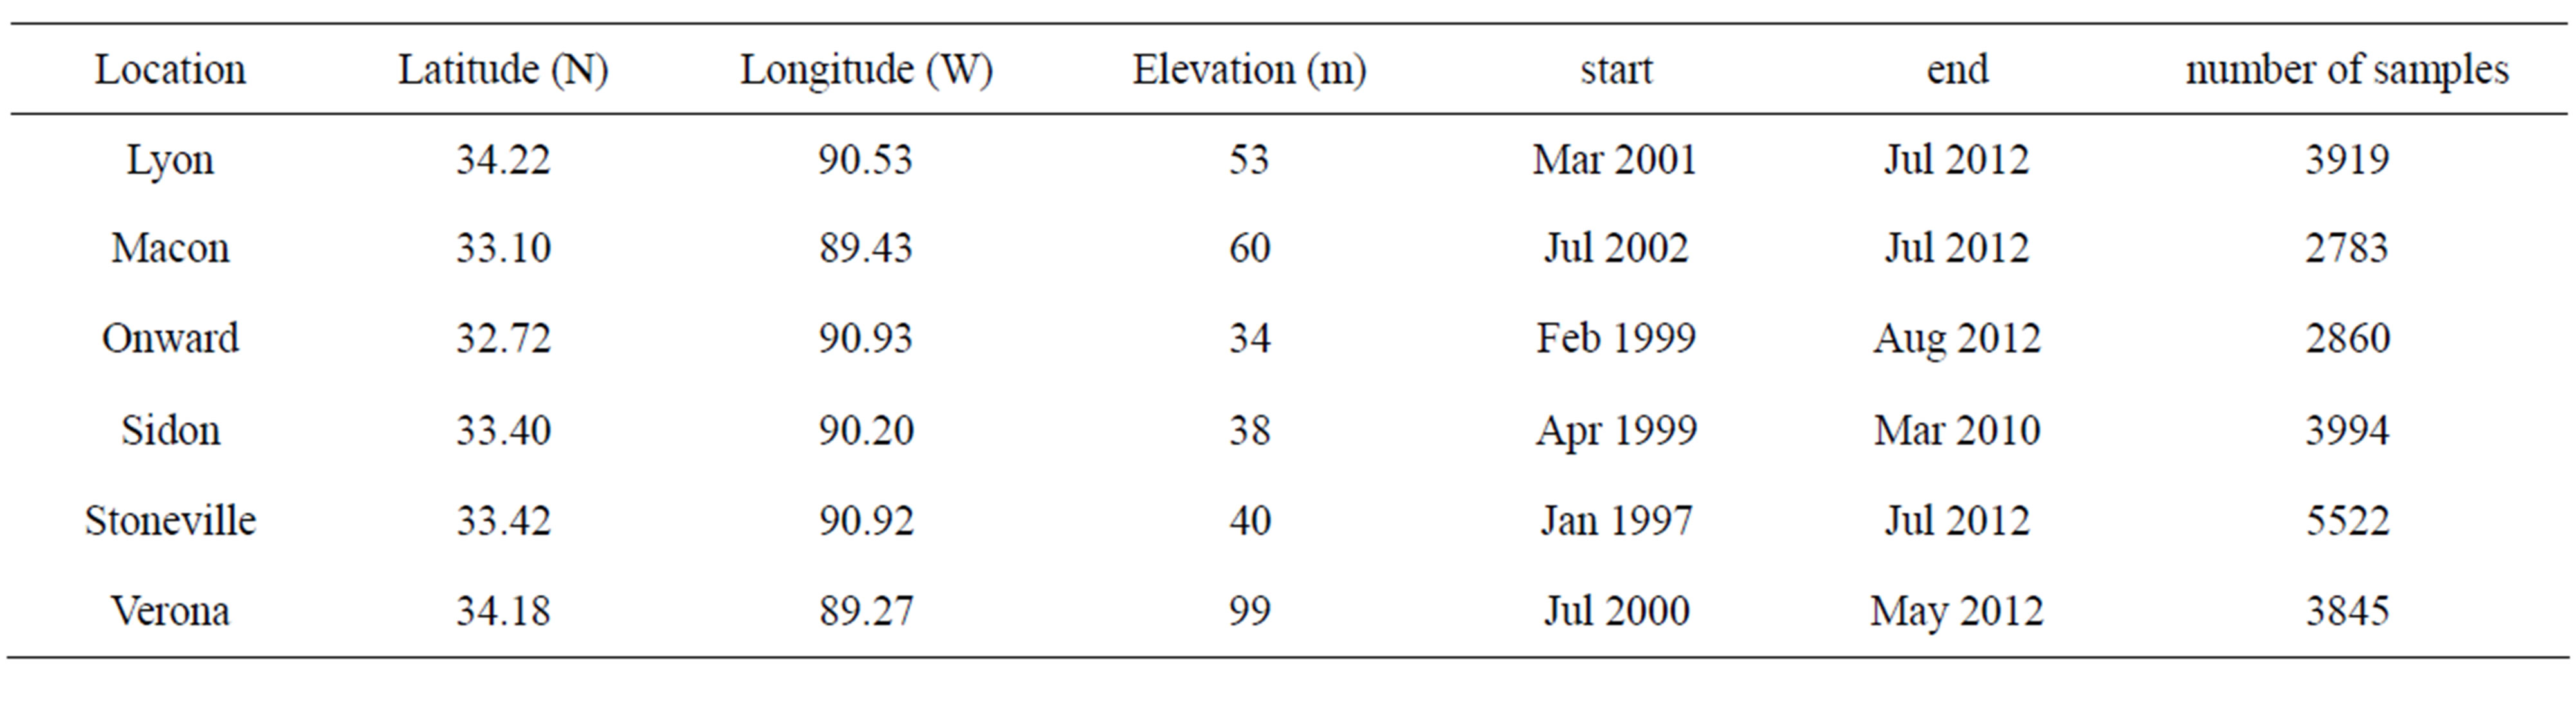
Table 1. Location and weather data information.
where MAE = mean absolute error (mm).
Percent Error (PE) quantifies the magnitude of the error in the ETmethod values in terms of the expected ETFAO-56 values and expresses the error, in percent, as
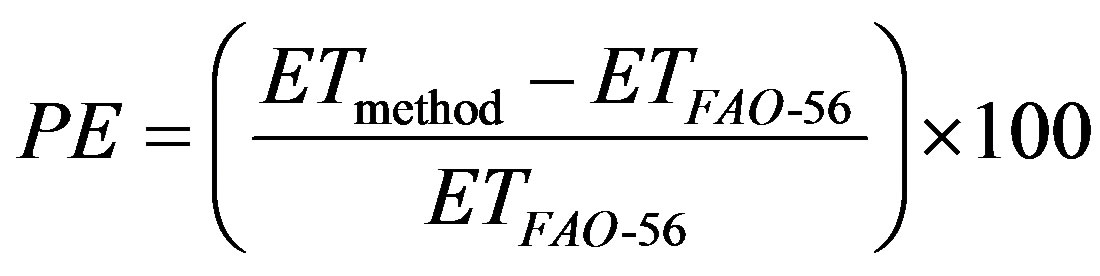 . (12)
The performance of each alternative method, and the resulting errors, were evaluated over the entire year, and for the growing season, during the months of April through September.
3. RESULTS AND DISCUSSION
Weather data downloaded from the Mississippi State University weather station network (www.msucares.com) for the six locations were input to the four ETo methods to obtain daily ETo estimates. Weather data estimates were then averaged for each month, and summarized for each year. The data were also summarized over the entire period to give an overall picture of the environmental conditions of the region, and are provided in Table 2.
Average monthly air temperatures ranged from a minimum of 10.9˚C to a maximum of 24.1˚C across the region, and high relative humidity values were consistent among locations. Average windrun ranged from 96 to 198 km·day−1, indicating low average daily wind speeds of 1.1 to 2.2 m·s−1. Average daily solar radiation totals ranged from 15.5 to 16.6 MJ·m−2, and average yearly precipitation totals ranged from 1122 to 1316 mm.
Each of the alternate ETo methods included a solar radiation term, Rs, which was estimated using the procedure outlined in [15]. For each location, daily extraterrestrial radiation, Ra, was first calculated based on the location’s latitude and the day of year using Eqs.3-6. Rs was then estimated based on air temperature measurements and Eq.9. When air temperatures were below 0˚C, Rs could not be calculated with Eq.9 due to the negative temperature values, and a value of Rs = 0 MJ·m−2 was assigned.
Daily ETo estimates for each of the ETo methods were summarized on monthly and yearly bases. Monthly averages of daily ETo for each estimation method are shown for each of the six locations in Figure 2. Average yearly total ETo estimates for each method are shown in Table 2.
The FAO-56 RS method consistently overestimated daily ETo compared with the full FAO-56 method for all months and locations. During periods of peak ETo in June and July, FAO-56 RS predicted average daily ETo values around 6.5 mm·day−1 compared to FAO-56 values of 5 mm·day−1.
The Hargreaves equation tended to underestimate ETo early in the year, from January through April, then again in the last few months of the year at most locations. From May through September, daily ETo estimates exceeded those from the FAO-56 method, with daily ETo estimates nearing 6 mm·day−1 compared to FAO-56 values around 5 mm·day−1.
The Turc equation produced average daily ETo estimates very near or slightly lower, in general, than those from the FAO-56 method. Estimates in the first half of the year were usually slightly lower, then very near or slightly higher in the remaining six months.
3.1. Error in Monthly Averages of Daily Rs and ETo Estimates
Allen et al. [2] recommended that estimates made using Eq.9 be averaged over longer time periods, from several days to a week to a month, to remove errors associated with daily estimates. Since the three alternate ETo methods each used values of solar radiation estimated using Eq.9, the methods were first evaluated based on daily ETo estimates averaged over monthly time periods. Daily Rs and ETo estimates were made for each day in the weather-data set at each location, then averaged for each month of each year of data.
Monthly averages of daily measured and estimated Rs for each location are shown in Figure 3, with error statistics listed in Table 3. In general, estimated values were slightly overpredicted for low measured Rs values and slightly underpredicted at higher Rs measurements. At all locations, Percent Error (PE) ranged from −2.6% to 4.0%,
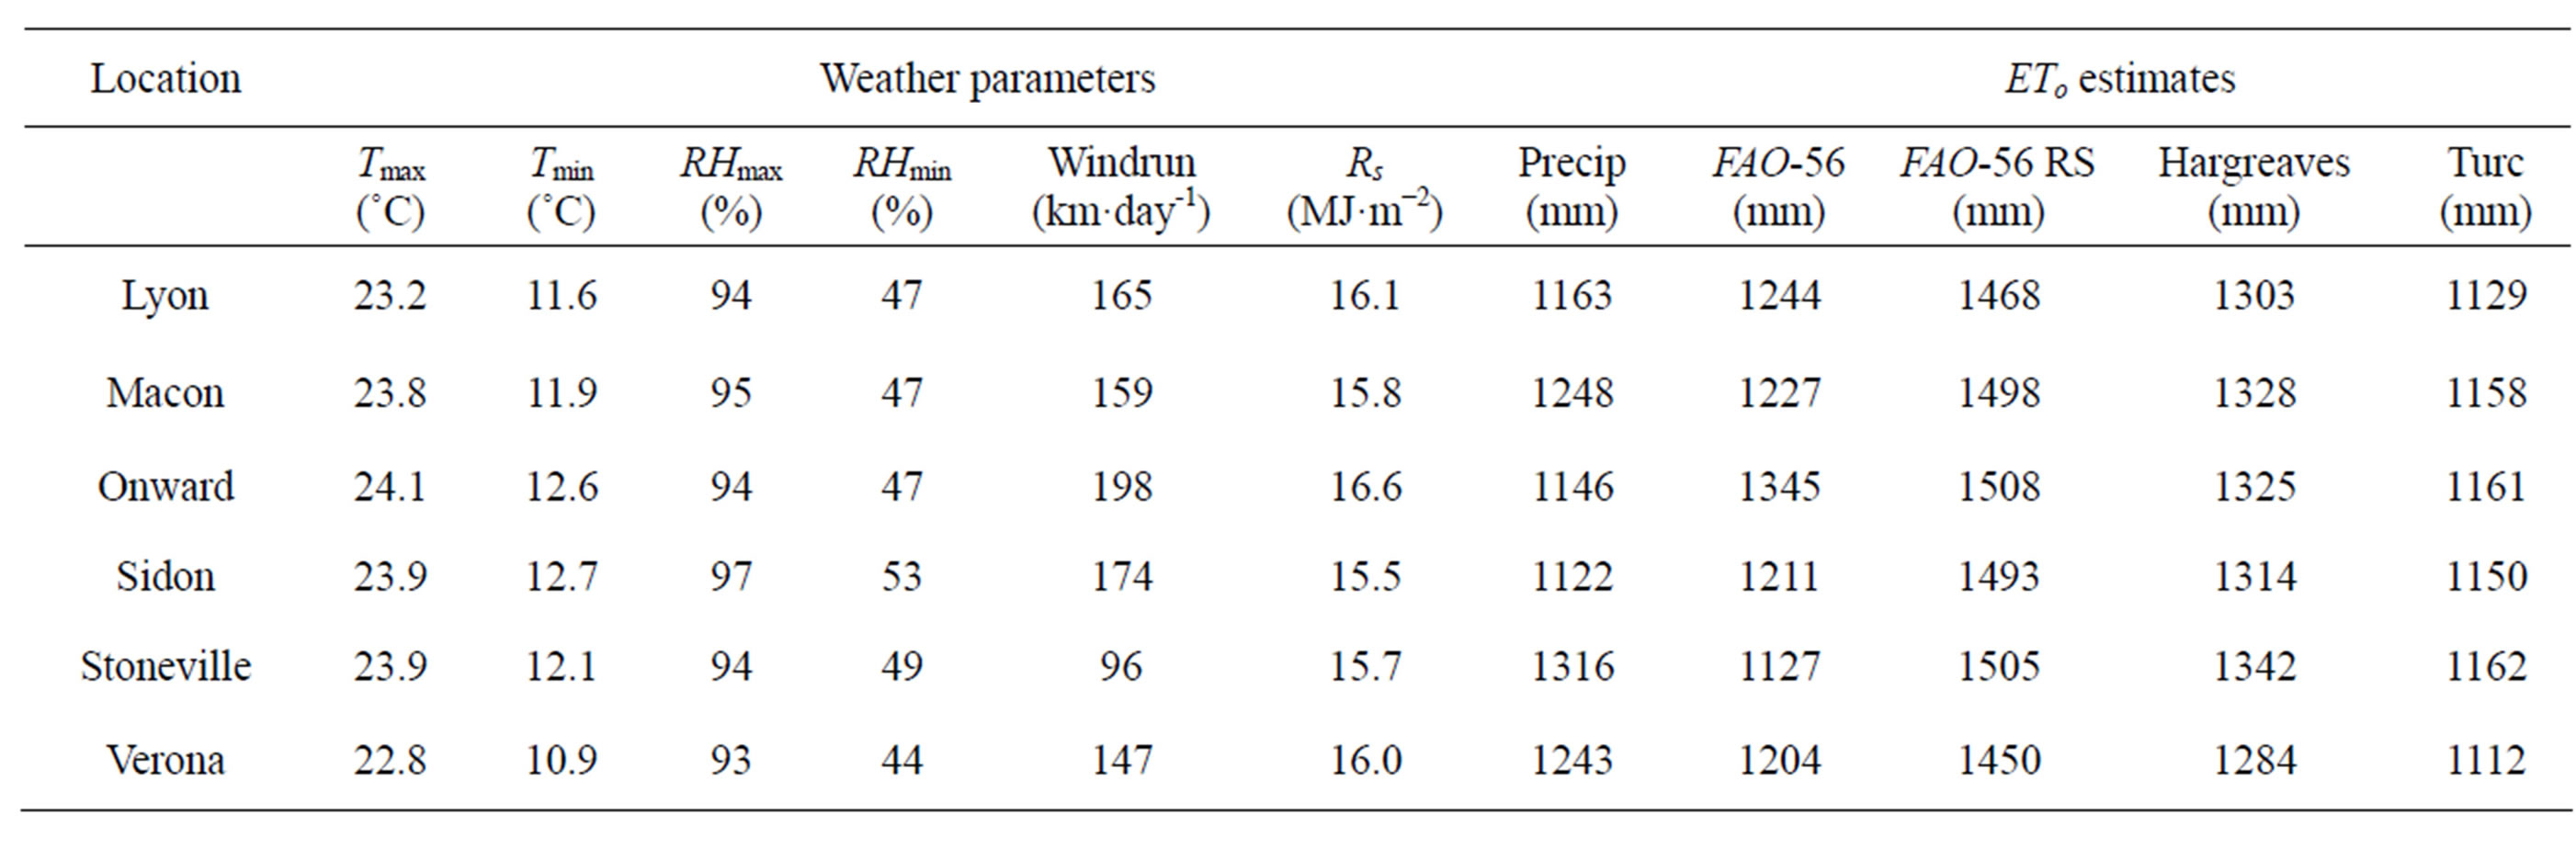
Table 2. Summary of average weather parameter data and ETo estimates for yearly time period.
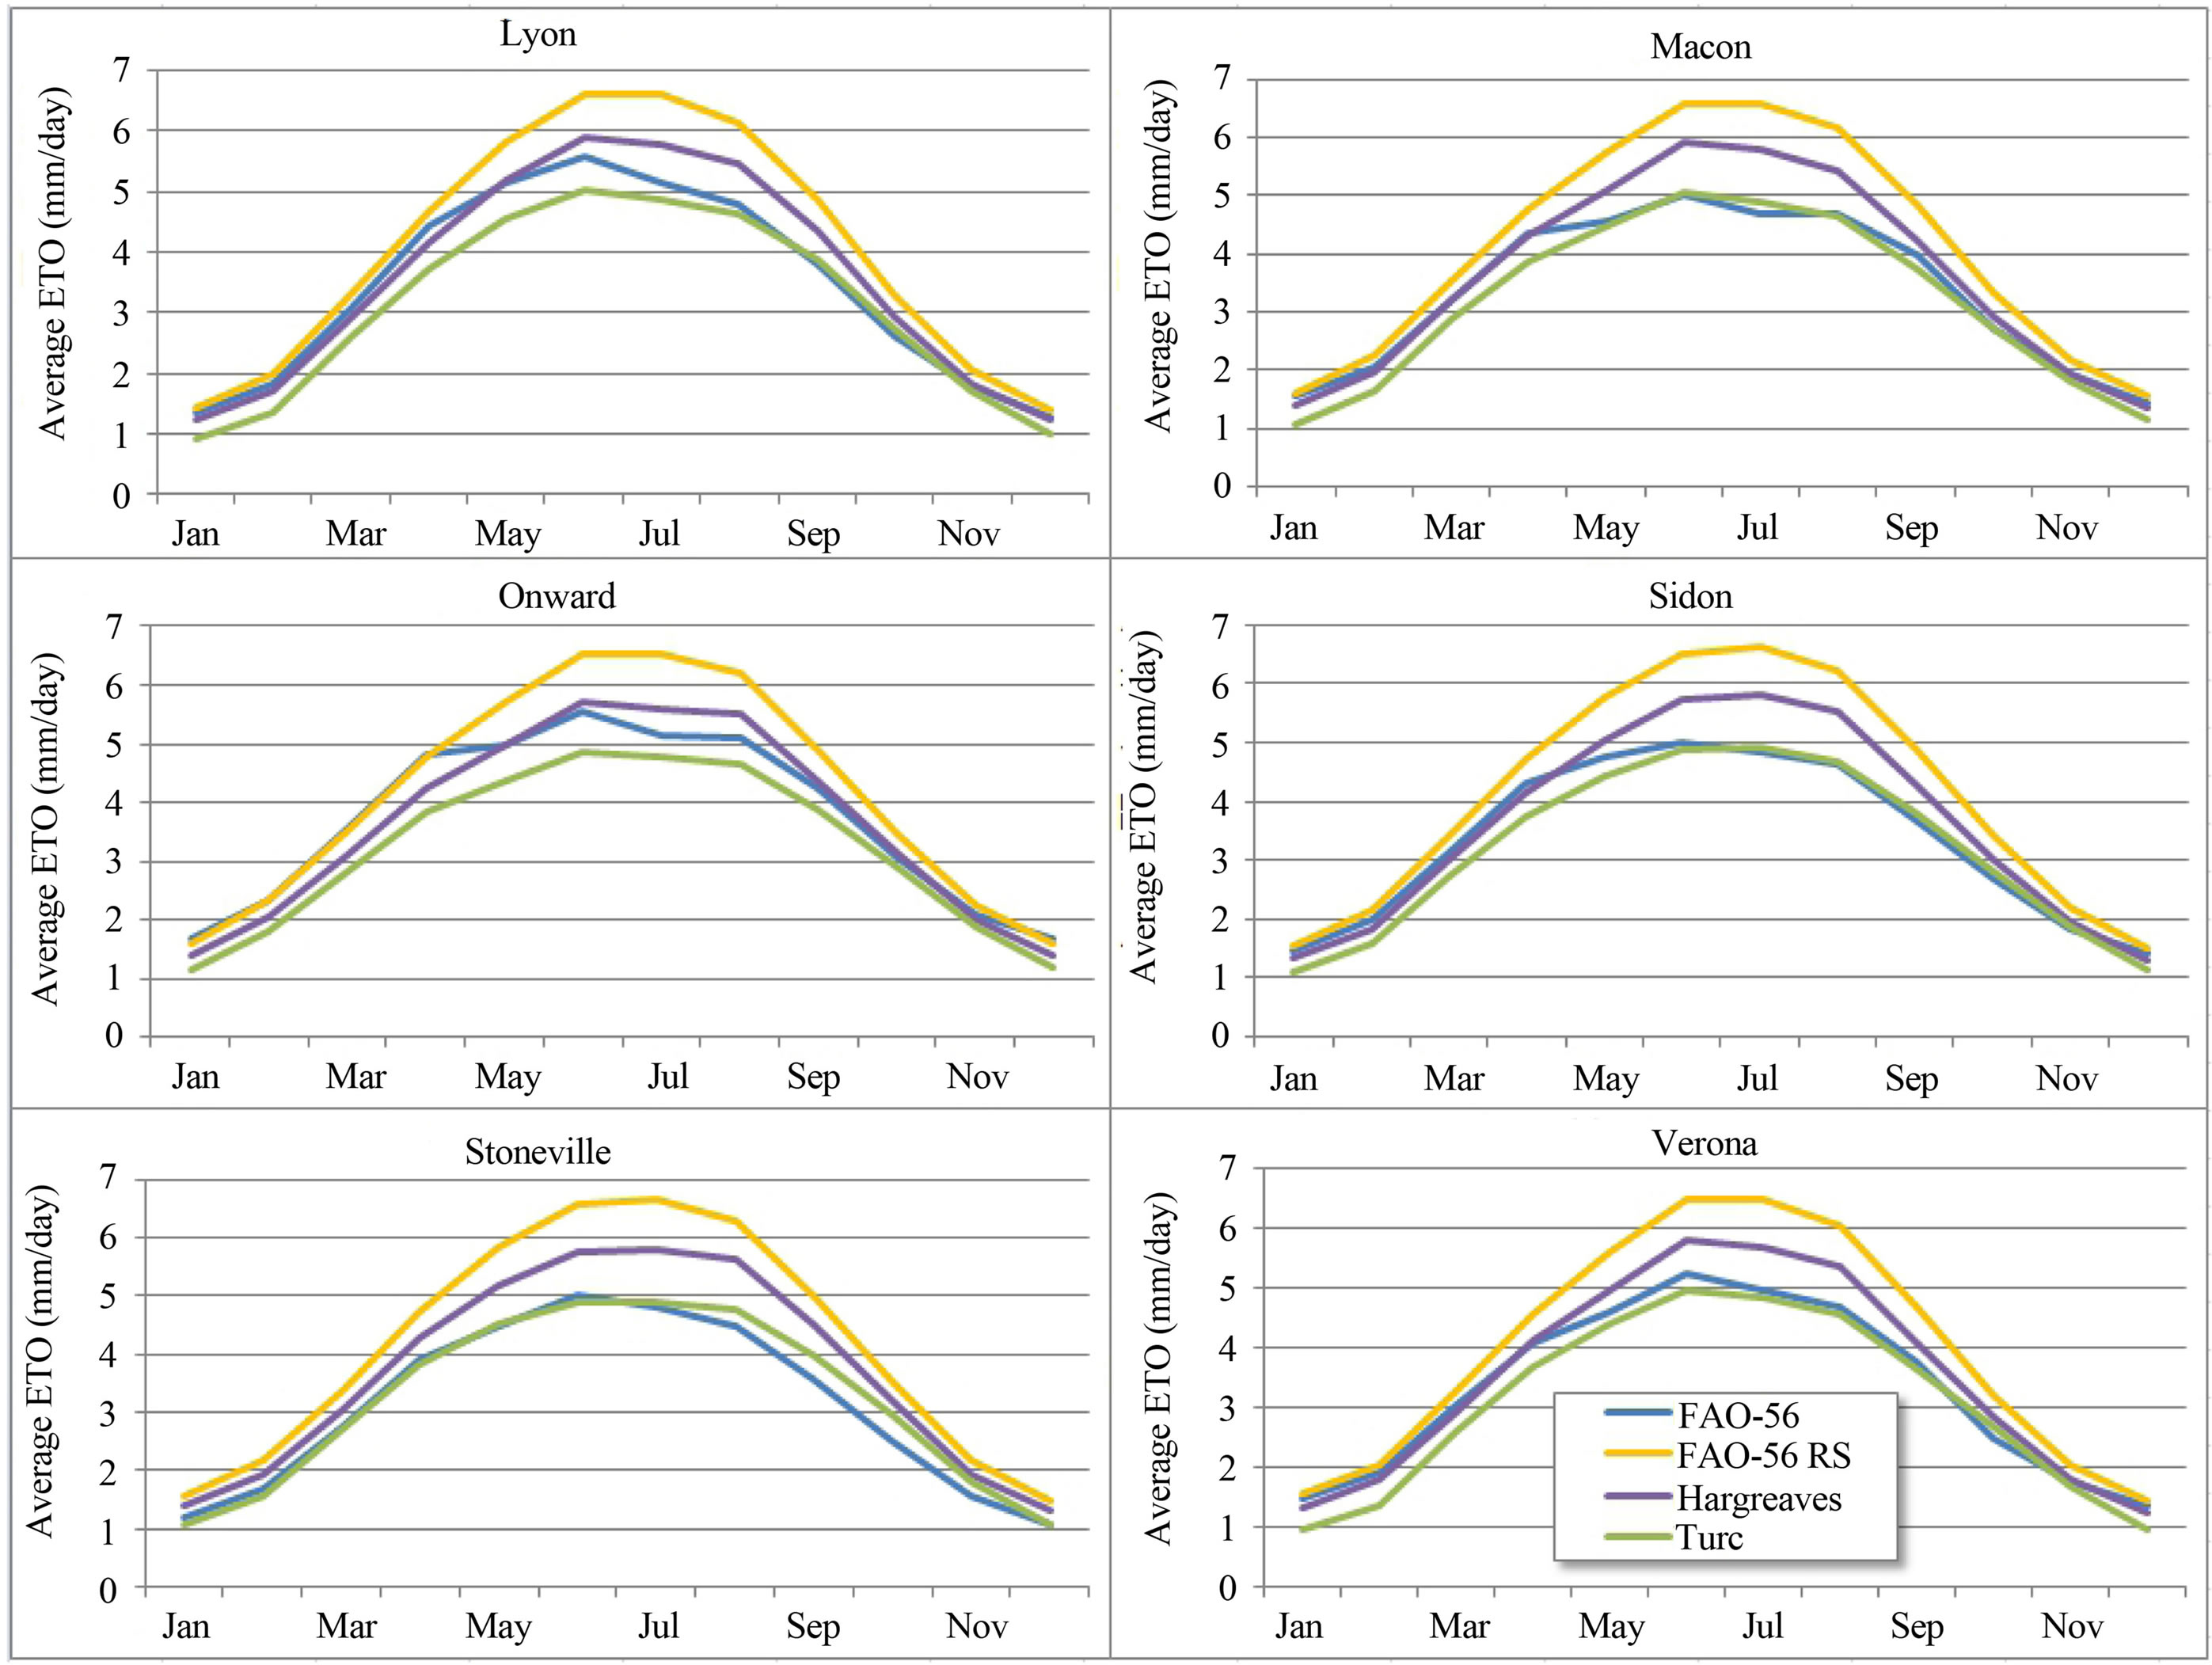
Figure 2. Average daily ETo for each month at each location.
with an overall average of 1.5%. Mean Bias Error (MBE) ranged from −0.44 to 0.64 MJ·m−2, with an MBE = 0.24 MJ·m−2 for the combined data set. Mean Absolute Error (MAE) ranged from 0.86 to 1.52 MJ·m−2, with an aver- -age value of 1.19 MJ·m−2 for the combined data.
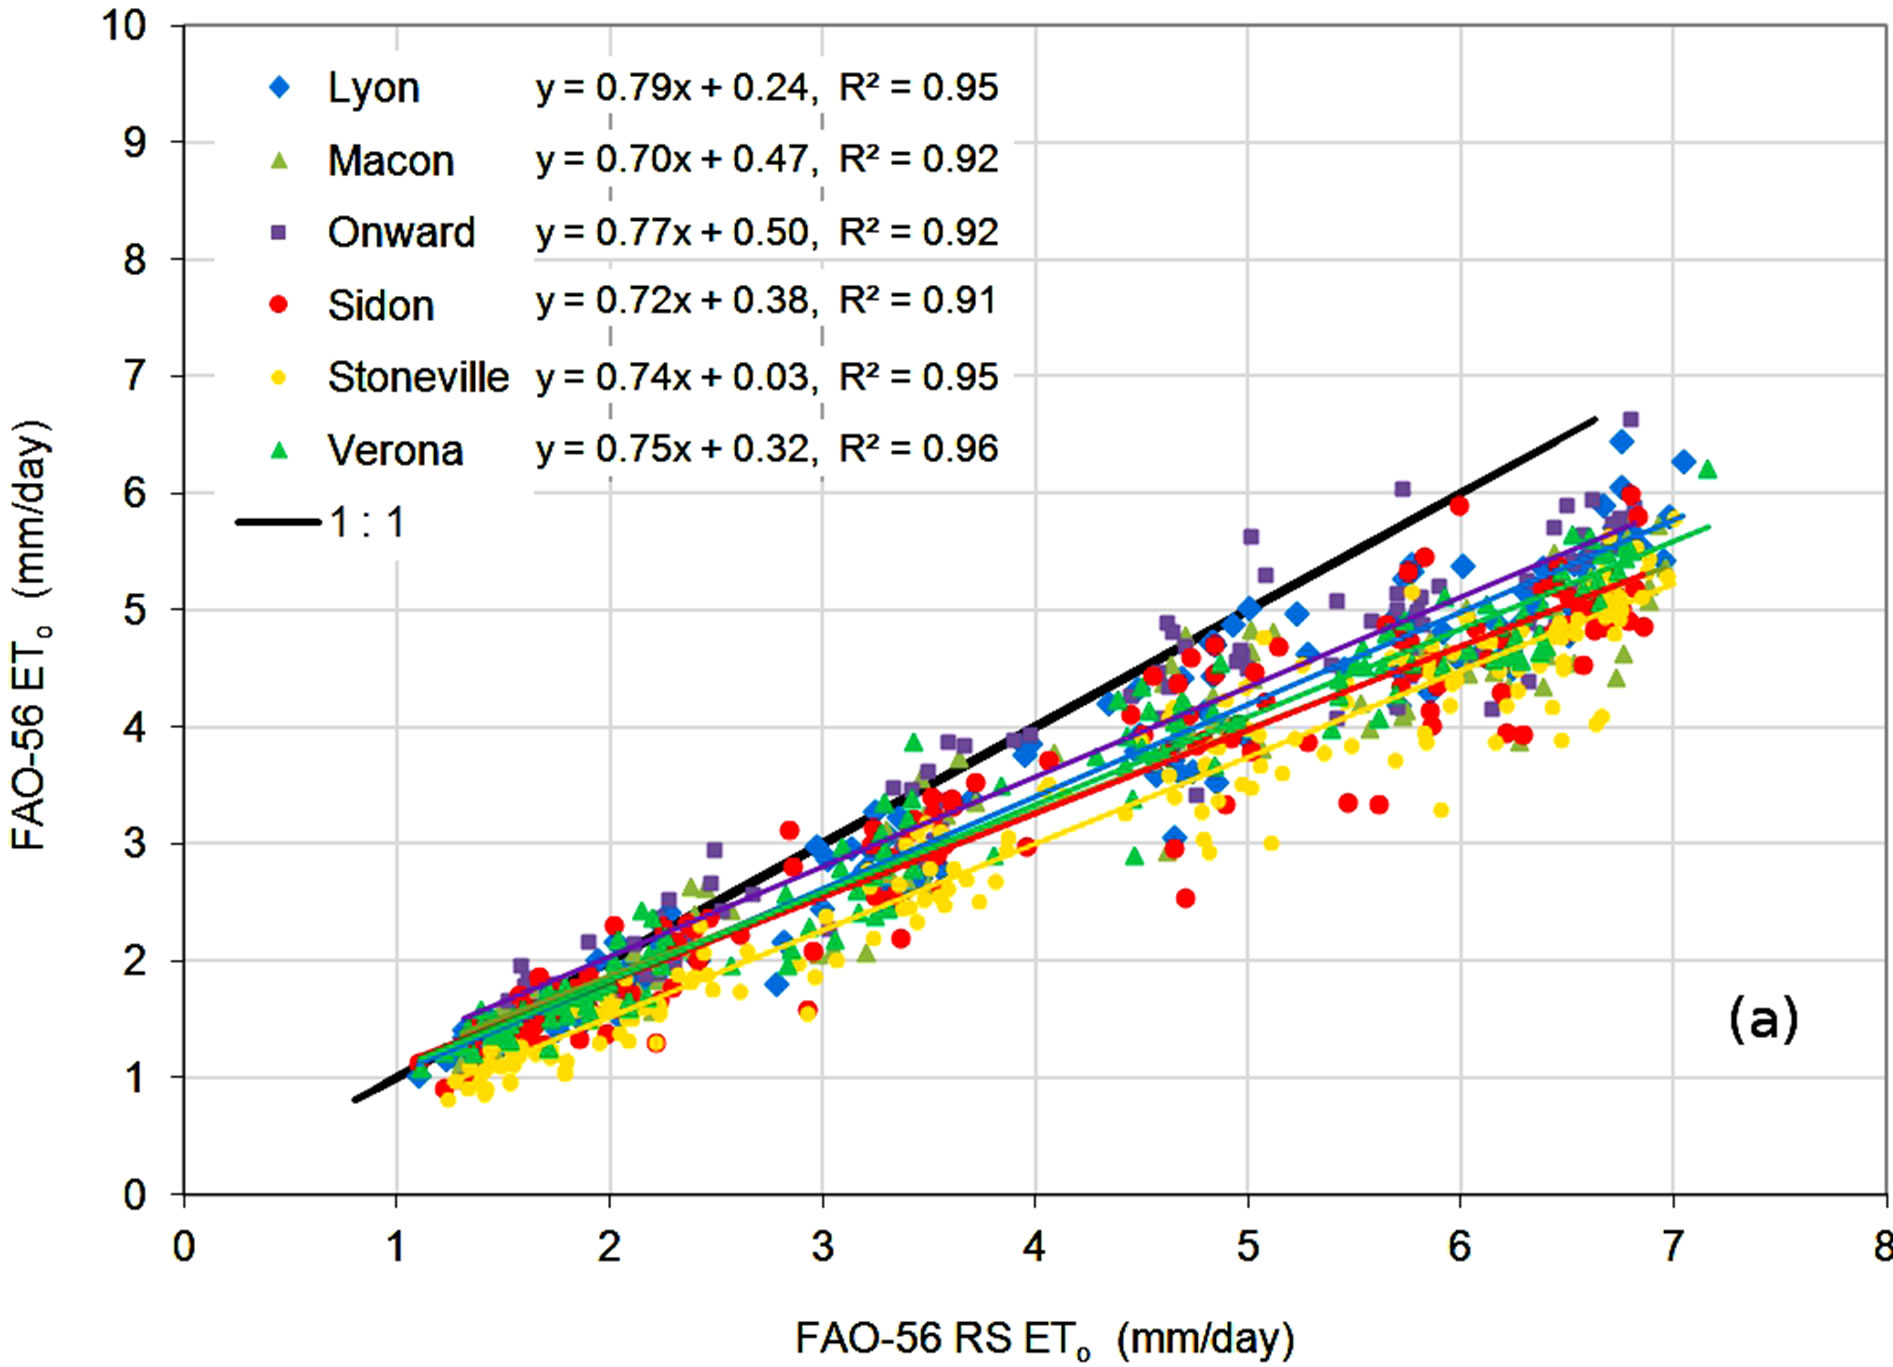
Monthly averages of daily average ETo for each alternate method were plotted against average FAO-56 estimates, shown in Figure 4, with error statistics calculated and shown in Table 4. Results for the FAO-56 RS method, shown in Figure 4(a), show consistent overestimation of ETo at all locations throughout the range of FAO- 56 estimates. Simple linear regression lines fit to the data for each location had high correlation coefficient, R2, values ranging from 0.91 to 0.96, indicating a strong
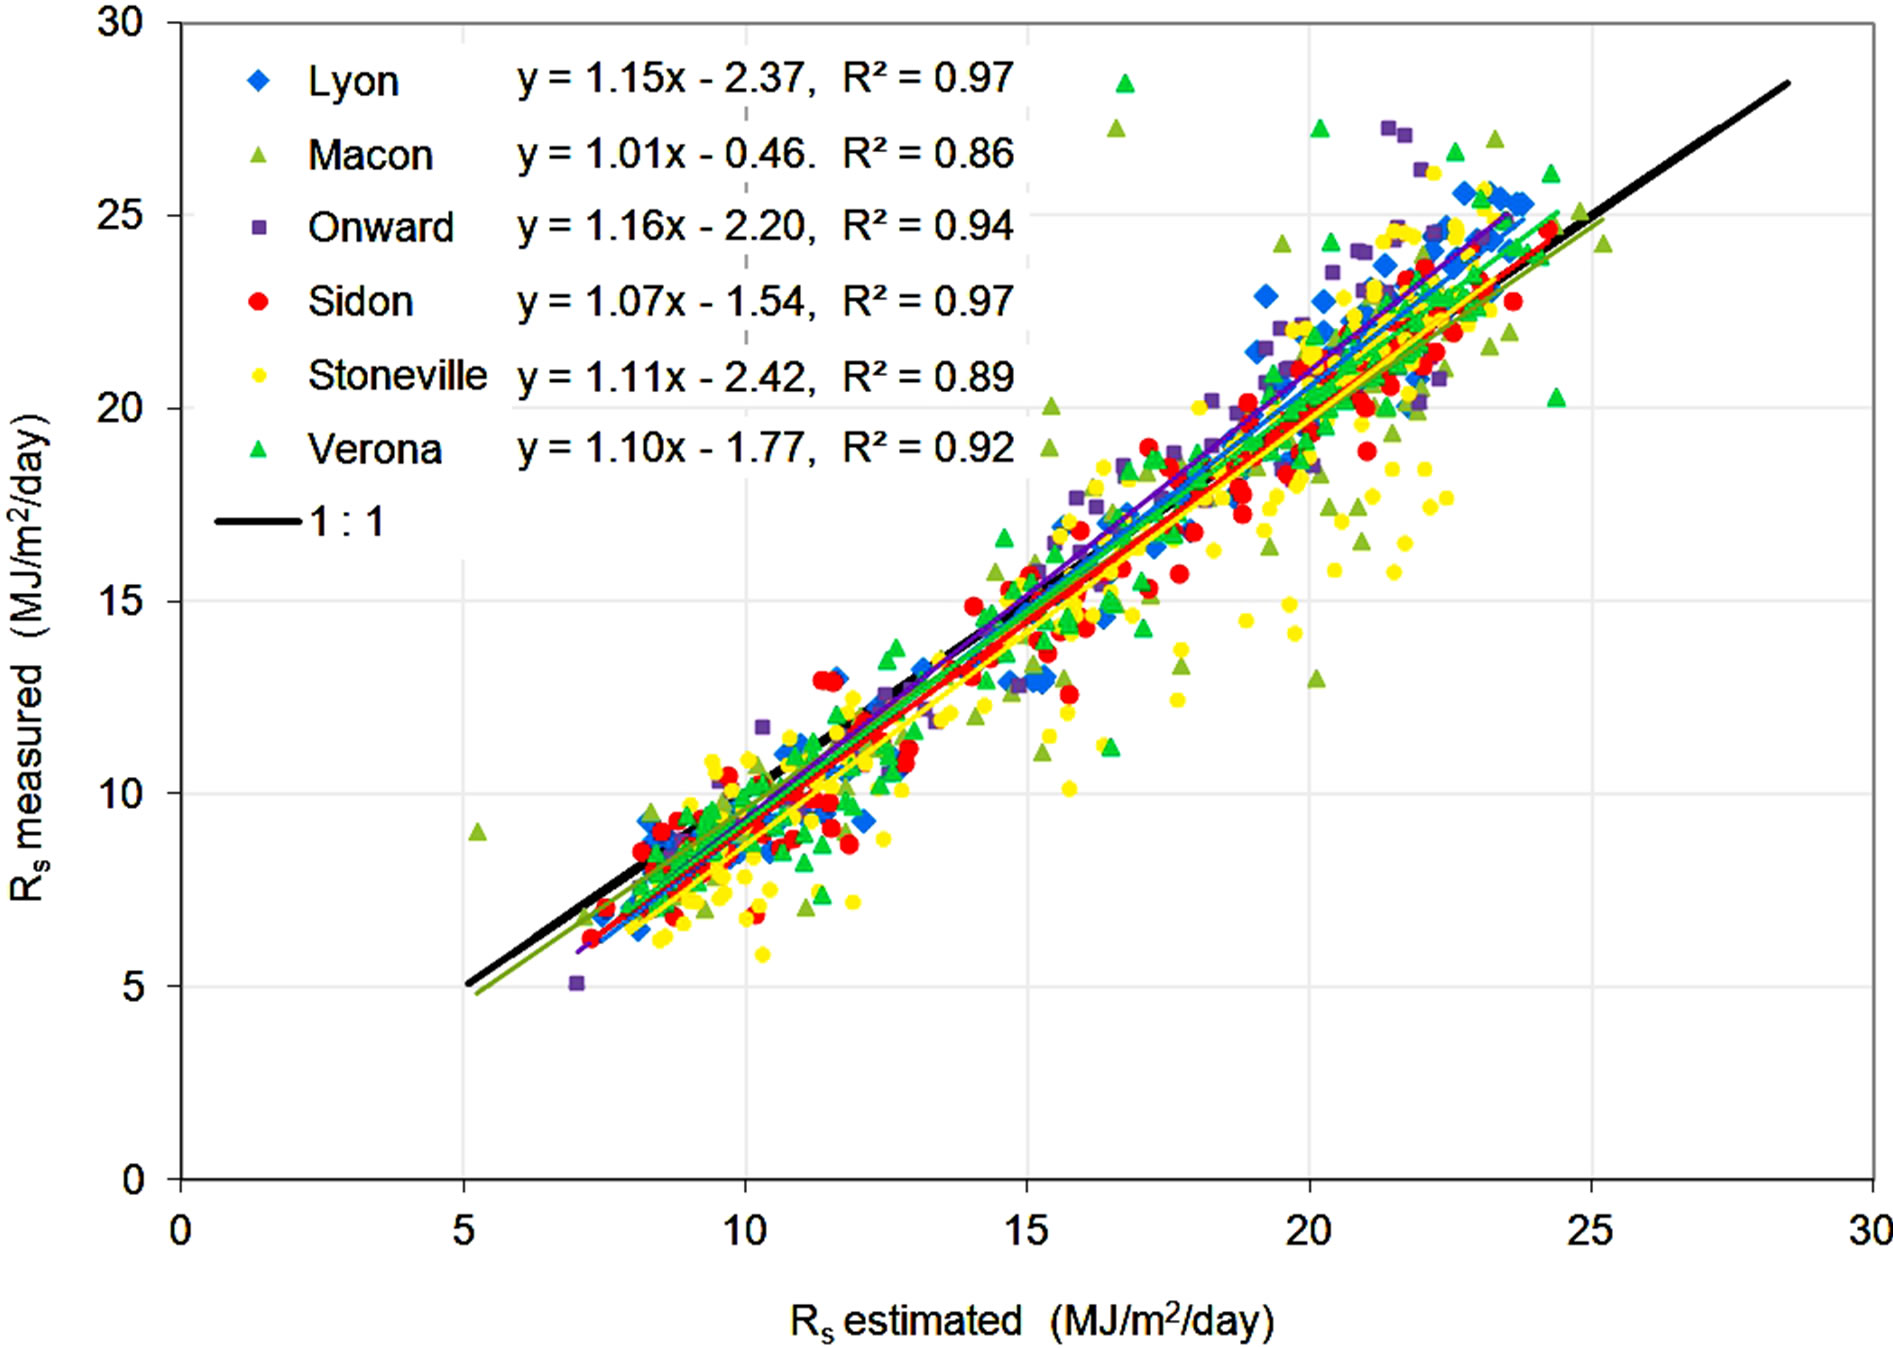
Figure 3. Comparison of monthly averages of measured and estimated solar radiation, Rs.
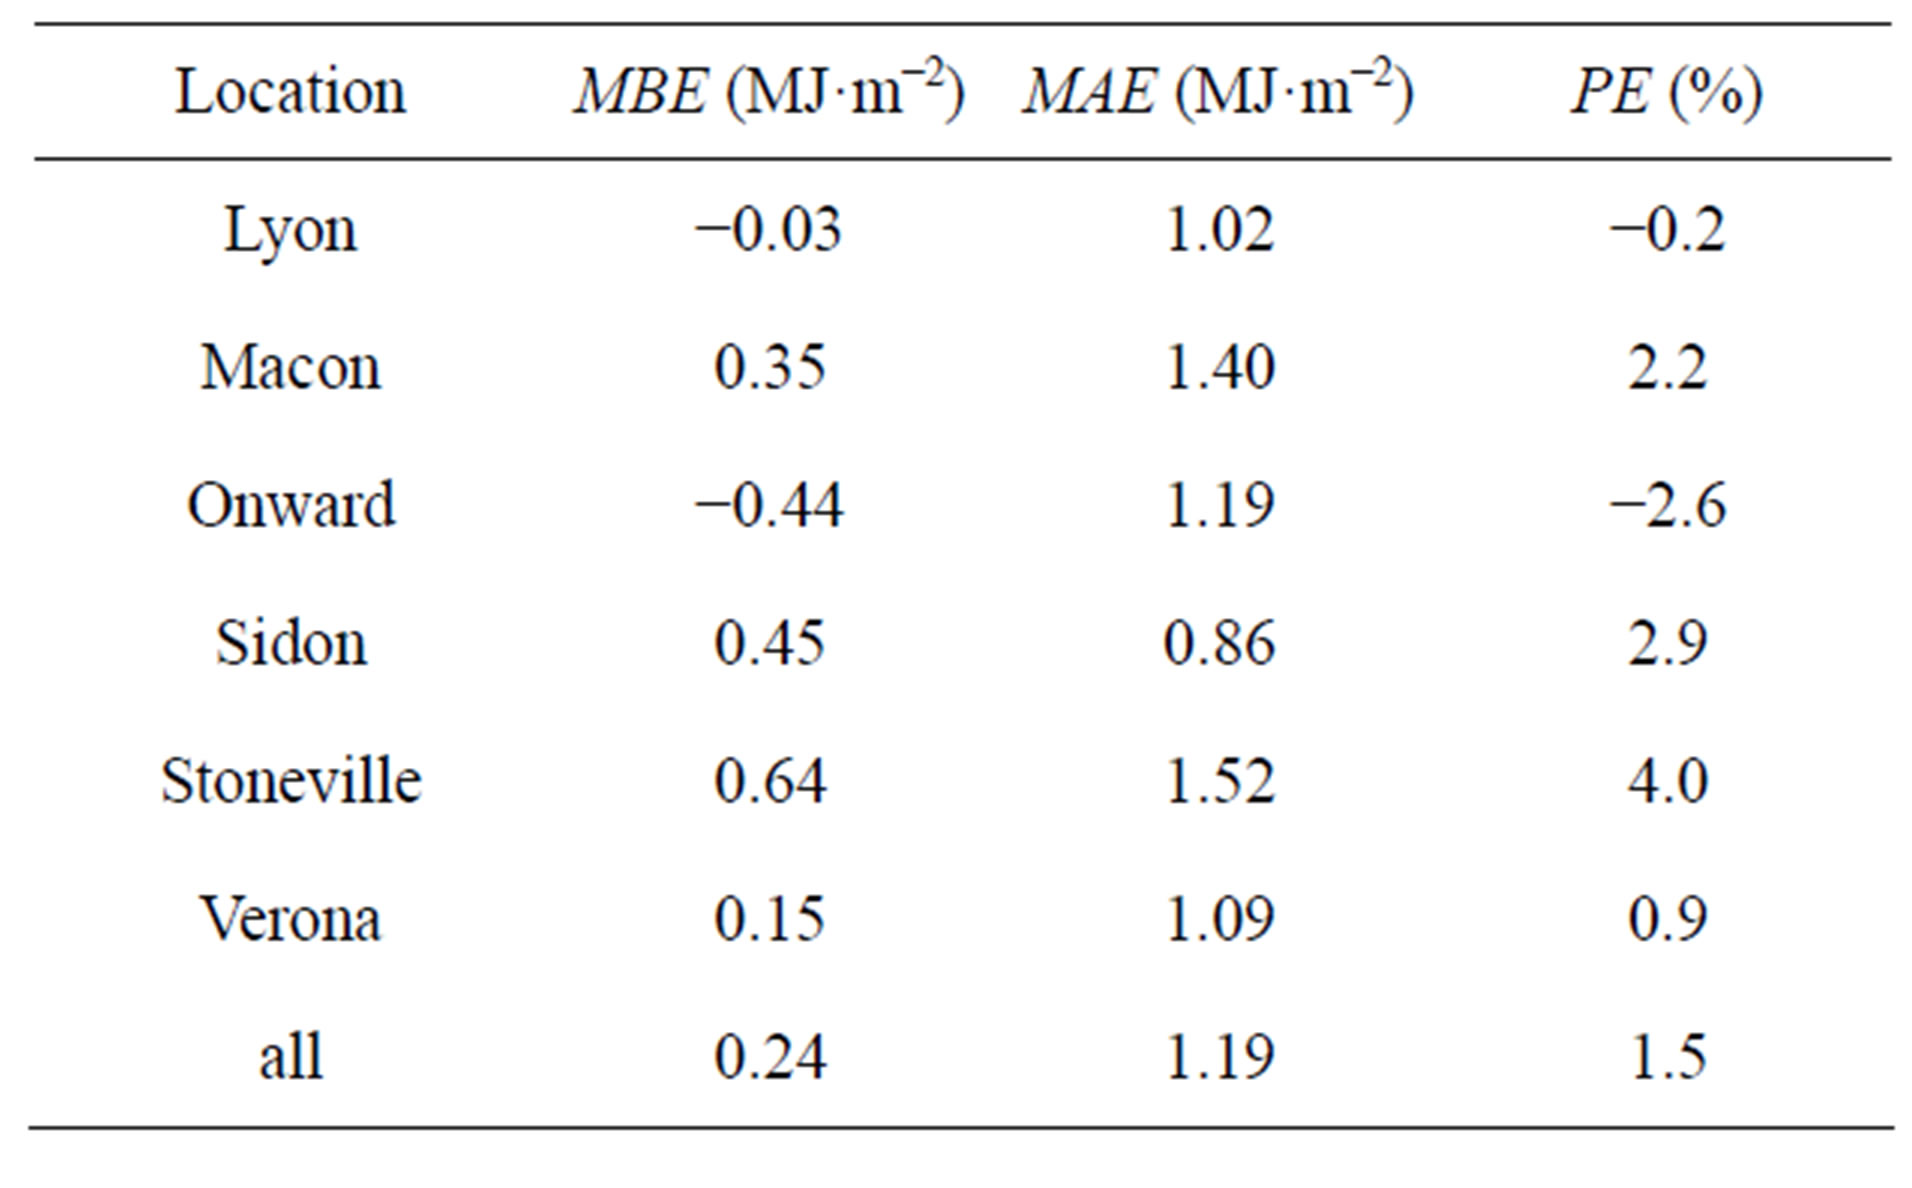
Table 3. Error in average monthly solar radiation estimates.
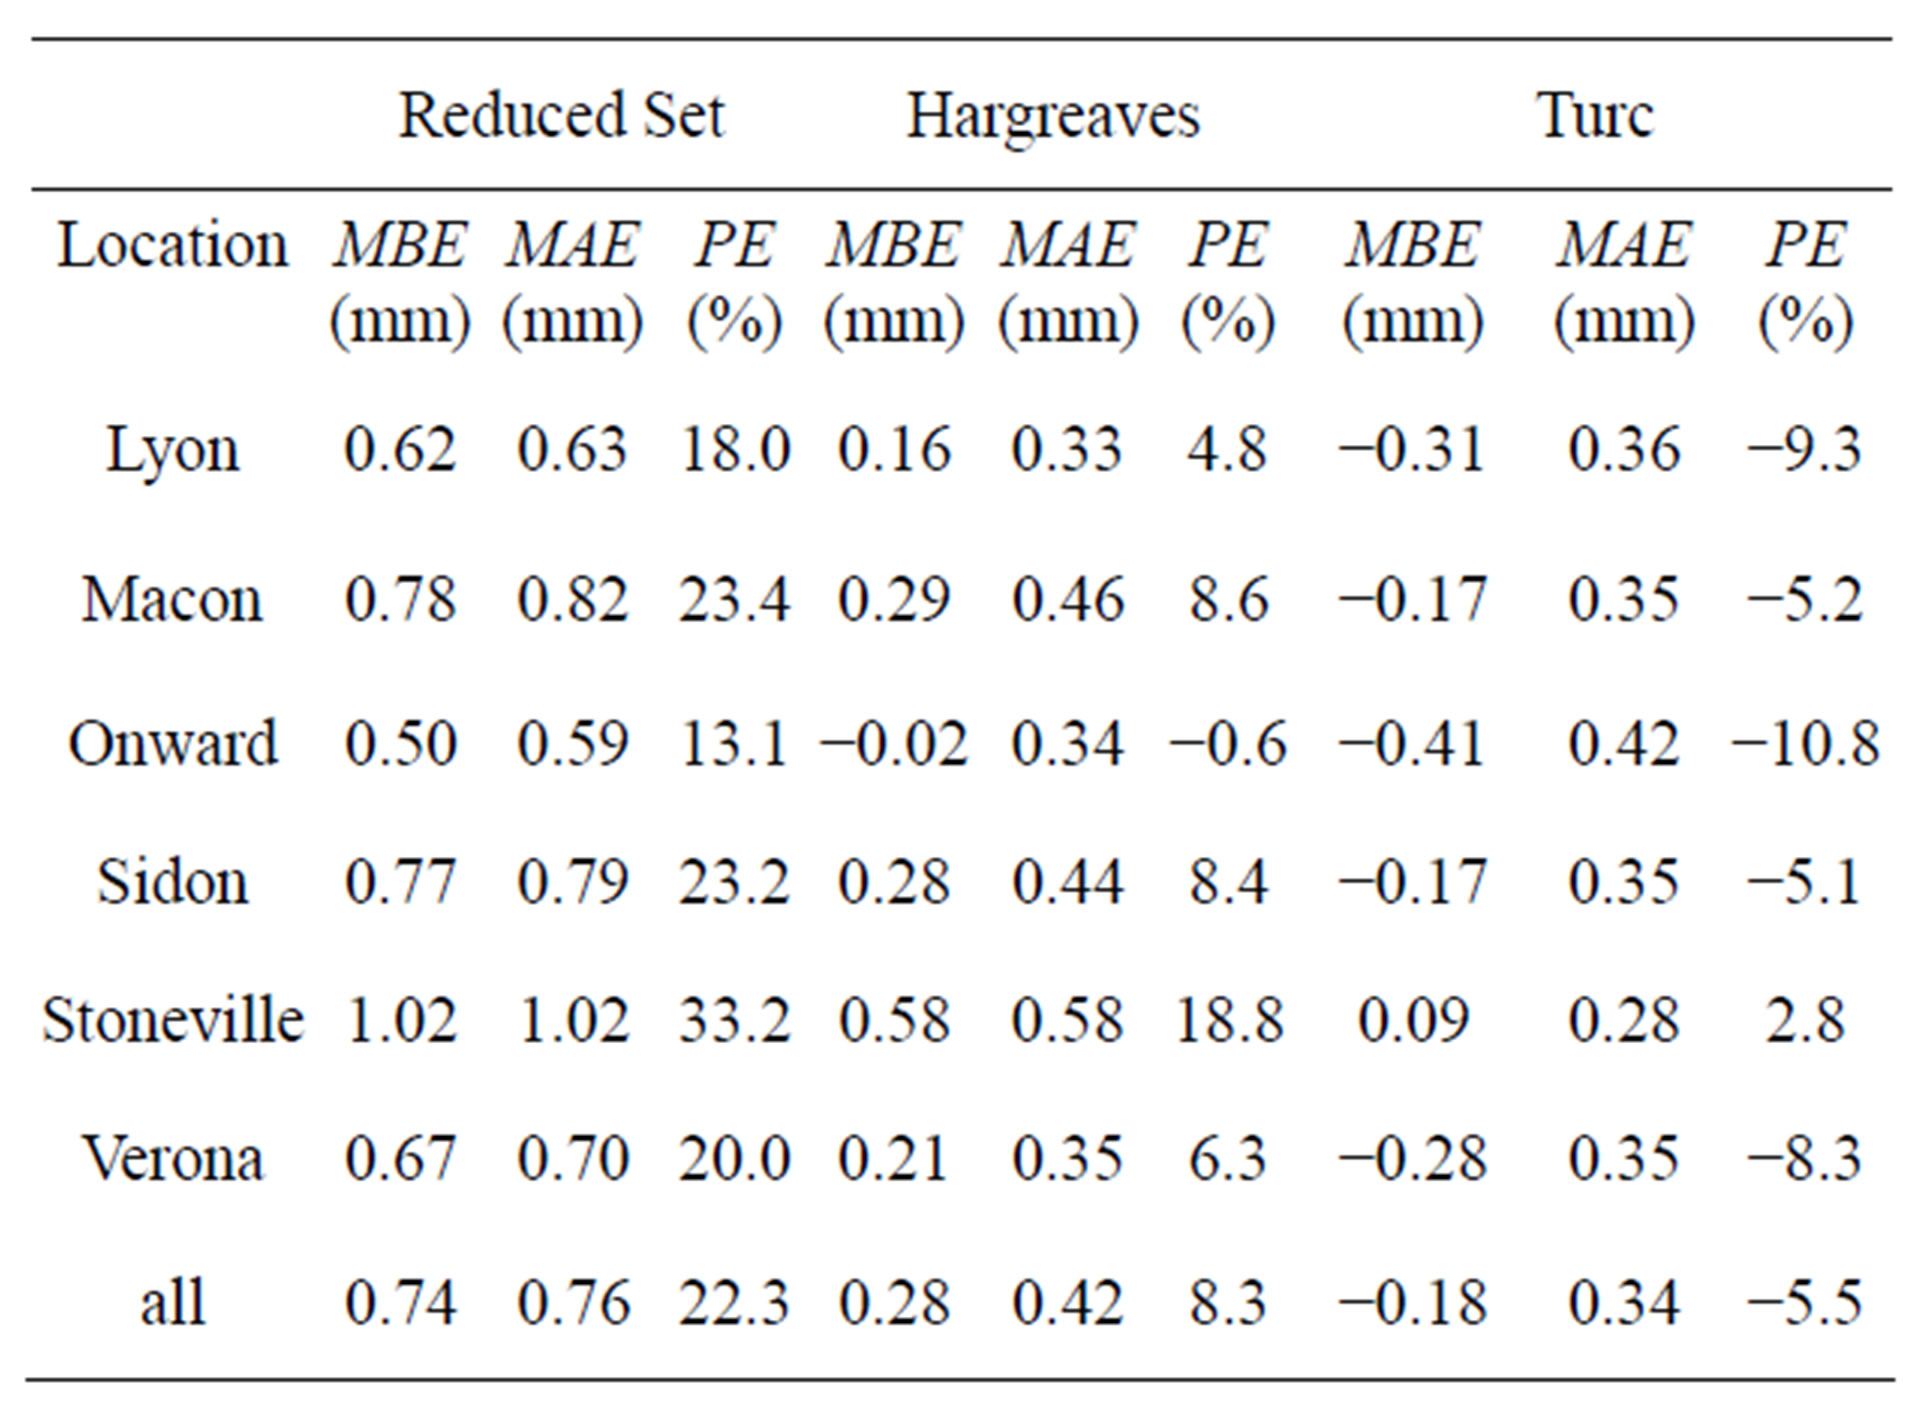
Table 4. Error values of average daily ETo estimates on monthly basis as compared to FAO-56 method.
relationship between the FAO-56 RS and FAO-56 ETo estimates. Slopes of the regression lines ranged from 0.70 to 0.79, indicating that FAO-56 RS estimates were significantly higher than FAO-56 estimates. Error statistics listed in Table 4 show PE values ranging from 13.1% to 33.2%, with an overall PE of 22.3% for all data combined. Since the FAO-56 RS method consistently
 (a)
(a)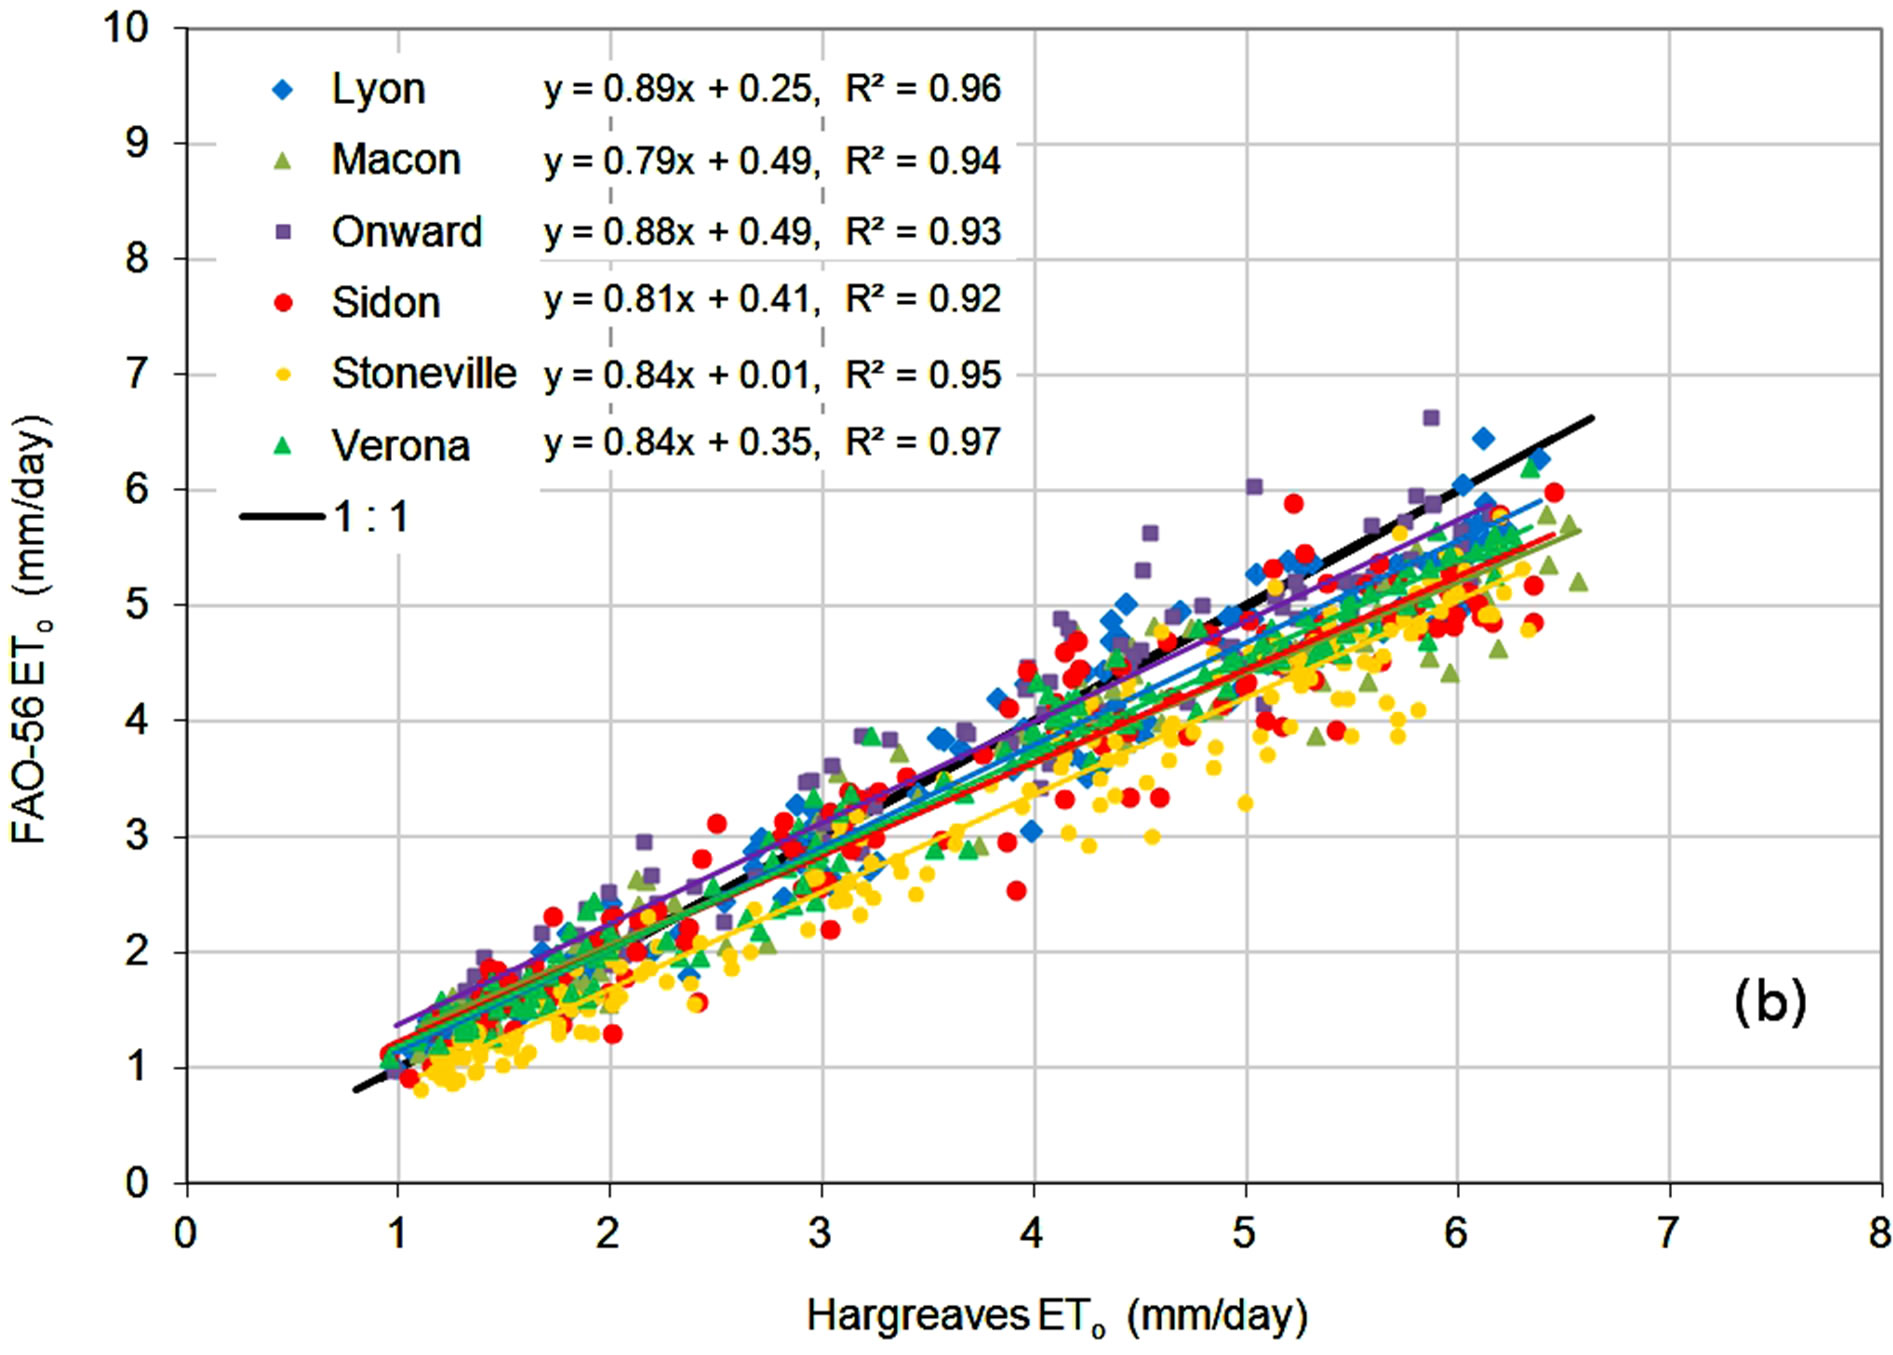 (b)
(b)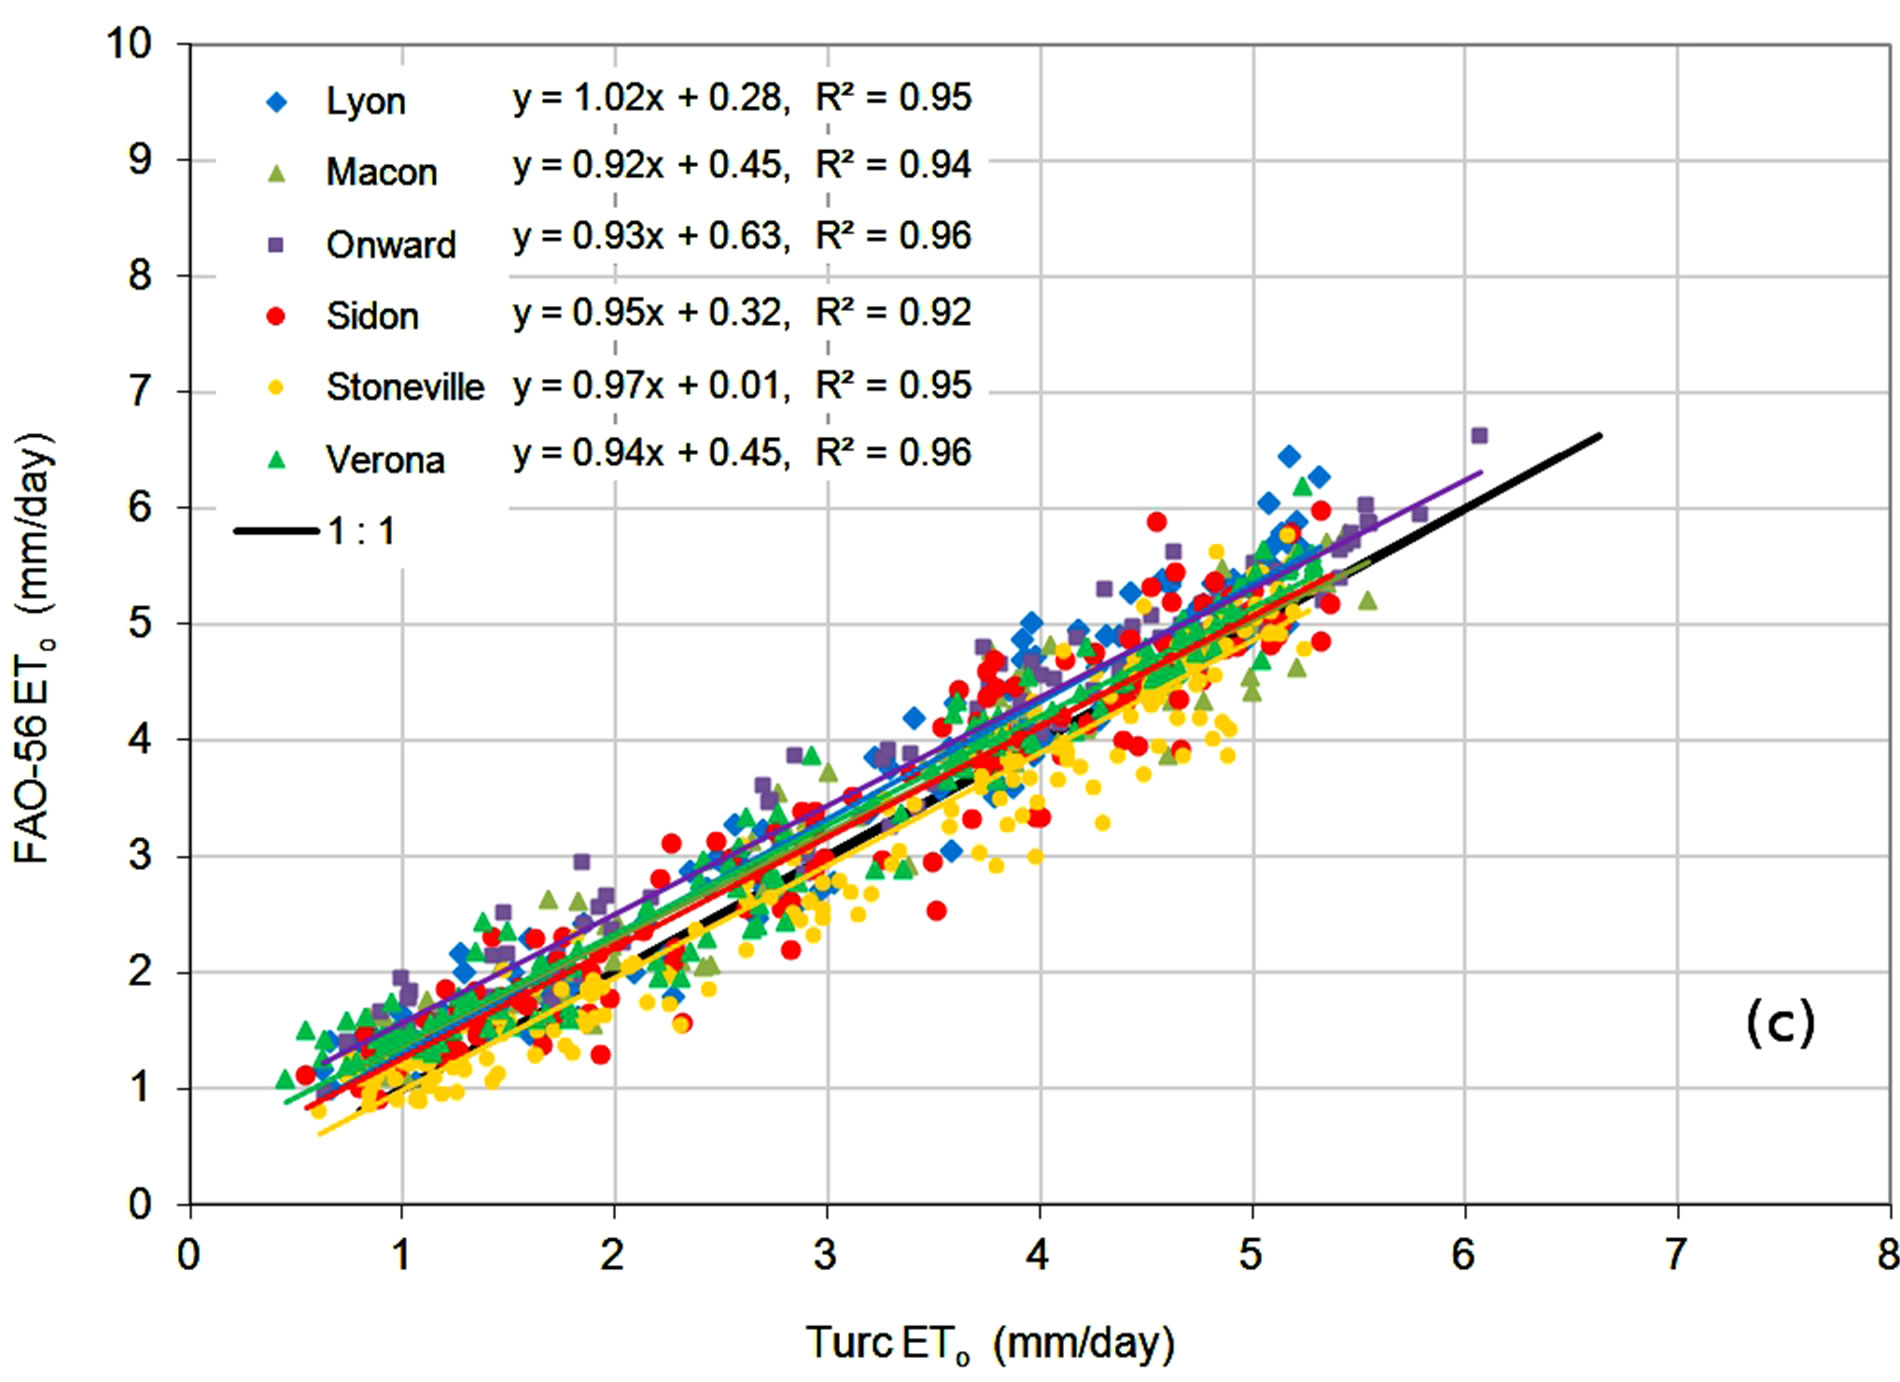 (c)
(c)
Figure 4. Monthly averages of daily ETo estimates from the (a) FAO-56 RS; (b) Hargreaves; and (c) Turc methods compared to FAO-56 ETo.
overestimated ETo, errors in ETo estimates were almost always equal to their absolute values, resulting in MBE and MAE values similar to each. MBE and MAE values ranged from 0.50 to 1.02 mm, with an overall average of 0.74 mm, and from 0.59 to 1.02 mm, and an average of 0.76 mm, respectively.
Results for the Hargreaves method, shown in Figure 4(b), show that the method slightly underestimated ETo at lower ETo values, but overestimated over most of the ETo range. Correlation coefficients ranged from 0.92 to 0.97, with slopes of the regression lines ranging from 0.79 to 0.89. Error statistics in Table 4 showed the Hargreaves method to be an improvement over the FAO-56 RS method, with PE values ranging from −0.6% to 18.8%, with an overall average of 8.3%. MBE ranged from −0.02 to 0.58 mm, with an average of 0.28 mm, and MAE ranged from 0.33 to 0.58 mm, with an average of 0.42 mm. By averaging over a monthly time period, underand over-predictions partially offset each other, reducing the MBE error terms compared to the MAE values.
Results for the Turc equation, shown in Figure 4(c), show that this method underestimated ETo throughout the range of FAO-56 ETo values. Correlation coefficients ranged from 0.92 to 0.96, with slopes close to 1.0, ranging from 0.92 to 1.02. Errors were lower at almost all locations compared to the other two methods, with PE values ranging from −10.8% to 2.8% with an overall average of −5.5%. MBE values ranged from −0.31 to 0.09 mm, with an average of −0.18 mm, and MAE ranged from 0.28 to 0.42 mm and an average of 0.34 mm. The negative values for MBE indicated that ETo estimates made with the Turc equation were almost always less than those from the FAO-56 method.
3.2. Error in Daily Estimates of Rs and ETo
Evaluation of the solar radiation model and the alternate ETo methods on a monthly time scale show the performance of these methods under a best-case scenario. Each method exhibited variation in estimates on a daily time scale, with underand over-predictions throughout the year. For many uses, such as water-balance irrigationscheduling models, however, estimates are needed on a daily basis. To evaluate the performance of these methods on a daily basis, an analysis similar to that discussed previously was conducted for daily estimates.
Rs estimates on a daily basis, shown in Figure 5, exhibited considerable variability throughout the year. Correlation coefficients were much lower than those obtained from monthly averages, shown in Figure 2, but slopes of the regression lines were closer to 1.0. MBE and PE statistics, listed in Table 5, showed a slight increase, in general, in these error terms compared to those for monthly averages shown in Table 3. Due to the increased variation in daily estimates, however, MAE values were considerably higher.
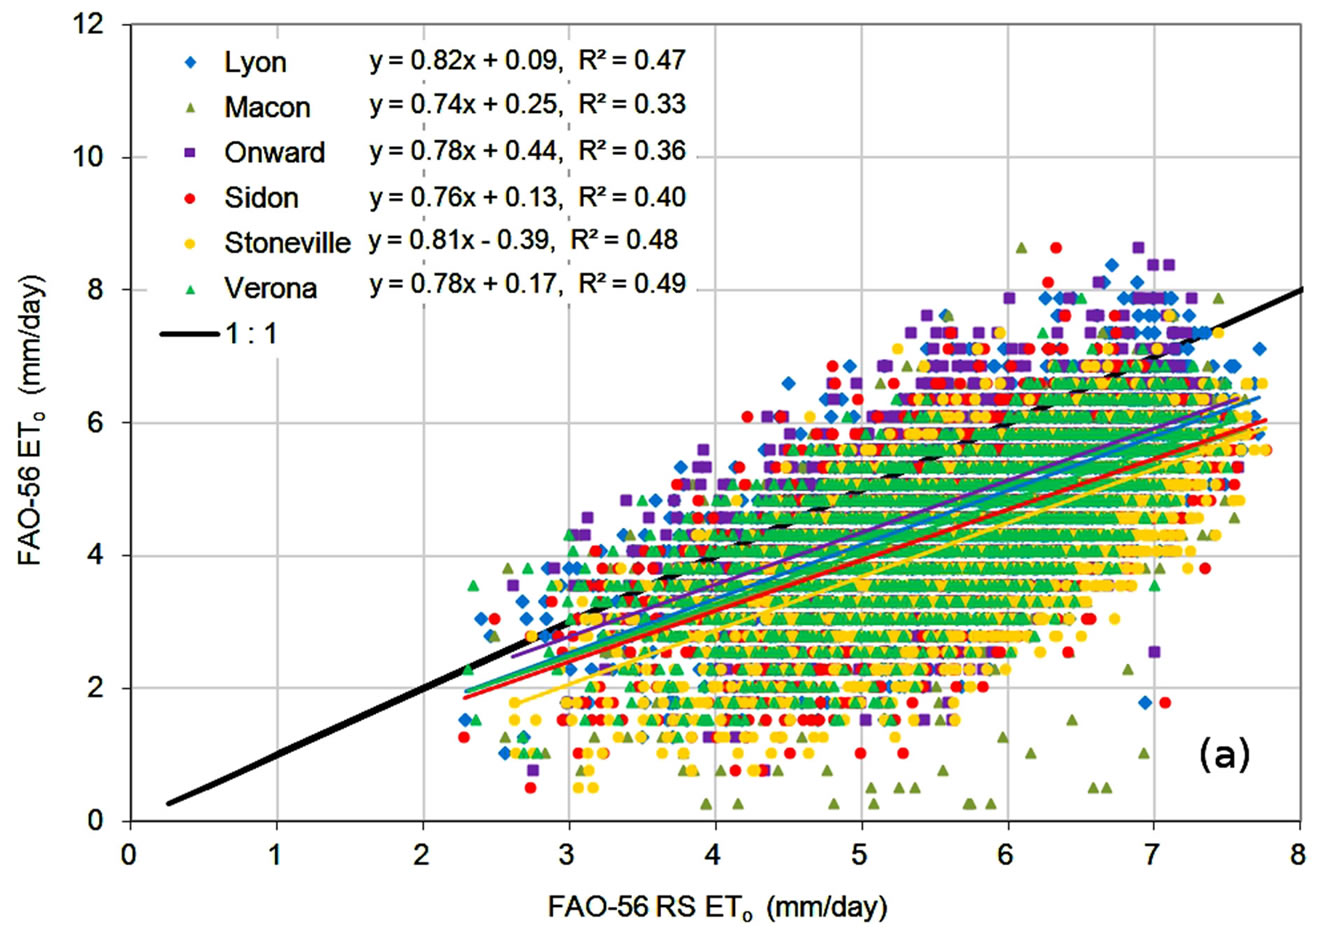
Comparison of ETo estimates on a daily basis, shown in Figure 6, showed a similar behavior. Correlation coefficients were lower, indicating increased variability in estimates, but slopes were similar, indicating consistent relationships between estimates from the alternate methods and the FAO-56 method. MBE and PE statistics, shown in Table 6, were very close to those shown Table 4, suggesting that underand over-predictions tended to partially average out in a manner similar to monthly averaging. MAE values were higher for the daily data, reflecting the increased variability in daily estimates. The error statistics showed the Turc method to have lower
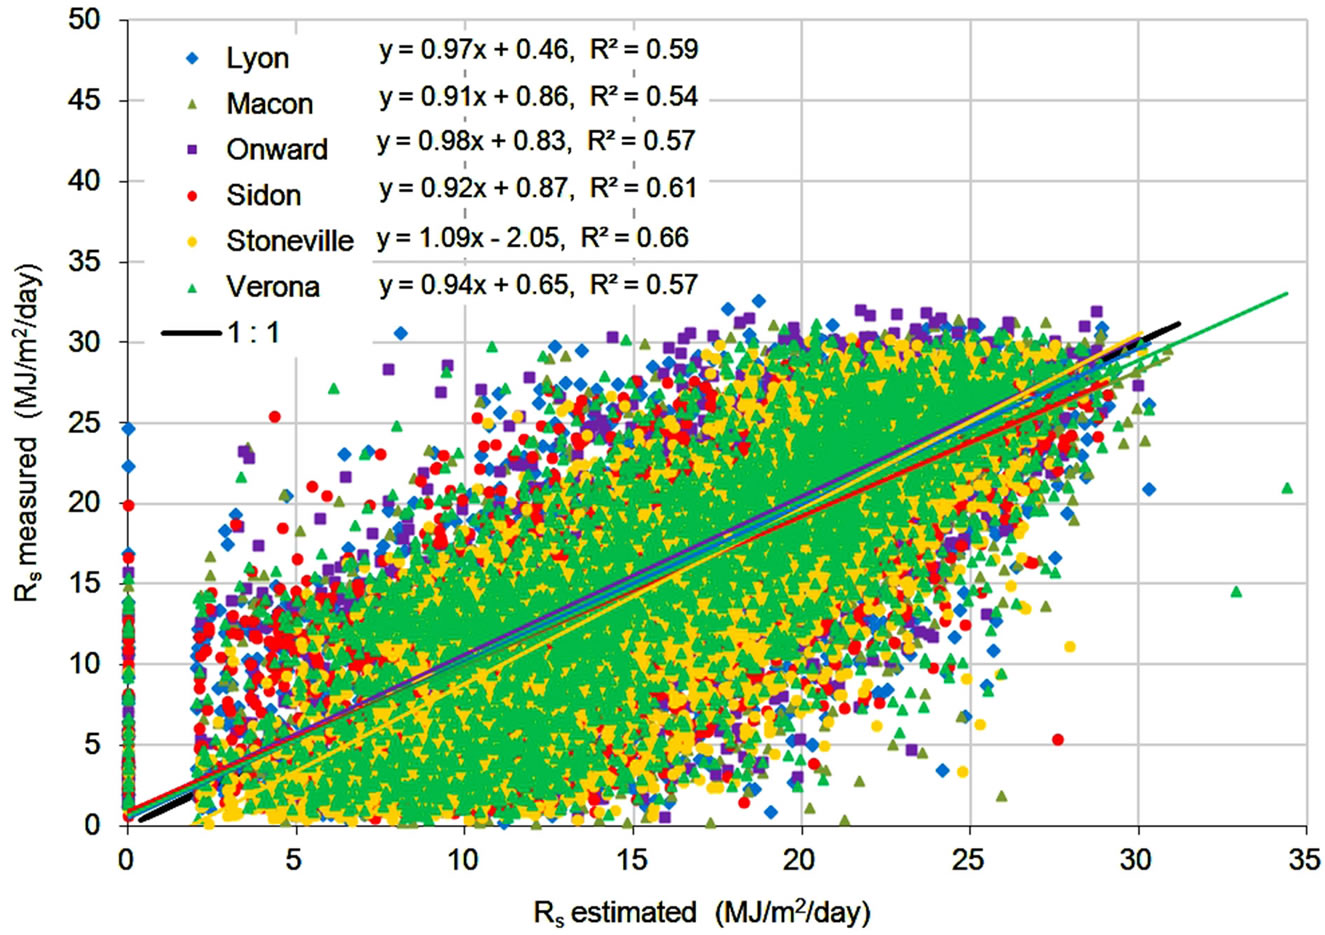
Figure 5. Comparison of measured vs estimated Rs for daily values.
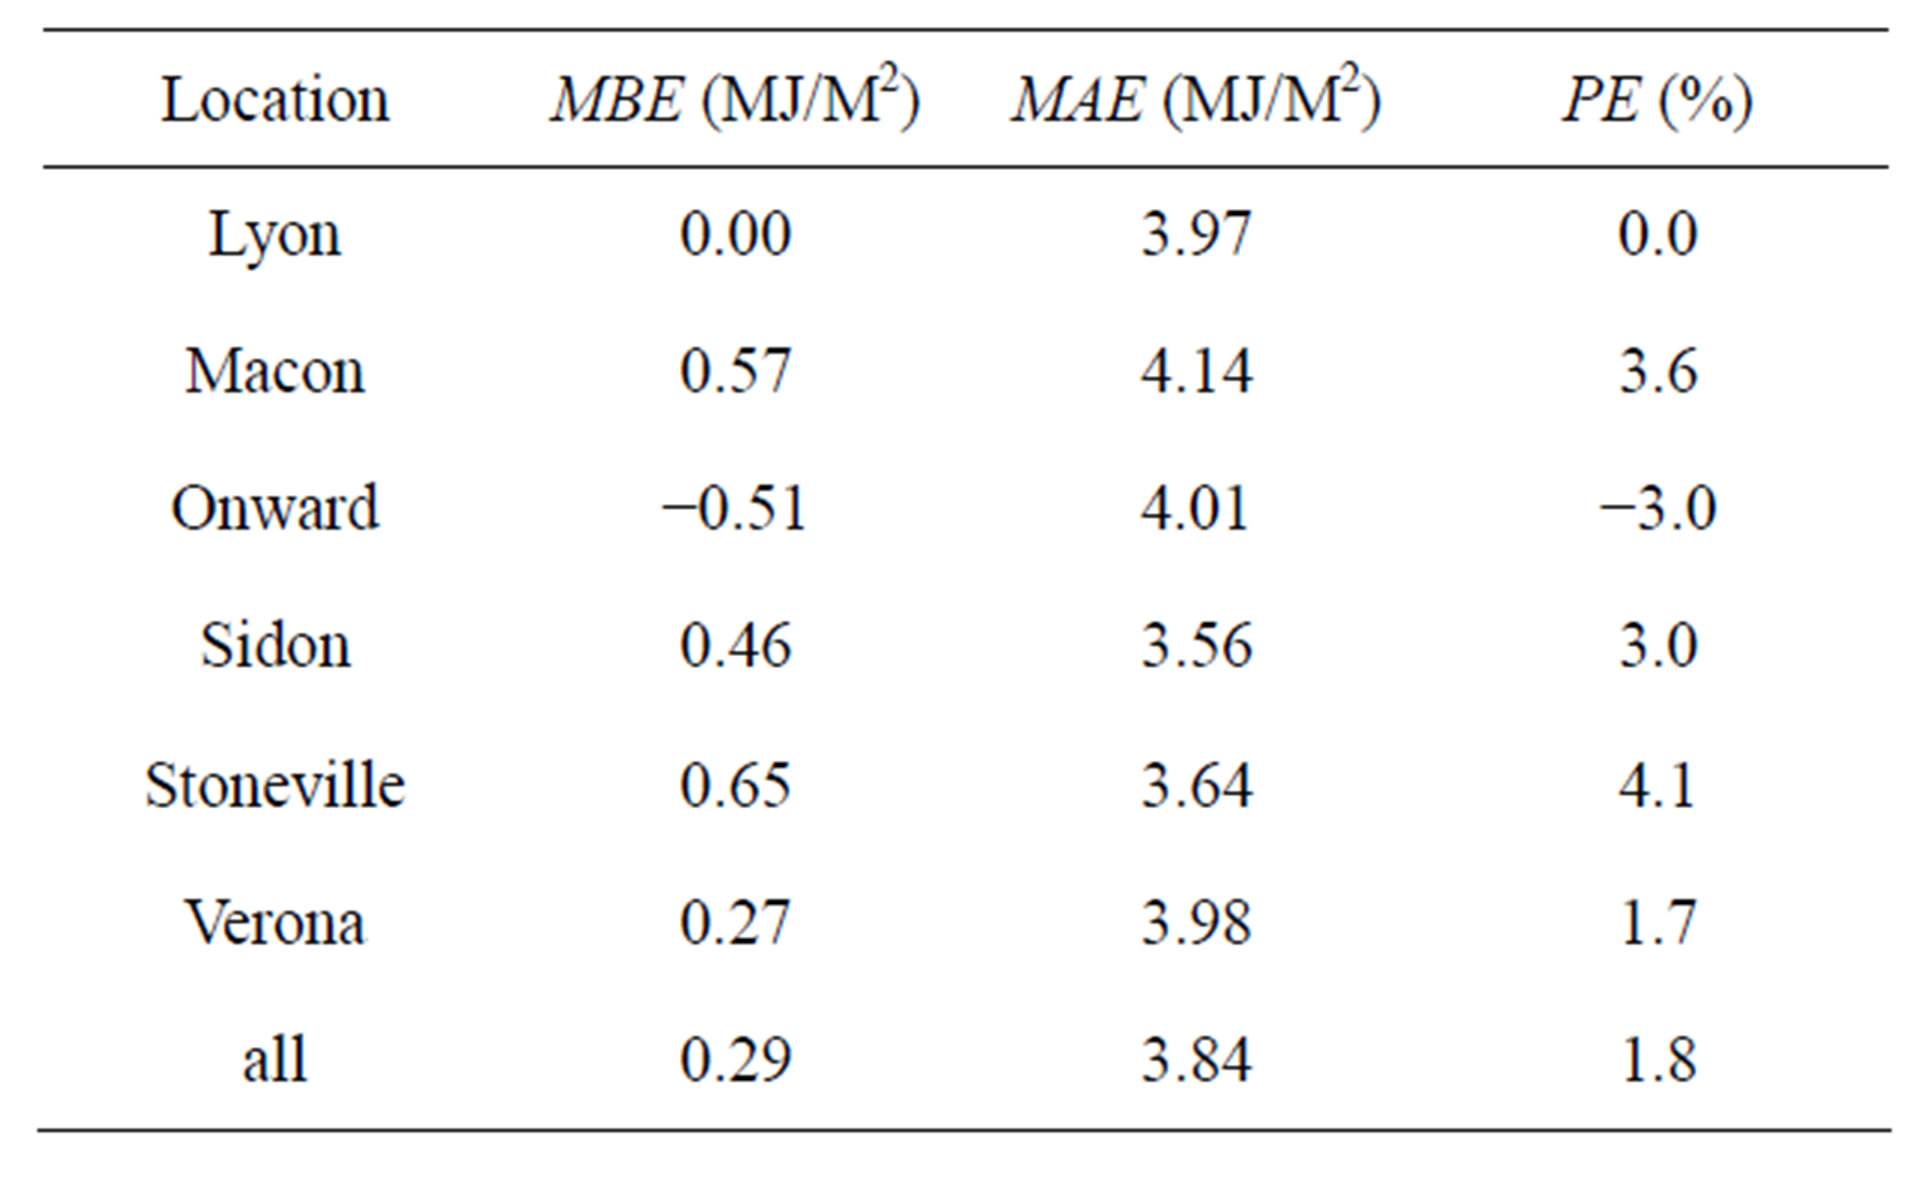
Table 5. Error values of daily solar radiation estimates.
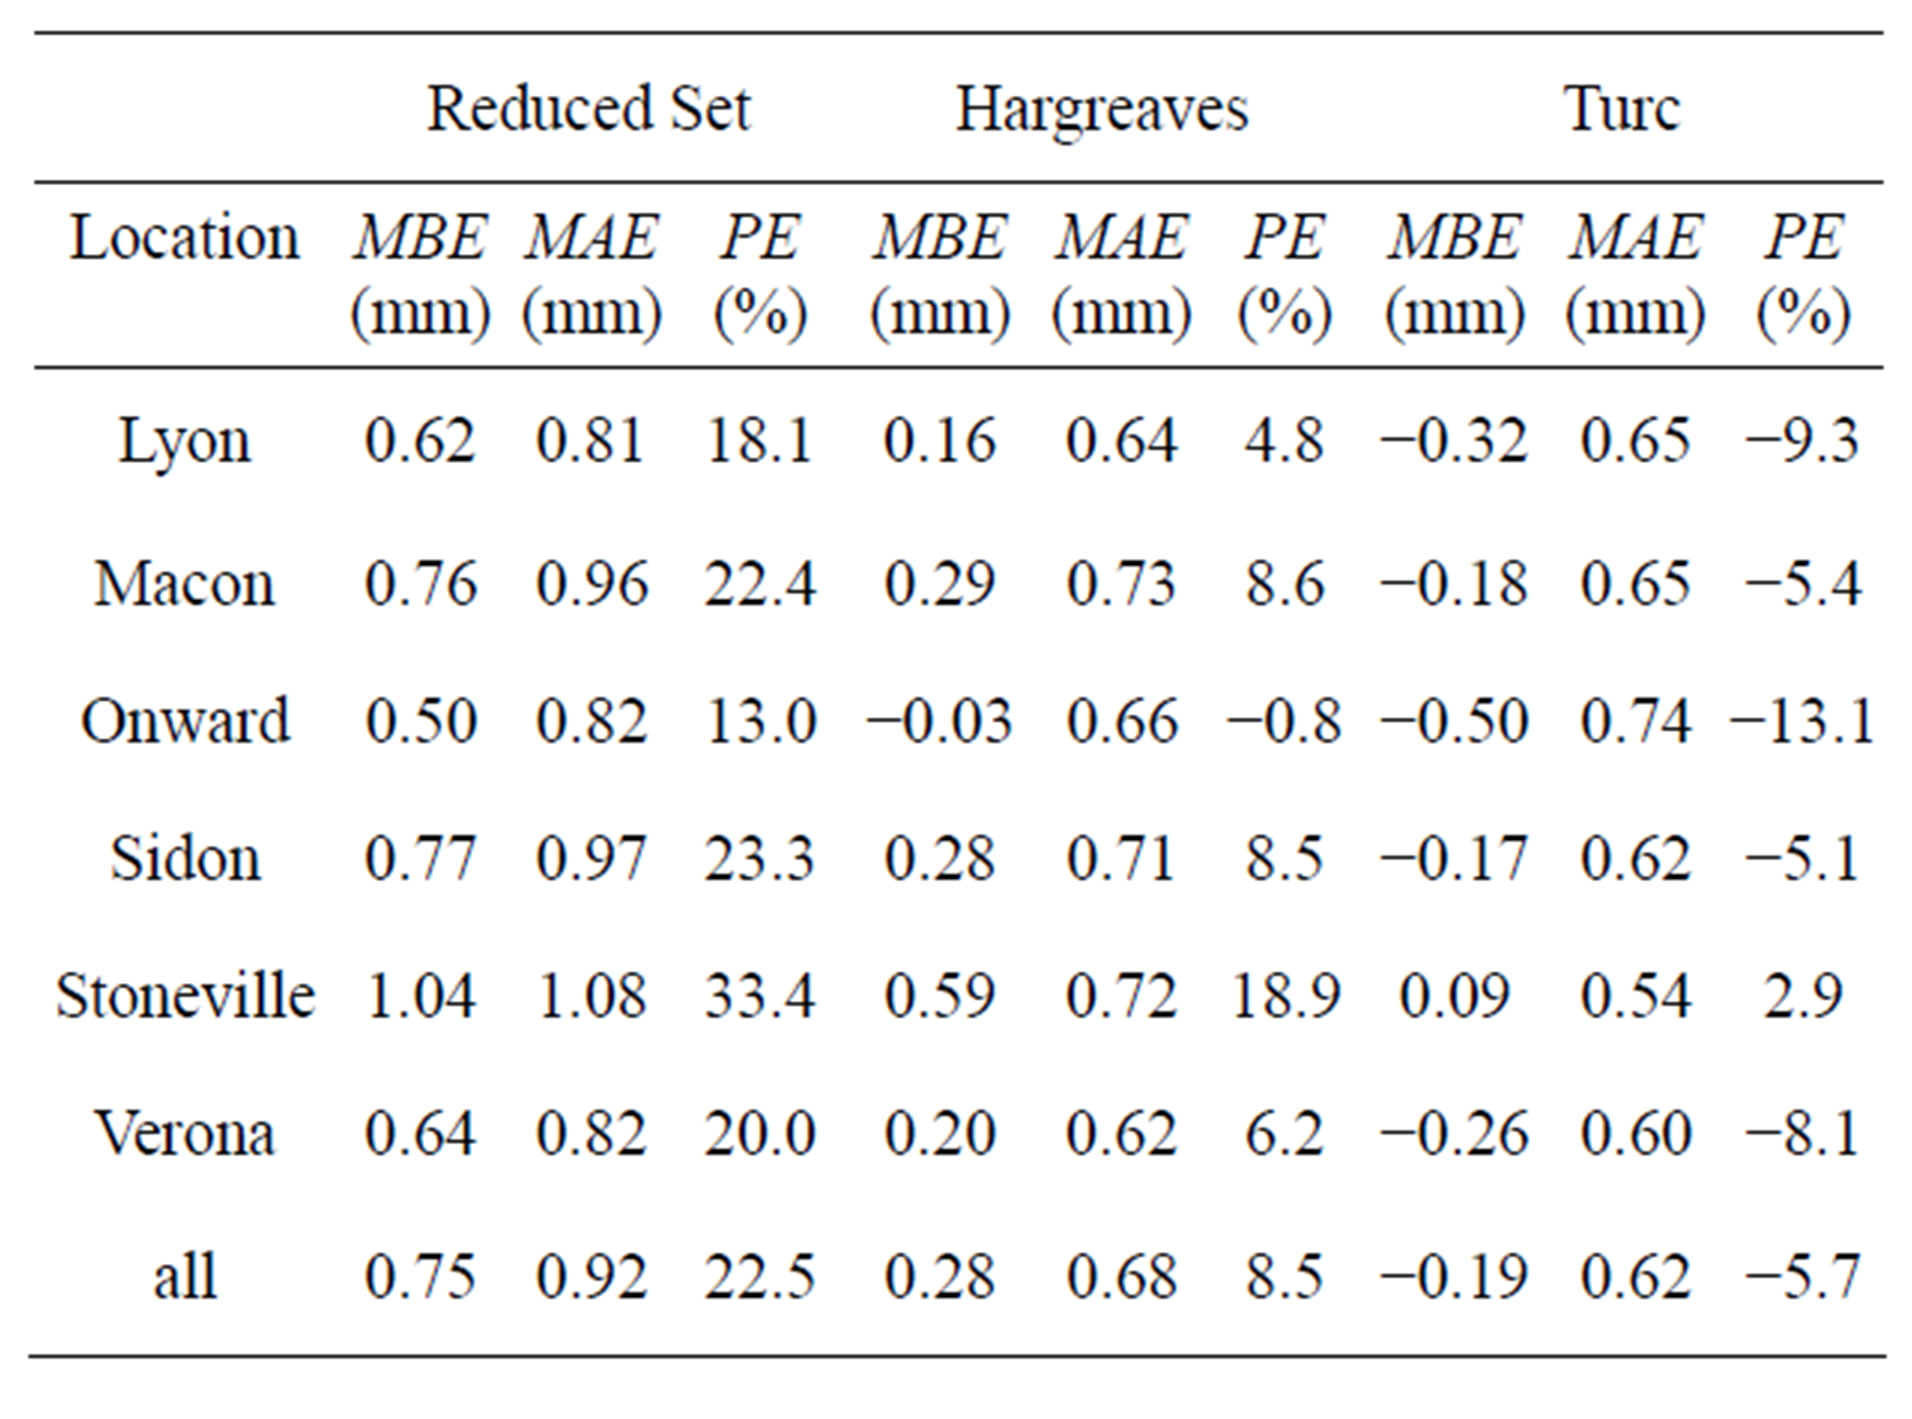
Table 6. Error values of daily ETo estimates.
errors, on average, than the Hargreaves method, which had lower errors than the FAO-56 RS method.
3.3. Error in Daily ETo Estimates during the Growing Season
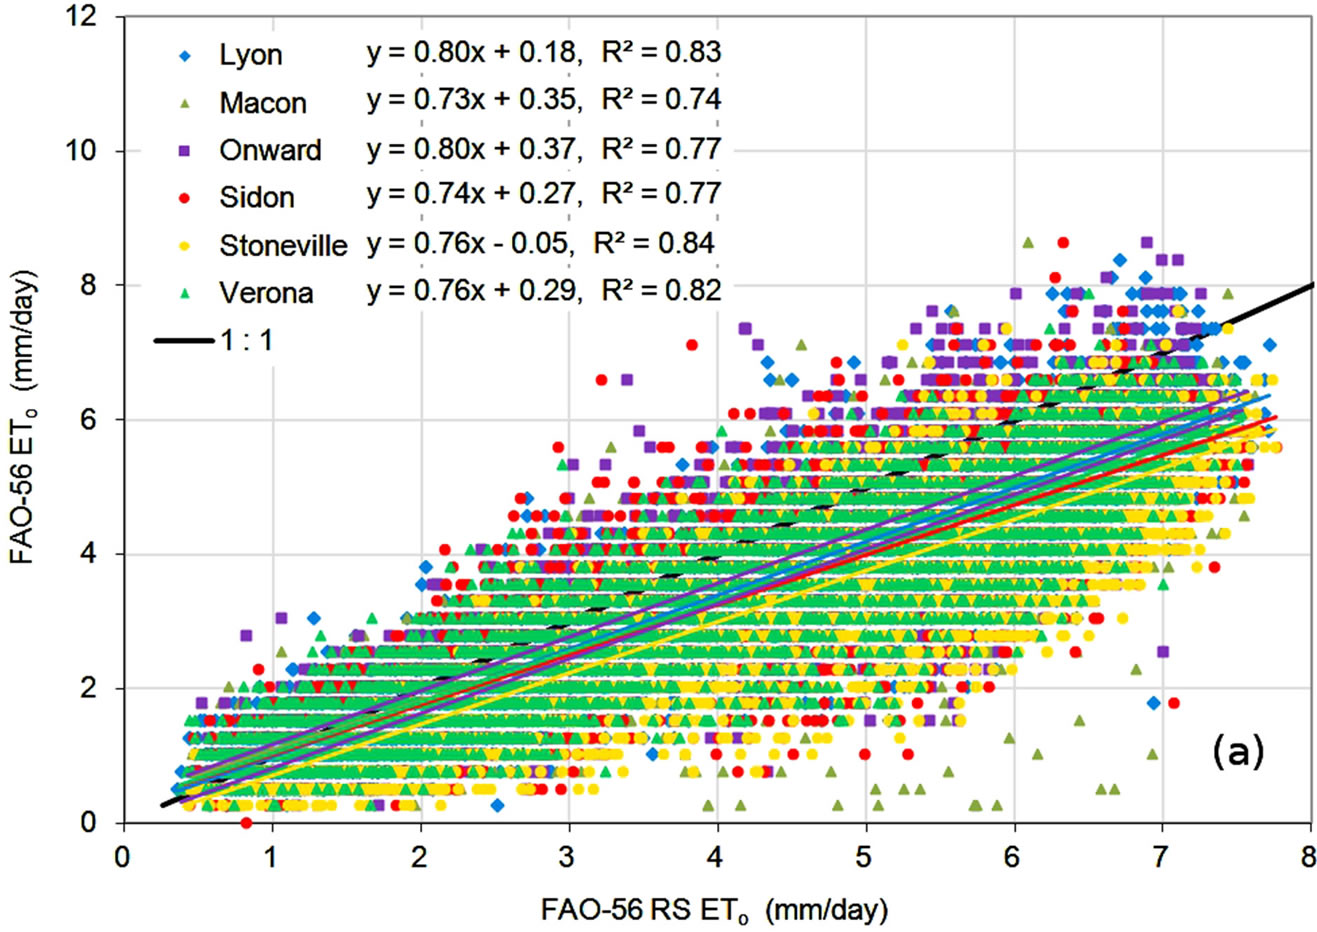
To evaluate the performance of the alternate ETo methods for application to irrigation scheduling, daily estimates during the time period of the normal growing season in the region, from April through September, were analyzed. Data shown in Figure 6 were reduced to include only daily values from the April-September time period, and are shown in Figure 7, with error statistics listed in Table 7. For each ETo method, trends during the growing season period were similar to those over the entire year. The FAO-56 RS method consistently overestimated ETo, the Hargreaves equation underestimated at low ETo values and overestimated at higher values, and the Turc method, consistently underestimated ETo. Correlation coefficients were lower for the reduced data set since the variability in estimates remained but the majority of the ETo values occurred over a smaller range. In general, error values also increased, with MBE, MAE, and PE values higher during the shorter time period. The Turc equation, however, showed a slight improvement in MBE at several locations, with smaller (numerically) underestimated ETo values, and showed a slight improvement in PE values at all locations. The Turc method continued to have the smallest average errors and the FAO- 56 RS method the highest.
4. CONCLUSIONS
While the FAO-56 method for estimating ETo has become the de facto standard worldwide, limitations on availability of reliable weather data required for use by this method often exist, and alternative reference ET methods must be used. Three alternate ETo methods, using only air temperature measurements as input, were
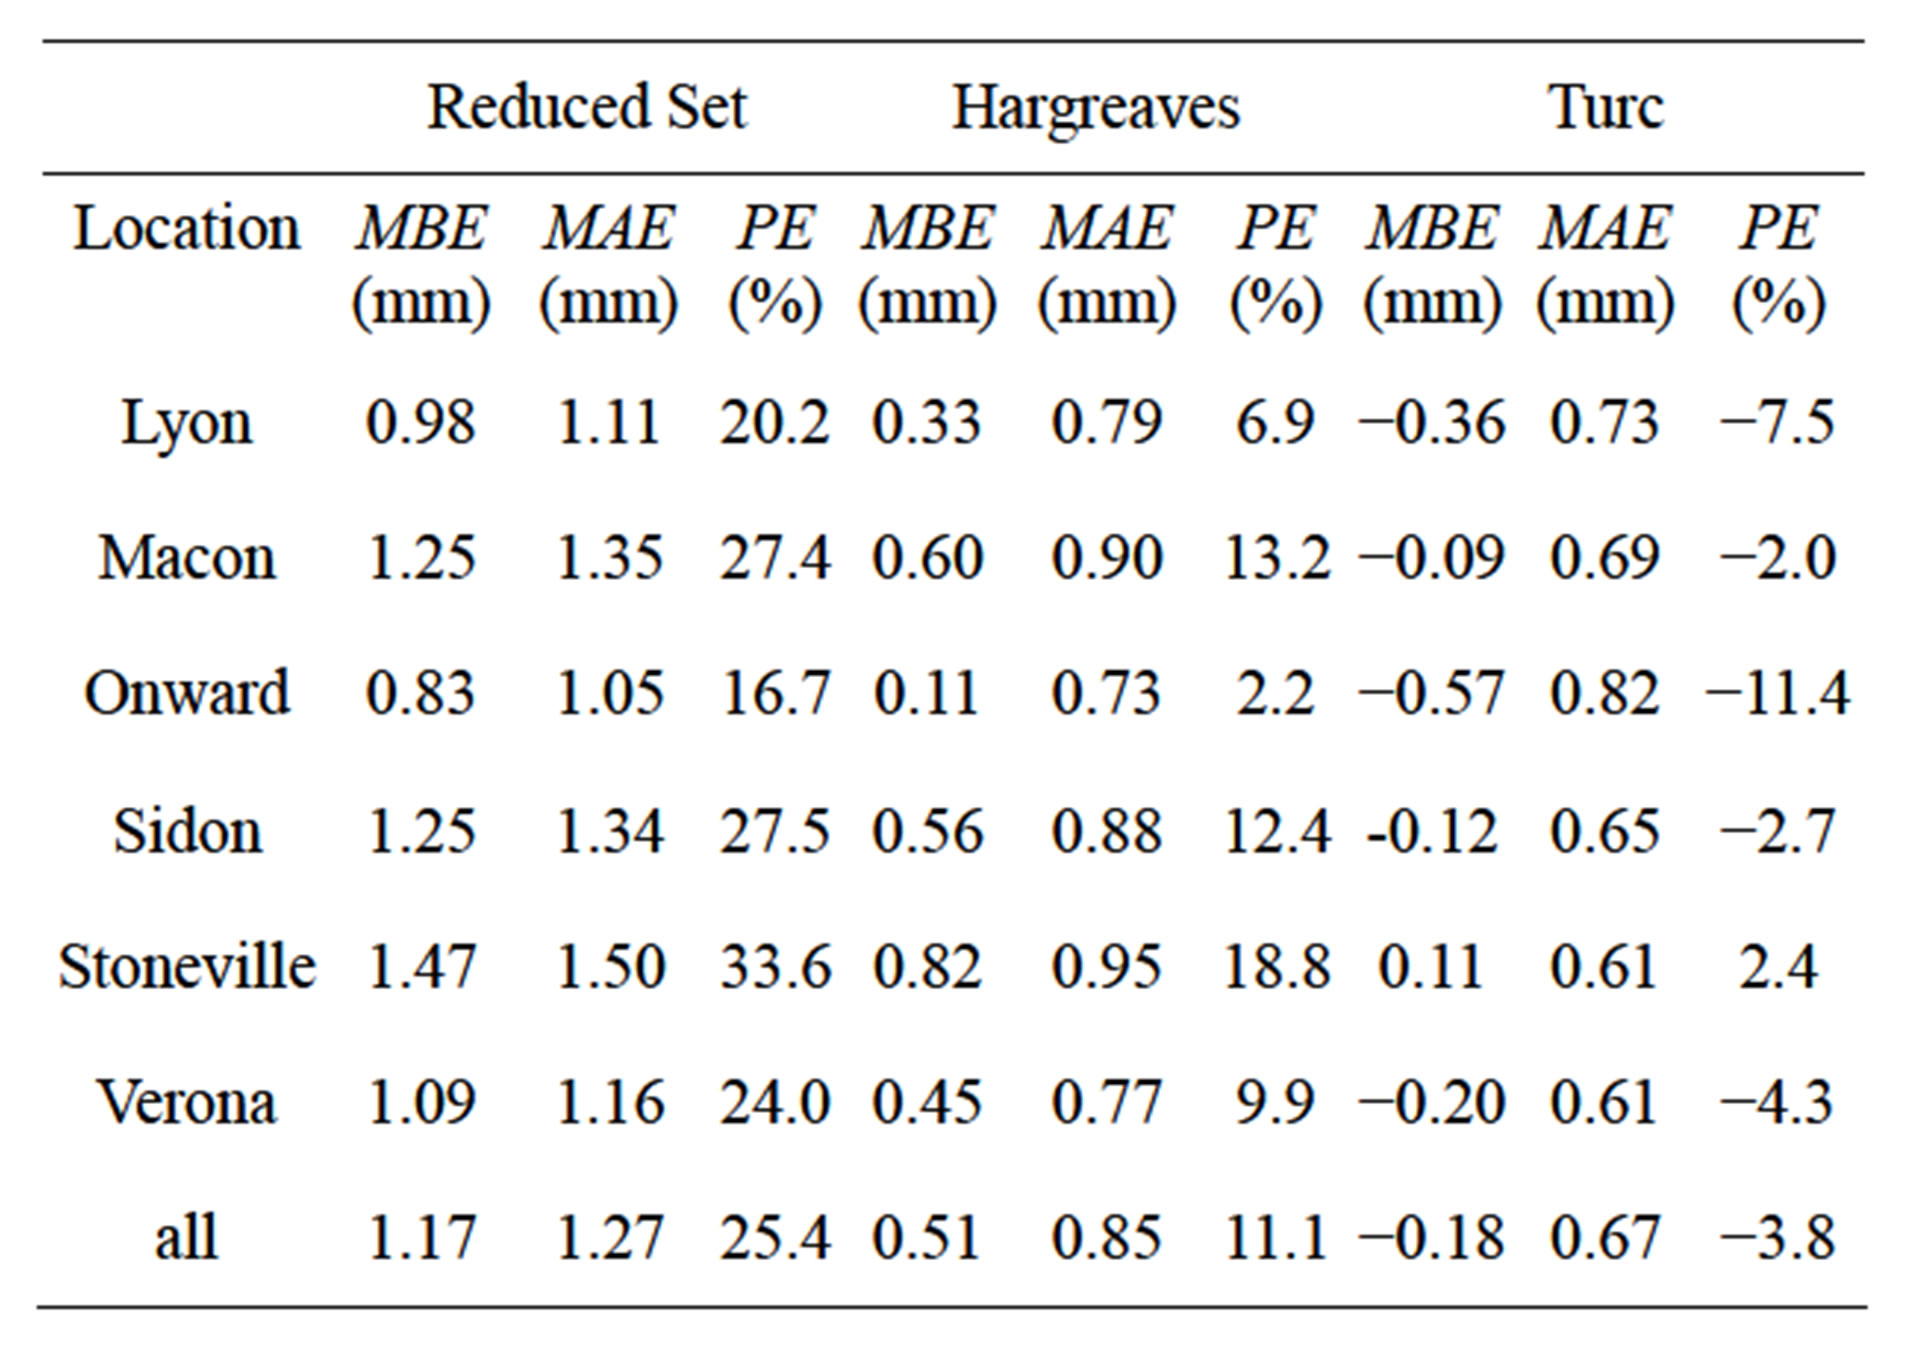
Table 7. Error values of daily ETo estimates on daily basis for April-September time period.
 (a)
(a)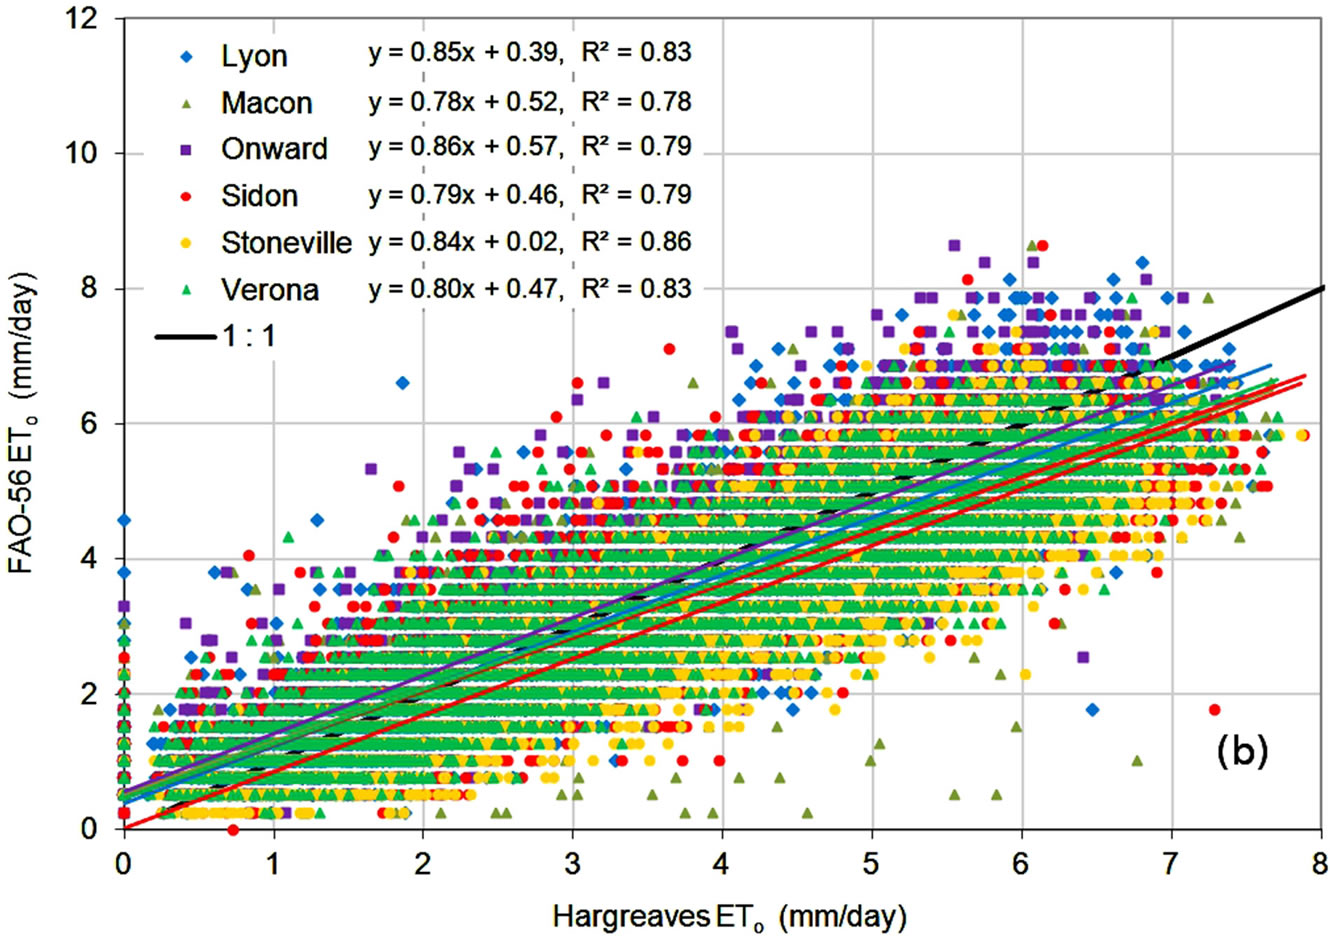 (b)
(b)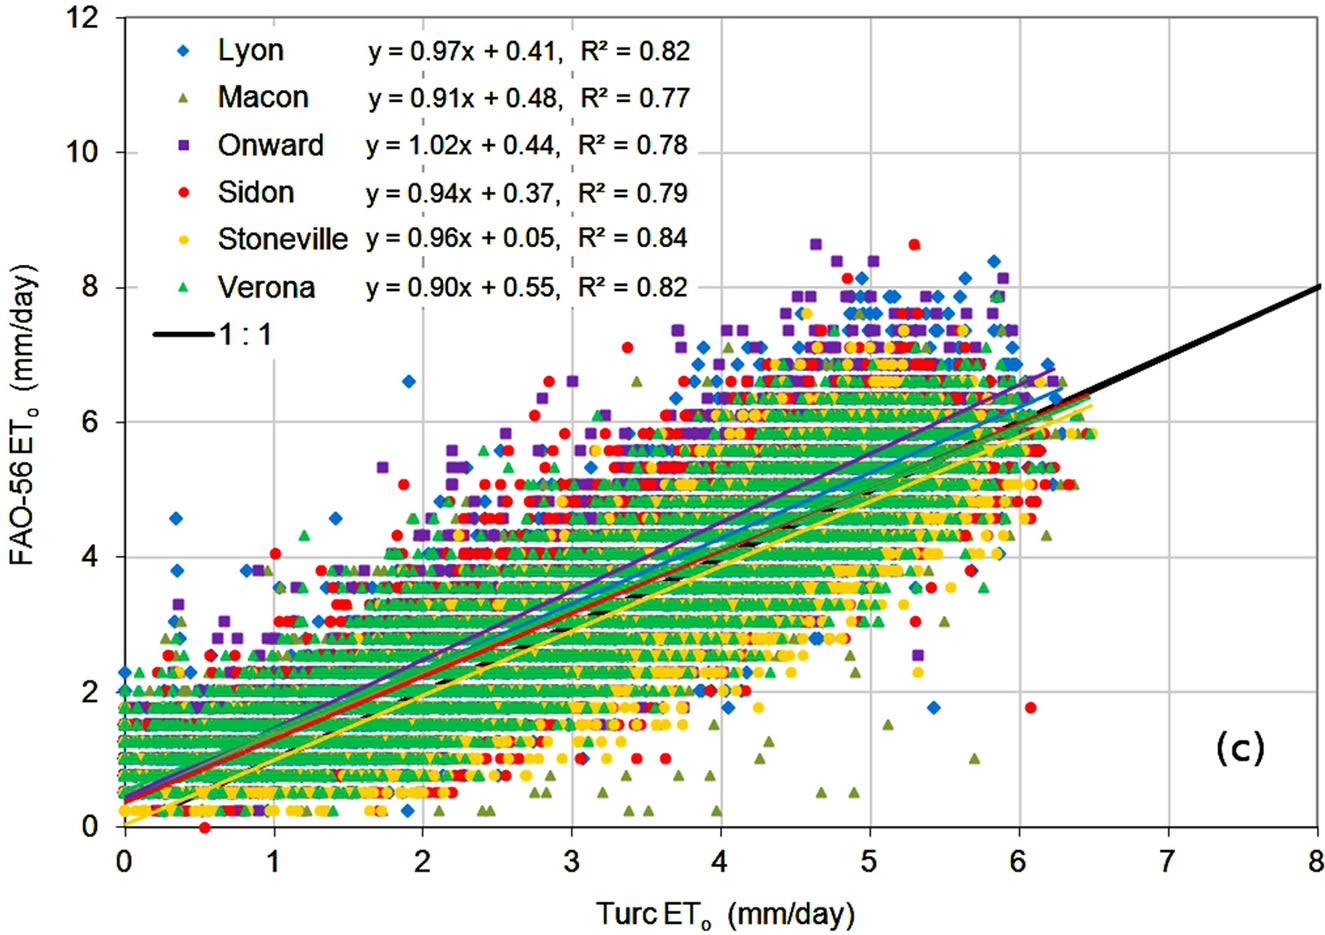 (c)
(c)
Figure 6. Daily ETo estimates from the (a) FAO-56 RS; (b) Hargreaves; and (c) Turc methods compared to FAO-56 ETo.
evaluated against the FAO-56 using all required weather data for six locations in the humid region of Mississippi USA. Two methods recommended as alternatives to the FAO-56 model, the FAO-56 method using a reduced set of weather data (FAO-56 RS) and the Hargreaves equation, were evaluated along with a third method, the Turc equation with estimated solar radiation. The three meth-
 (a)
(a)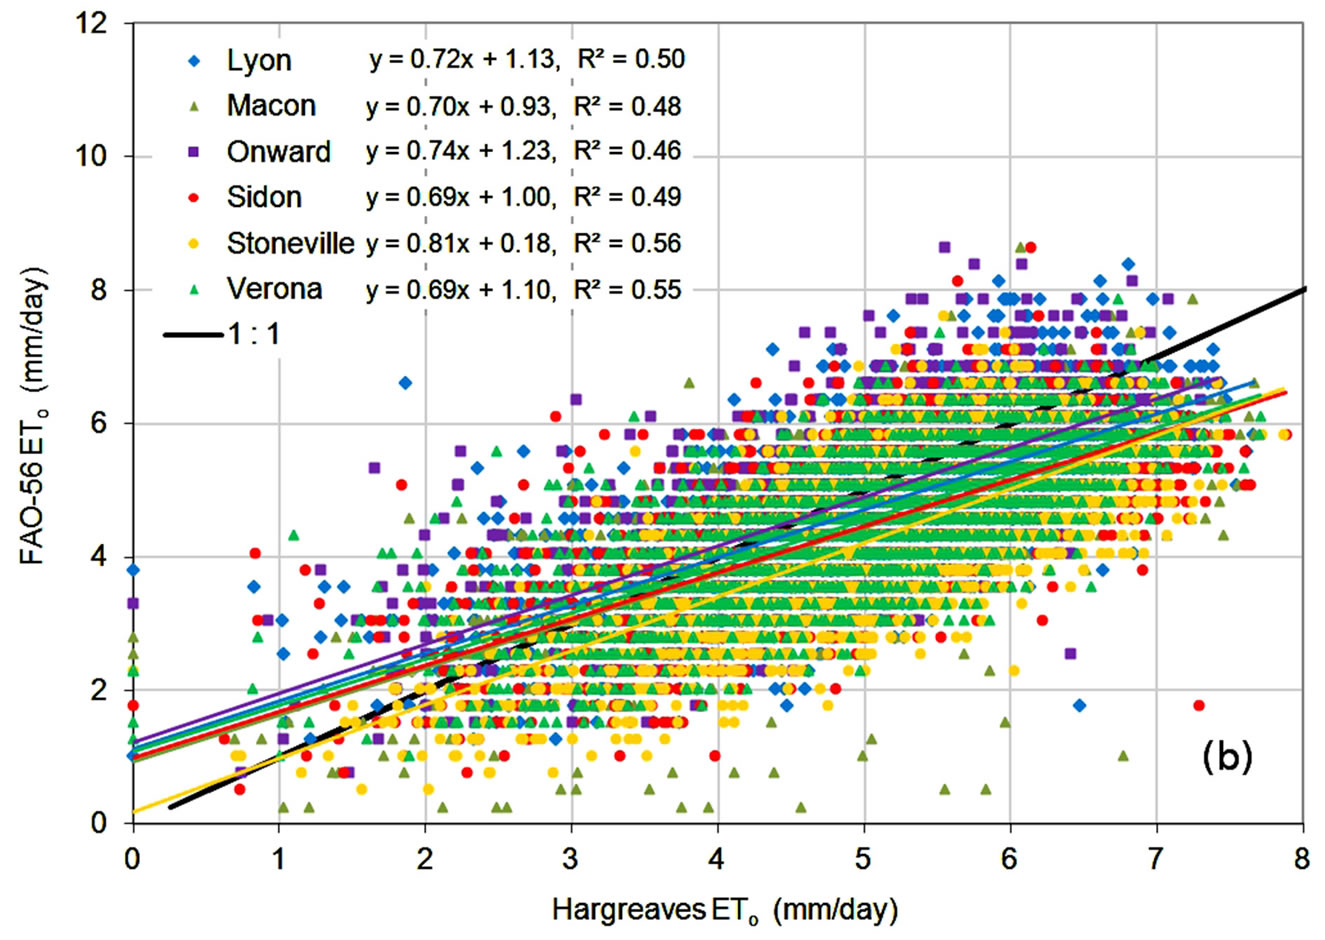 (b)
(b)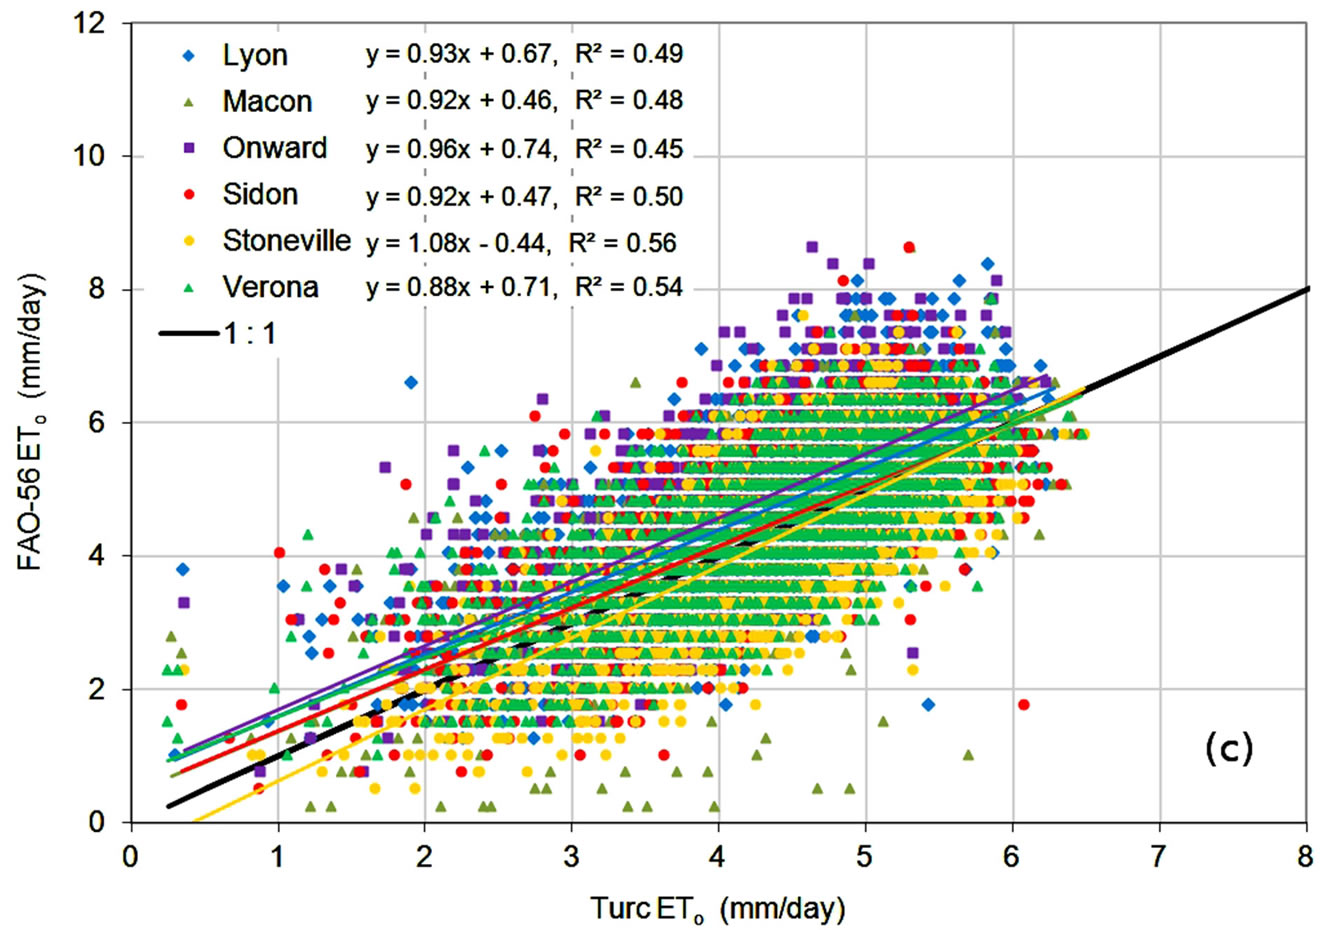 (c)
(c)
Figure 7. Daily ETo estimated with the (a) FAO-56 RS; (b) Hargreaves; and (c) Turc methods compared to FAO-56 ETo during the April-September period.
ods were evaluated by comparing daily estimates averaged over monthly periods, and daily estimates during the entire year and during the normal growing season (April-September).
The FAO-56 RS method consistently overestimated ETo, the Hargreaves equation underestimated at low ETo values and overestimated at higher values, and the Turc method, consistently underestimated ETo. Error statistics were compiled for each ETo method at each location, as well as on the data set for all locations combined. For average daily ETo estimates on a monthly time period, mean bias error (MBE) values were 0.74, 0.28, and −0.18 mm, mean absolute error (MAE) values were 0.76, 0.42, and 0.34 mm, and percent error (PE) values were 22.3%, 8.3%, and −5.5% for the FAO-56 RS, Hargreaves, and Turc methods, respectively. For daily ETo estimates during the entire year, MBE values were similar at 0.75, 0.28, and −0.19 mm, MAE values increased to 0.92, 0.68, and 0.62 mm, and PE values increased slightly to 22.5%, 8.5%, and −5.7% for the FAO-56 RS, Hargreaves, and Turc methods, respectively. During the growing season (April-September), MBE values were 1.17, 0.51, and −0.18 mm, MAE values were 1.27, 0.85, and 0.67 mm, and PE values were 25.4%, 11.1%, and −3.8% for the FAO-56 RS, Hargreaves, and Turc methods, respectively.
Under the humid weather conditions encountered in the region under study, the Turc equation appears to be an appropriate alternate method for estimating ETo. While the Turc equation was developed with air temperature and solar radiation measurements as inputs, the equation was used successfully with measured air temperature and estimated solar radiation. The Turc equation with estimated solar radiation provided more accurate estimates of FAO-56 ETo than the recommended alternate methods, the FAO-56 reduced set (FAO-56 RS) method or the Hargreaves equation. This method would be of use in this region if the complete set of weather data for the FAO-56 method was unavailable, or if a computationally simpler method was desired. This method may be an option and should be evaluated in other similar regions as an alternate ETo estimation method if use of the FAO-56 method is not feasible.
REFERENCES
- Doorenbos, J. and Pruitt, W.O. (1977) Crop water requirements. FAO Irrigation and Drainage Paper No. 24, FAO, Rome.
- Allen, R.G., Pereira, L.S., Raes, D. and Smith, M. (1998) Crop evapotranspiration: Guidelines for computing crop water requirements. FAO Irrigation and Drainage Paper No. 56, FAO, Rome.
- Itier, B. (1996) Applicability and limitations of irrigation scheduling methods and techniques. Proceedings ICID/ FAO Workshop on Irrigation Scheduling: From Theory to Practice, Rome, 12-13 September 1995, Water Report No. 8, FAO, Rome.
- Hargreaves, G.H. and Samani, Z.A. (1985) Reference crop evapotranspiration from temperature. Applied Engineering in Agriculture, 1, 96-99.
- Castañeda, L. and Rao, P. (2005) Comparison of methods for estimating reference evapotranspiration in southern California. Journal of Environmental Hydrology, 13, Paper 14.
- Tabari, H. (2010) Evaluation of reference crop evapotranspiration equations in various climates. Water Resource Management, 24, 2311-2337. doi:10.1007/s11269-009-9553-8
- Shahidian, S., Serralheiro, R., Serrano, J., Teixeira, J., Haie, N. and Santos, F. (2012) Hargreaves and other reduced-set methods for calculating evapotranspiration. In: Irmak, A., Ed., Evapotranspiration—Remote Sensing and Modeling, InTech, Morn Hill, 59-80. doi:10.5772/725
- Lu, J., Sun, G., McNulty, S.G., and Amatya, D.M. (2005) A comparison of six potential evapotranspiration methods for regional use in the southeastern United States. Journal of the American Water Resources Association, 41, 621- 633.
- Yoder, R.E., Odhiambo, L.O. and Wright, W.C. (2005) Evaluation of methods for estimating daily reference crop evapotranspiration at a site in the humid southeast United States. Applied Engineering in Agriculture, 21, 197-202.
- Douglas, E.M., Jacobs, J.M., Sumner, D.M. and Ray, R.L. (2009) A comparison of models for estimating potential evapotranspiration for Florida land cover types. Journal of Hydrology, 373, 366-376. doi:10.1016/j.jhydrol.2009.04.029
- Trajkovic, S. and Kolakovic, S. (2009) Evaluation of reference evapotranspiration equations under humid conditions. Water Resource Management, 23, 3057-3067. doi:10.1007/s11269-009-9423-4
- Tabari, H., Grismer, M.E. and Trajkovic, S. (2013) Comparative analysis of 31 reference evapotranspiration methods under humid conditions. Irrigation Science, 31, 107-117.
- Turc, L. (1961) Water requirements assessment of irrigation, potential evapotranspiration: Simplified and updated climatic formula. Annales Agronomiques, 12, 13-49.
- Allen, R.G. (2002) RefET: Reference evapotranspiration calculator. Version 2.01.17, Utah State University Foundation, Logan.
- Hargreaves, G.H. and Samani, Z.A. (1982) Estimating potential evapotranspiration. Journal of Irrigation and Drainage Engineering, 108, 223-230.
- Willmott, C.J. and Matsuura, K. (2005) Advantages of the mean absolute error (MAE) over the root mean square error (RMSE) in assessing average model performance. Climate Research, 30, 79-82. doi:10.3354/cr030079