International Journal of Geosciences
Vol.07 No.10(2016), Article ID:71670,16 pages
10.4236/ijg.2016.710093
Monitoring Land Use and Infrastructure Changes in Industrial Complex Using Geo-Informatics Technology in Gujarat State, India
Ajay N. Patel1, Vijay Singh1, Bhagirath Kansara1, Manik H. Kalubarme1*, Bindiya Panchal2
1Bhaskarcharya Institute for Space Applications and Geo-Informatics (BISAG), Department of Science & Technology, Government of Gujarat, Gandhinagar, INDIA
2Gujarat Industrial Development Corporation (GIDC), Gandhinagar, India

Copyright © 2016 by authors and Scientific Research Publishing Inc.
This work is licensed under the Creative Commons Attribution International License (CC BY 4.0).
http://creativecommons.org/licenses/by/4.0/


Received: July 5, 2016; Accepted: October 28, 2016; Published: October 31, 2016
ABSTRACT
In the present study, detailed investigations have been carried out in Petroleum, Chemicals and Petrochemical Investment Region (PCPIR) area in Vygra and Bharuch Talukas in Bharuch district of Gujarat State. Indian Remote Sensing Satellite (IRS-P6) LISS-III, LISS-IV and CARTOSAT digital data covering PCPIR area in Bharuch district for the period of January & February of 2011, 2012 and 2013 was analyzed for land use/land cover mapping and monitoring the changes in land use. Various thematic land use/land cover maps were prepared and GIS database for various thematic layers have been generated using satellite and ground based information. The results indicate that the major land use in the PCPIR area is agriculture with crop lands ranging from 61 to 63 per cent of the total area. Crop land has decreased from 64.7% during 2011 to 62.7% during 2013 in the PCPIR region. Area under plantations in PCPIR area has also decreased from 5.5% during 2011 to 5.2% during 2012. The industrial area has increased from 6.0% to 7.6% of the total area of the PCPIR region. The total built-up area (industries & village area) has increased from 7.1% during 2011 to 8.7% during 2013. Tree plantations in the area of around 42 ha were carried out by GIDC during 2012 and 2013 to increase the green cover in the PCPIR area.
Keywords:
Petroleum, Chemicals and Petrochemical Investment Region (PCPIR), Indian Remote Sensing Satellite (IRS) LISS-IV Digital Data, CARTOSAT, Land Use/Land Cover Mapping, GIS Environment, Change Monitoring

1. Introduction
Government of India has launched the policy on the Petroleum, Chemicals and Petrochemical Investment Region (PCPIR) in the country in the month of May 2007. The Policy defined the concept of PCPIR in an area of around 453 square kilometers for developing manufacturing facilities for domestic and export oriented production in petroleum, chemical & petrochemical along with the associated services and infrastructure at Dahej and Vagra in District Bharuch South of Gujarat.
Gujarat Industrial Development Corporation (GIDC) has carried out EIA studies and risk assessment for PCPIR project through a consultant agency for preparation of Comprehensive Environmental Impact Assessment report. The study is conducted as per the Ministry of Environment and Forest (MoEF) Notification for Environment Impact Assessment (EIA), covering baseline data of three seasons for land and marine based facilities. The study consisted of preparation of the baseline data for various environmental components, viz. Air, Noise, Water, Land, Biological and Socio-economic, environmental impact and evaluation of the impacts and environmental management plan for the proposed Project at Dahej-Vagra Blocks, Dist., Bharuch, Gujarat for obtaining environmental clearance from regulatory agencies [1] . Currently there are four PCPIR zones underway in the country; they are Vishakhapatnam and East Godavari District in Andhra Pradesh, Bharuch in Gujarat, Paradip in Orissa and cudallore and Nagapattnam District in Tamil Nadu. Understanding the causes and consequences of land change is one of the prime goals of global change research [2] [3] . In this paper, an attempt has been made to link land use change with driving forces and competing land use activities in development of industries in the PCPIR area in Bharuch district.
1.1. Location of the Proposed PCPIR
The Government of Gujarat proposes to set up the Gujarat PCPIR (GPCPIR) at Dahej, spread over the Blocks of Vagra and Bharuch in the Bharuch District, South Gujarat. The coastal (Gulf of Khambhat) & riverside (Narmada River) portion of the Vagra- Dahej sub-region, falling under the administrative boundaries of the Vagra and Bharuch Taluka within Bharuch District of South Gujarat and encompassing an area of 453 sq. km have been earmarked as the proposed site for development of PCPIR by the Government of Gujarat. The PCPIR is surrounded by the Gulf of Khambhat in the West, Narmada River & Aliabet Island in the South, villages of Vagra and Bharuch Tauka in the East and Dahej Samni Railway Line in the North. The delineated area for PCPIR falls between 21˚36'37''N to 21˚54'8''N latitude and 72˚29'48''E to 72˚57'30''E longitude (Figure 1).
There are 44 villages falling within PCPIR area under the jurisdiction of GIDC, Gram Panchayats, covering an area of 45,295 ha including 3988 ha of CRZ. Available area of PCPIR is 41,307 ha which covers an area of 26,873 ha in Phase I and 14,434 ha in Phase II.
1.2. Land Use Pattern of PCPIR in Bharuch District
Rainfed agriculture is the major activity in the study area. More than 60% of land is
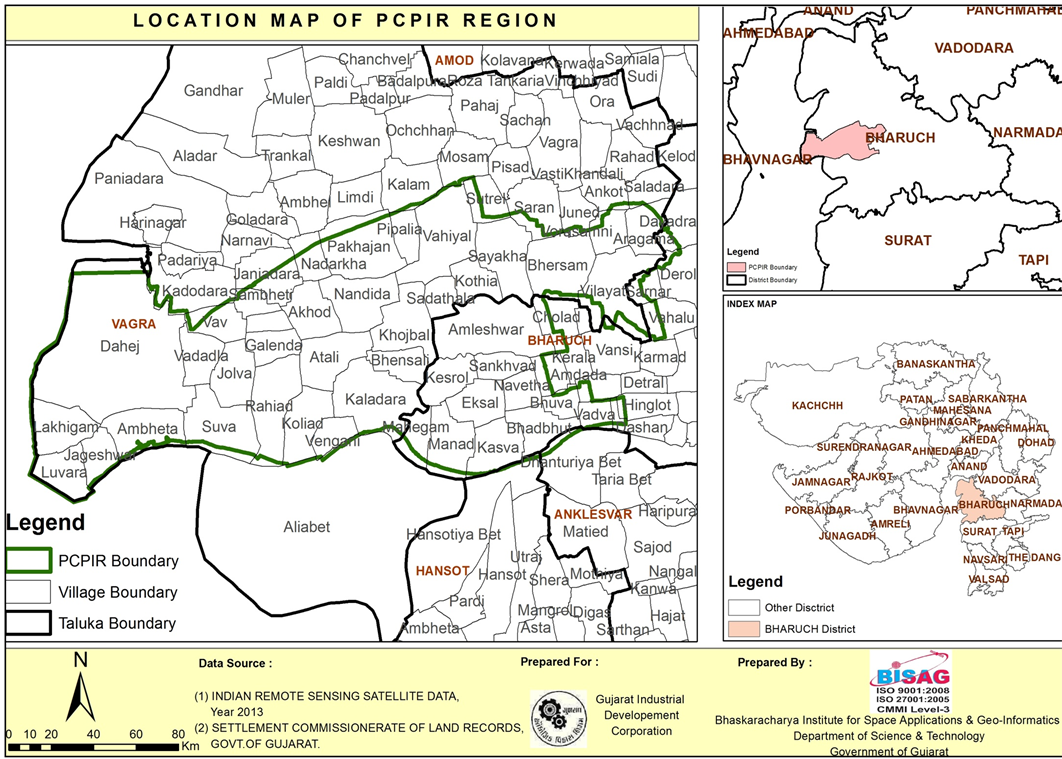
Figure 1. Location of PCPIR in Bharuch district, Gujarat State.
brought under cultivation with crops like millet, wheat, jowar, bajra and paddy etc. and other crops such as sugarcane, groundnut, pulses and cotton are also grown in the study area. The study area is covered with 7% irrigated land whereas forest land is only about 1% of the total land area. Soil characteristics indicate sand, silt and clay texture. Clay is the prominent textural class followed by sandy clay loam, in the impact zone. The pH of the soil is neutral to alkaline. The soluble salt content in all the soils is low <1 dS/m. In general, the soil samples in the study area have low to very high adsorption capacity as evident from the cation exchange capacity. Exchangeable sodium percentage (ESP) of the soil samples in the study area was raging from 4 to 10, which can be considered as satisfactory. Soils are poor to medium in terms of organic carbon content. The concentration of heavy metals found in the study area was normal. The infrastructure development PCPIR region includes road development, port development, rail links, desalination plants, setting up of LNG terminal etc. These are over and above the main project of refinery or feedstock. In fact the government of Gujarat is in the process of consultation with ministry of civil Aviation for development of airport in Ankleswar Industrial belt.
1.3. Remote Sensing and GIS Technology for Land Use Mapping
For monitoring the changes in land use pattern over the period of time, integrated geo-spatial technologies such as remote sensing (RS), Geographic Information System (GIS) and Global Positioning System (GPS) can contribute to assessing, understanding, and mapping utility and service facilities, as well as monitoring changes in environmental problems. By utilizing remote sensing data and implementing GIS mapping techniques, changes in land use pattern can be monitored and mapped for specific developmental projects. Creating linkages between remote sensing data and socio- economic data obtained from field surveys has been recognized as one of the major challenges of land use/land cover change studies by Rindfuss et al., 2004 [2] . Satellite remote sensing, with its repetitive coverage and multi-spectral capabilities, is a powerful tool for mapping and monitoring the emerging changes in land use and peripheral environments. The loss of agricultural land because of rapid urbanization has been detected using remote sensing techniques in some cities of India, such as Hyderabad, Madras, and Nagpur [4] .
Land use/land cover (LU/LC) changes were determined in an urban area, Tirupati, from 1976 to 2003 by using Geographical Information Systems (GIS) and remote sensing technology. The comparison of LU/LC in 1976 and 2003 derived from toposheet and satellite imagery interpretation indicates that there is a significant increase in built-up area, open forest, plantation, and other lands. It is also noted that substantial amount of agriculture land, water spread area, and dense forest area vanished during the period of study which may be due to rapid urbanization of the study area. No mining activities were found in the study area in 1976, but a small addition of mining land was found in 2003 [5] .
2. Objectives of the Study
The major objectives of this study on monitoring land use changes using Geo-infor- matics Technology are follows:
・ Preparation of data-base of various thematic layers like, land use/land cover, drainage, surface water bodies, settlements, road network and administrative boundaries in GIS environment of the PCPIR area.
・ Preparation of land use maps of three consecutive years of 2011, 2012 and 2013 indicating Level-III land use classes.
・ Monitoring changes in Land use during these three years in the PCPIR area in Bharuch District
・ Quantification of changes in land use pattern during 2011 to 2013 in the PCPIR area.
3. Methodology
The general methodology adopted for satellite data analysis and preparation of various thematic layers in GIS environment is as follows:
・ Digitization of base maps and geo-referencing with satellite digital data;
・ Creation of GIS database of various thematic layers in GIS environment;
・ Generation of GIS database for base maps, drainage, surface water bodies and land use/land cover, low-lying areas etc.;
・ Mapping of land use/land cover, using Indian Remote Sensing Satellite (IRS) LISS-III digital data and CARTOSAT data;
・ Monitoring the changes in the land use/land cover using multi-date high resolution IRS LISS-III data.
3.1. Satellite Data Used
In the present study, Indian Remote sensing Satellite (IRS) LISS-III (24 m resolution) and CARTOSAT-1 (2.5 m resolution) data covering the study area have been used for preparation of various thematic layers. The high resolution data of CARTOSAT-1 have been extensively used for base map preparation of settlement, transport network, drainage, water bodies, thematic interpretations such as land use/land cover etc. The details of Satellite data products are given in Table 1. Google image covering PCPIR area in Bharuch district was also used to study the land use pattern. The Google image covering PCPIR area in Bharuch district

Table 1. Indian Remote Sensing Satellite and CATROSAT-1 Data used for PCPIR area in Bharuch.
along with village boundaries is given in Figure 2. IRS LISS-III and CARTOSAT-1 images covering PCPIR area with village boundaries used in this study are given in Figure 3 & Figure 4.
3.2. Temperature and Rainfall Pattern in Bharuch District
The maximum temperatures in the area vary from about 30 to 38 degrees Celsius and the minimum is about 15 to 25 degrees Celsius. The maximum is normally in the month of May while the minimum is in the month of January. The monthly rainfall

Figure 2. Google image covering of PCPIR in Bharuch district, Gujarat State.
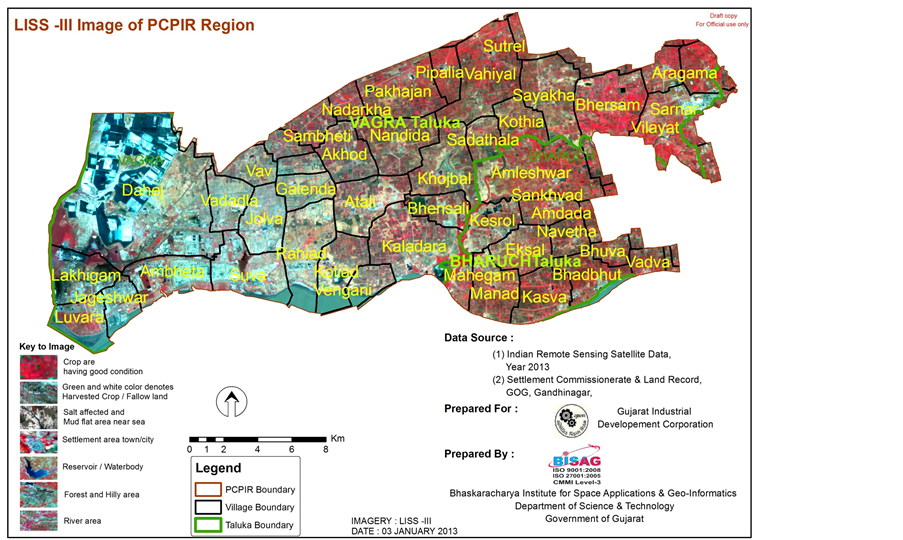
Figure 3. IRS LISS-III image covering of PCPIR in Bharuch district, Gujarat State.
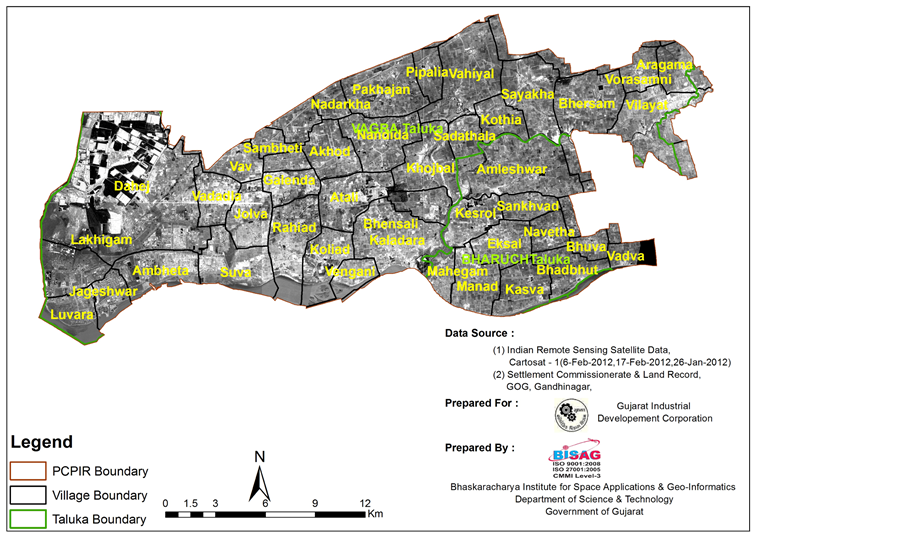
Figure 4. CARTOSAT-1 image covering of PCPIR in Bharuch district, Gujarat State.
data over 50 years in Bharuch district was analyzed and monthly averages were computed. The maximum monthly rainfall generally fall in the month of July and the monsoon is restricted to June to September. The average annual rainfall is about 1008 mm in the Bharuch district. The trend of Maximum Temperature, Minimum Temperature, and Average temperatures along with monthly average rainfall during different months in Bharuch district are given in Figure 5.
3.3. Mapping Procedure for Land Use Mapping and Monitoring
Indian Remote Sensing Satellite (IRS-P6) LISS-III, LISS-IV and CARTOSAT digital data covering PCPIR area in Bharuch district for the period of January & February of 2011, 2012 and 2013 was analyzed for land use/land cover mapping and monitoring the changes in land use during the period of three years in the PCPIR region. Mapping of various land use classes using Multi-date Satellite data consists of following procedural steps:
1) Multi-season data preparation and geo-referencing;
2) Superimposing of administrative (block/village) boundary;
3) Generation of spatial information in GIS environment;
4) Superimposing GPS locations of tree plantation sites collected during field visits on the registered LISS-IV and CARTOSAT-1 digital data;
5) Identification & onscreen delineation of land use classes on the image based on visual interpretation;
6) Generation of thematic maps showing various land use classes;
7) Quality checks and accuracy assessment using field information.
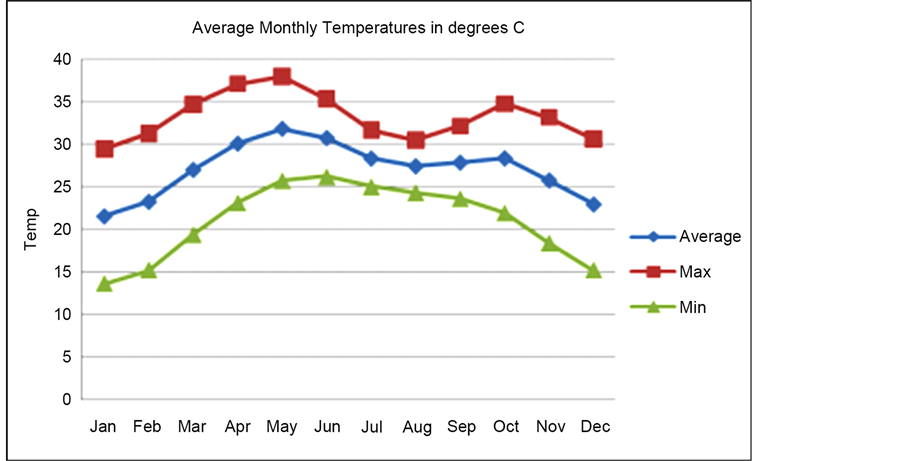
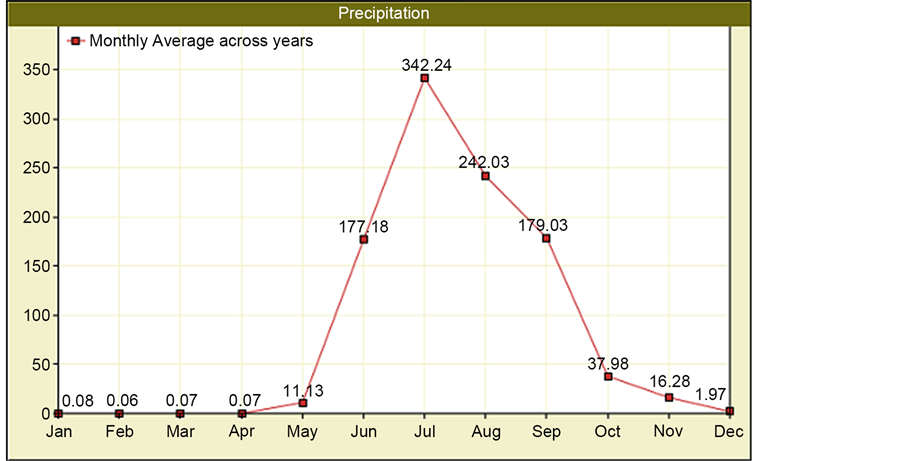
Figure 5. Monthly Average, Minimum, Maximum Temperatures and Average Rainfall in Bharuch.
Various thematic land use/land cover maps were prepared and GIS database for various thematic layers have been generated using satellite and ground based information.
4. Results and Discussion
4.1. Satellite Data Analysis
The IRS LISS-III and CARTOSAT-1 data was geometrically corrected and area of interest i.e. area covering PCPIR area in Bharuch district was extracted for further analysis. The administrative boundaries like taluka, village and PCPIR boundaries were superimposed on the satellite data. The ERDAS Imagine image processing software was used for analysis of various images for land use/land cover classification. The land cover classes observed on satellite data were identified into various level-3 classes. IRS LISS-III digital data was classified for generation of current land use/land cover map of the study area. For detailed mapping of land use/land cover with Level-3 classes, high resolution CARTOSAT-1 digital data was analyzed. The CARTOSAT-1 digital data covering PCPIR area of 2011, 2012 and 2013 was analyzed and changes in land use was studied by computing area statistics under each class during the last three years.
4.2. Land Use/Land Cover Mapping of the Study Area
The land cover classes in the PCPIR region were identified into various broad classes namely, crop land, plantations, salt affected land, scrub land, water bodies, habitations, industrial area etc. These classes were delineated on the IRS LISS-III data set of 2011, 2012 and 2013 covering the PCPIR are in Bharuch district. The area under different classes during 2011, 2012 and 2013 was also computed and depicted as pie-chart indicating area in percentages. The Land use /land cover maps of PCPIR area for 2011, 2012 and 2013 along with area statistics are given in Figure 6, Figure 7 and Figure 8, respectively.
The comparative analysis of land use/land cover changes during last three years from 2011 to 2013 in the PCPIR area was carried out using these land use/land cover maps and the changes in land use/land cover during these three years were computed.
4.3. Land Use/land Cover Pattern Analysis
The land use analysis indicates that the major land use in the PCPIR area is agriculture

Figure 6. Land use/land cover Map of 2011 covering PCPIR area in Bharuch.
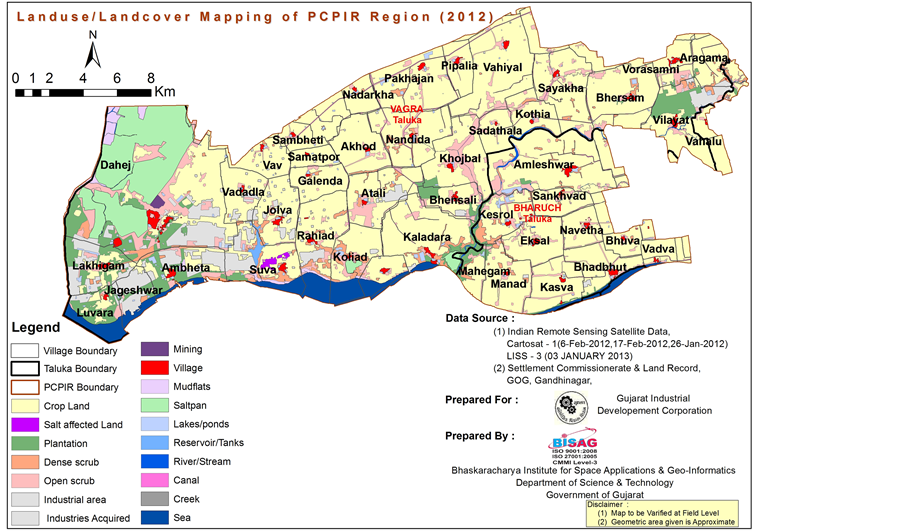
Figure 7. Land use/land cover Map of 2012 covering PCPIR area in Bharuch.

Figure 8. Land use/land cover Map of 2013 covering PCPIR area in Bharuch.
with crop lands ranging from 61 to 63 per cent of the total area. The area under various land use classes from the land use maps prepared from Satellite data was computed in the GIS environment. The area under various land use classes in PCPIR area during 2011, 2012 and 2013 is given in Table 2. The trends of land use/land cover change during
Table 2. Area estimates from Satellite data under various land use classes during 2011, 2012 and 2013 in the PCPIR area.
last three years from 2011 to 2013 indicate that there are marginal changes in some of the land use classes in the PCPIR area. However, the trend in land use changes in various classes between 2011 and 2013 are varied for each class, depending upon its use for various developmental purposes.
4.4. Land Use/Land Cover Change Analysis
・ The change in land use/land cover classes derived from the mapping of high resolution satellite data were plotted in the graph given in Figure 9. Comparing the land use statistics of three years, the results indicate that there is marginal decrease in the crop land area in the PCPIR region. Crop land has decreased from 64.7% during 2011 to 62.7% during 2013.
・ The specific example of decrease in crop land is near the Ambheta and Suva villages where Cartosat-1 image of 2011 (Figure 10) shows the crop land, where industrial units have been developed during the 2013 period (Figure 11). The transformation of agricultural land into the industrial development is major reason for marginal decrease in the agricultural land in the PCPIR region. The comparison of Figure 10 and Figure 11 clearly brings out the increase in industrial development in the agricultural area during 2013 period.
・ At the same time area under plantations in PCPIR area has also decreased from 5.5% during 2011 to 5.2% during 2012 and 5.4% during 2013. The noticeable change in plantation is in the village Vilayat in the Eastern portion of PCPIR area. Here, half the area under plantation has been cleared for industrial development. Cartosat-1 image of 2011 (Figure 12) covering area near Vilayat village shows that the area has good plantation. However, during 2013 period the half of the plantation has been cleared for industrial development. Cartosat-1 image of 2013 (Figure 13) covering area near Vilayat village shows the industrial development in the area.
・ The industrial area has increased from 6.0% to 7.6% of the total area of the PCPIR region. The total built-up area (industries & village area) has increased from 7.1% during 2011 to 8.7% during 2013. This may be at the cost of decrease in the plantation and agricultural area.
・ It is observed from the satellite data that in the coastal area of the Suva village, salt affected area has increased during 2012 and 2013 may be due to the ingress of sea water in the fertile agricultural land.
・ In general, the land use/land cover change is not significant in the PCPIR area; however, there is urgent need to increase the area under green cover of plantations by appropriately utilizing wasteland for plantations.
4.5. Land Cover and Environmental Monitoring for Improvement in Green Cover
The area proposed to be used for PCPIR has already been declared industrial area.
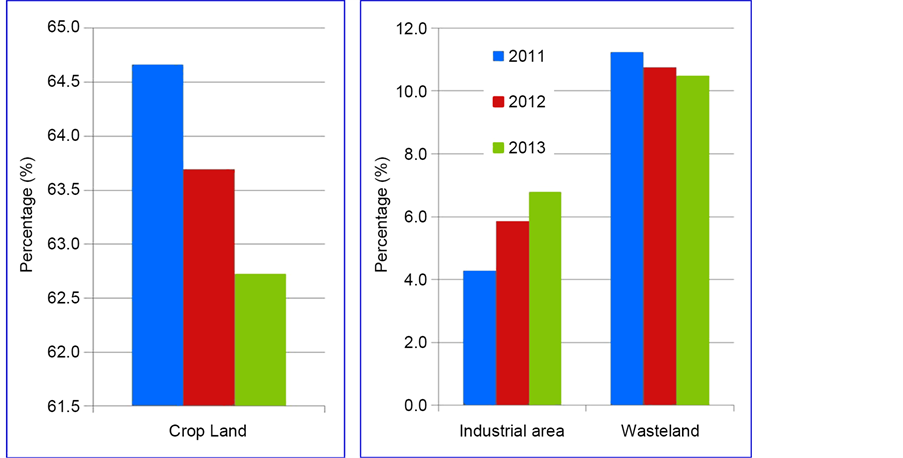
Figure 9. Land use/land cover changes during 2011 to 2013 in PCPIR area in Bharuch district.

Figure 10. Cartosat-1 image of part of PCPIR showing crop land near Ambheta & Suva villages.

Figure 11. Cartosat-1 image of part of PCPIR showing Industrial development near Ambheta & Suva villages.
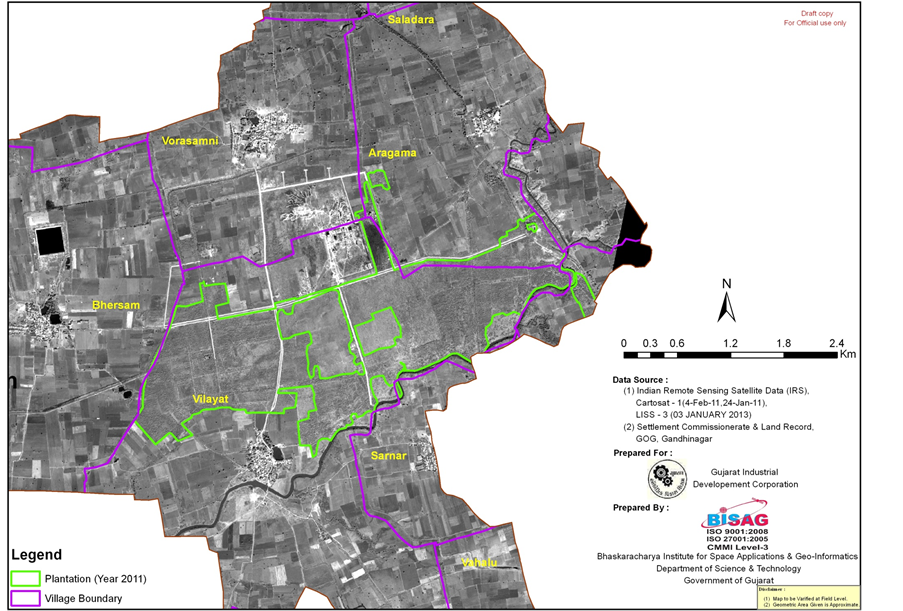
Figure 12. Cartosat-1 image of part of PCPIR showing plantations near Vilayat Village.
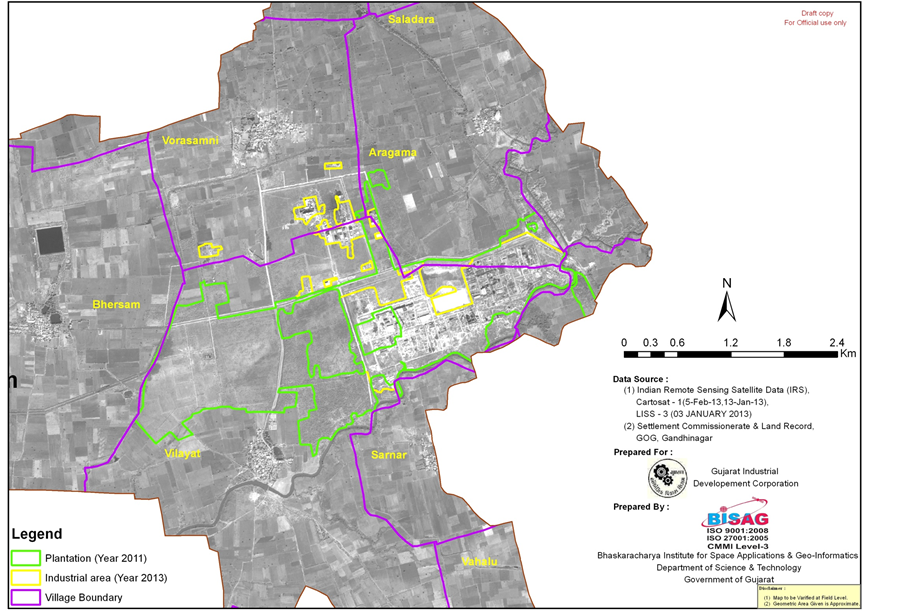
Figure 13. Cartosat-1 image of part of PCPIR showing plantations cleared for Industries.
Plantation of trees as per MoEF and GPCB norms needs be undertaken in all the available wastelands in the PCPIR area. Based on these recommendations GIDC has undertaken massive plantation drive in the PCPIR area during 2013 and 2014. Some of the areas where tree plantation has been carried out by the GIDC are shown in the map given in Figure 14. The total area covered under the plantation is around 42 ha. The field visit was also carried out to verify areas under tree plantations and as well as to monitor the growth of tree cover in the newly plantation areas. The trees suitable for this region like neem, etc were planted to increase the green-cover in the PCPIR area.
5. Conclusions
In the present study, detailed investigations have been carried out in Petroleum, Chemicals and Petrochemical Investment Region (PCPIR) area in Vygra and Bharuch Talukas in Bharuch district of Gujarat State using Indian Remote Sensing satellite digital data. The changes in land use/land cover PCPIR area have monitored using the multi- date IRS LISS-III and Cartosat-1 data of 2011, 2012 and 2013 periods. Various thematic land use/land cover maps were prepared and GIS database for various thematic layers have been generated using satellite and ground based information.
The major conclusions of this study area as follows:
・ The land use analysis indicates that the major land use in the PCPIR area is agriculture with crop land ranging from 61 to 63 per cent of the total area.
・ The area under various land use classes from the land use maps prepared from Satellite data of 2011, 2012 and 2013 was computed in the GIS environment.
・ The results indicate that crop land area has decreased from 64.7% during 2011 to

Figure 14. Tree plantation carried out by the GIDC in PCPIR Region.
62.7% during 2013 in the PCPIR region. The transformation of agricultural land into the industrial development is major reason for marginal decrease in the agricultural land in the PCPIR region.
・ Area under plantations in PCPIR area has also decreased from 5.5% during 2011 to 5.2% during 2012 and 5.4% during 2013. The noticeable change in plantation is in the village Vilayat in the Eastern portion of PCPIR area. Here, half the area under plantation has been cleared for industrial development.
・ The industrial area has increased from 6.0% to 7.6% of the total area of the PCPIR region. The total built-up area (industries & village area) has increased from 7.1% during 2011 to 8.7% during 2013. This may be at the cost of decrease in the plantation and agricultural area.
・ To improve the green cover in the PCPIR area plantation of trees as per MoEF and GPCB guidelines have been undertaken by GIDC in the available wastelands. The total area under tree plantations carried out in this area till 2014 is around 42 ha. (Based on Satellite image interpretation carried out at BISAG, which excludes tree plantation along the road and SWD).
・ As per GIDC record total 2.32 lakh trees have been planted till month of December- 2014. Moreover another 2.5 lakh trees are proposed to be planted in FY 2015-16 in Dahej PCPIR area.
Acknowledgements
The authors express their sincere thanks to Shri T. P. Singh, Director, Bhaskarcharya Institute for Space Applications and Geo-informatics (BISAG), Department of Science & Technology, Government of Gujarat, Gandhinagar for his encouragement and guidance to conduct this study.
Cite this paper
Patel, A.N., Singh, V., Kansara, B., Kalubarme, M.H. and Panchal, B. (2016) Monitoring Land Use and Infrastructure Changes in Industrial Complex Using Geo-Informatics Technology in Gujarat State, India. International Journal of Geosciences, 7, 1283-1298. http://dx.doi.org/10.4236/ijg.2016.710093
References
- 1. CSIR-National Environmental Engineering Research Institute, Nehru Marg, Nagpur (2014) Comprehensive Environmental Impact and Risk Assessment Studies for Proposed Petroleum, Chemical and Petrochemical Investment Region, Dahej-Vagra, Dist. Bharuch. Sponsored by Gujarat Industrial Development Corporation (GIDC), Udyog Bhavan, Gandhinagar (Gujarat), 1-783.
- 2. Rindfuss, R.R., Walsh, S.J., Turner, B.L., Fox, J. and Mishra, V. (2004) Developing a Science of Land Change: Challenges and Methodological Issues. Proceedings of the National Academy of Sciences of the United States of America, 101, 13976-13981.
http://dx.doi.org/10.1073/pnas.0401545101 - 3. Lambin, E.F. and Geist, H.J. (Eds.) (2006) Land-Use and Land-Cover Change: Local Processes and Global Impacts.
- 4. NRSA (1994) Mapping and Monitoring Urban Sprawl of Hyderabad. Project Report, National Remote Sensing Agency, Balanagar, Hyderabad, 1-85.
- 5. Mallupattu, P.K. and Reddy, J.R.S. (2013) Analysis of Land Use/Land Cover Changes Using Remote Sensing Data and GIS at an Urban Area, Tirupati, India. The Scientific World Journal, 2013, Article ID 268623.
http://dx.doi.org/10.1155/2013/268623