International Journal of Geosciences
Vol.06 No.03(2015), Article ID:54989,17 pages
10.4236/ijg.2015.63020
Fluid Inclusion Petrography and Microthermometry of Zn and Pb Deposits of Rajpura-Dariba Bethumni Belt, Udaipur District (Rajasthan), India
Juned Alam*, Farhat Nasim Siddiquie
Department of Geology, Aligarh Muslim University, Aligarh, India
Email: *juned.iit87@gmail.com
Copyright © 2015 by authors and Scientific Research Publishing Inc.
This work is licensed under the Creative Commons Attribution International License (CC BY).
http://creativecommons.org/licenses/by/4.0/


Received 25 February 2015; accepted 20 March 2015; published 25 March 2015
ABSTRACT
The Proterozoic Aravalli-Delhi orogenic complex hosts a large number of economically important stratabound base metal sulphide deposits. In the present work, rock samples taken from Outcrop and Underground Mine of Sindeskar Kalan, Vedanta Group, Rajpura Dariba-Bethumni Belt which is located at a distance of 76 kms from Udaipur city, Rajasthan have been studied. The chief litho units of the group which contain sulfide-bearing calc-silicate and graphite mica schist, dolomite marble, calc-biotite schist and quartzite are identified. An attempt has also been made to study/or hydrothermal in origin in the different types of fluid inclusions, hosted predominately in Geothermometry viz. heating and freezing study of entrapped palaeo-fluids (such as sedimentary and quartz host grain and a few in sphalerites). The quartz hosts are identified with four types of fluid inclusions, such as 1) monophase (gas/vapour), 2) gas-rich biphase, 3) liquid-rich biphase and 4) polyphase types. The primary types of fluid inclusions show that melting temperature of ice or depression freezing point (DFP) (ranging from −2.5˚C to −7.2˚C)/(salinity ranging from 4.5 - 13.25 wt% NaCl eq.) and temperature of homogenization into liquid phase (ranging from +188˚C to +218˚C) have been measured. Data from the fluid inclusions and salinity calculation (low salinity) reveal that rate of cooling is the important mechanism of ore deposition in the study area.
Keywords:
Sphalerite, Quartz, Fluid Inclusions Petrography and Microthermometry, Rajpura Dariba-Bethumni Belt, Rajasthan

1. Introduction
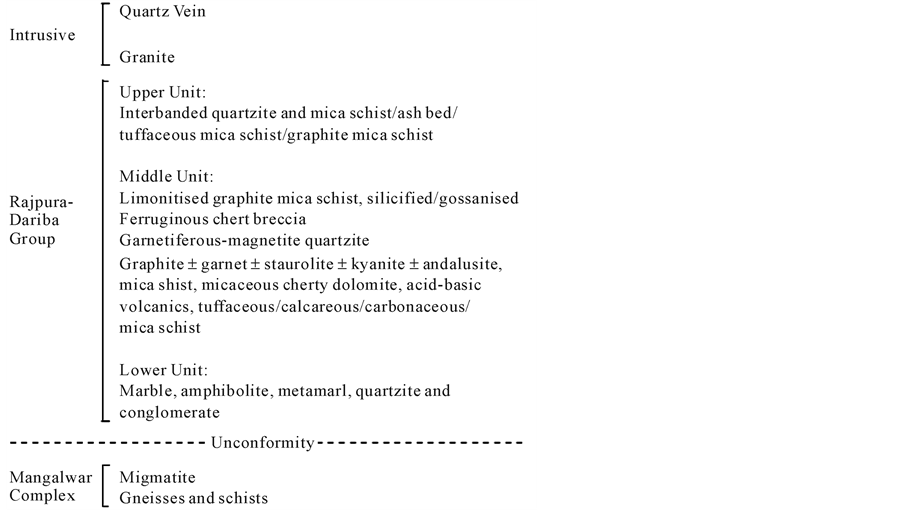
The Aravalli province, which is located in the state of Rajasthan, India, constitutes the most important metallogenic province for base-metal deposits [1] in India and hosts the entire economically-viable lead-zinc resource- base of the country. The Pb-Zn mineralization in the Udaipur-Zawarmala deposit provides an excellent opportunity to study, the complex nature of carbonate-hosted Proterozoic Pb-Zn mineralization because it contains both stratiform as well as discordant vein and massive ore shoots in close association [2] . The Archaean basement comprising of gneiss, schist, amphibolite, quartzite and granite dating back to 3.2 to 2.5 by showing unconformable relationship with the Aravalli cover rocks, is clearly marked in and around Udaipur. Stratigraphic succession established by [3] for the Aravalli Supergroup of the type area around Udaipur and Zawar shows two major groups separated by an unconformity. The Upper Aravalli Group consists of greywacke-slate-phyllite, quartzite, dolomite and silty arenite (host for sulphides of zinc and lead) while carbonaceous and pelitic phyllites, dolomite, quartzite, stromatolyte, phosphorite, chlorite schist, amphibolite, quartz arenite and local conglomerate [4] belong to Lower Aravalli Group.
In general, Aravalli rocks in Udaipur-Zawar region show a low-grade metamorphism. The recrystallisation of the silicate minerals suggests the grade of metamorphism to be of greenschist facies [5] . The present structural disposition of Udaipur-Zawar area is the manifestation of two distinct major periods of tectonic cycles [6] , each of which is characterized by intense folding and faulting.
The province is characterized by an Archaean basement overlain by thick successions of intensely deformed and metamorphosed volcanic and sedimentary rocks [7] . Eastern parts of the province comprise flat and largely soil-covered peneplains occupied by Archaean basement rocks. Central parts of the province comprise the NNE-SSW trending and 700-km-long Aravalli Mountain Chain, which is composed of Palaeo- to Meso-Prote- rozoic metavolcano-sedimentary rocks. Western parts of the province blend into the Great Thar Desert and are occupied by Neo-Proterozoic magmatic rocks [8] .
2. Geology
The geology of Rajasthan has been studied by many experts over decades and the different major geological units and prominent faults and lineaments of this region. The crust of the northwestern Indian Craton in Rajasthan comprises the Achaean Banded Gneissic Complex (BGC) forming the basement, overlain by the Proterozoic Delhi Aravalli Fold Belts of Delhi and Malani Igneous Suite, most of which are covered by the Tertiary and Quaternary sediments. Studies by [9] have provided constraints on the ages of the pre-Aravalli basement rocks. Detailed geological mapping by [10] suggests a wide variation in the spatial and temporal evolution of the region through different geodynamic processes.
The Aravalli mountain range in the northwest part of India extends over 700 km in length with a general NE-SW trend (Figure 1). It consists of two main Proterozoic sedimentary and volcano sedimentary successions, the Aravalli Supergroup and the Delhi Supergroup, respectively, which are bounded by the Great Boundary Fault to the east and the Western Marginal Fault to the west. These Proterozoic successions rest unconformably on Archean granitoid basement [11] , commonly referred to as Banded Gneissic Complex/BGC [12] . The minimum age of the basement rocks is 2500 Ma [13] . The Aravalli Supergroup, a sedimentary succession with minor volcanic flows near the base, developed as a cover sequence on the granitoid basement [11] , the BGC of [12] . The existing geochronological data for the Aravalli Supergroup are insufficient to precisely date the opening and closure of the Aravalli Basin. However, the maximum age of the Aravalli Supergroup comes from the Sm-Nd systematics of the basal volcanic indicating 2326 ± 321 Ma and the minimum age is considered to be 1900 ± 80 Ma from the Rb-Sr dating of Darwar Granite that was emplaced synkinematically with the earliest deformation of the Aravalli sediments [14] .
General stratigraphy of the study area [15] .
3. Material and Methods
A total of 50 samples were collected from the different Levels of underground mine as well as outcrop samples from the selected mine (both of ores and rocks) of the study area, out of which fresher and unweathered samples were selected for fluid inclusion petrography and its microthermometry. Petrographic studies of the polished section and doubly polished thin sections of quartz and sphalerite were carried out under transmitted and reflected light respectively.
The micro thermometric studies were performed by using a Chaixmeca stage fitted on a Leitz Laborlux microscope. The main purpose of micro thermometric study was to observe and record the different phase transitions within the fluid inclusions in response to temperature changes.
4. Fluid inclusion Petrography
Quartz and sphalerite samples were initially examined but because the fluid inclusion population in sphalerite samples was far too low for any meaningful study, the work was restricted to samples of quartz.
4.1. Fluid Inclusions Study of Quartz
4.1.1. Primary Fluid Inclusions
1) Monophase Fluid Inclusions
The monophase fluid inclusions have only one phase at room temperature [17] . Primary monophase fluid inclusions appear dark under the microscope or have a clear appearance with a dark periphery if they got natural decrepitated. The Primary monophase fluid inclusions are fewer in number compared to the primary biphase inclusions.
2) Biphase Fluid Inclusions
The biphase fluid inclusions have two phases at room temperature. The Primary biphase fluid inclusions appear to have a vapour phase ( Plate 1 ) (represented by a bubble inside the inclusion) and a liquid phase under the microscope and vice versa. The bubble phase generally observed to have a dark periphery. The biphase fluid inclusions are very wide in shapes and sizes (Table 1). The majority of biphase fluid inclusions are shown in (Figure 2).
3) Multiphase Fluid Inclusions
The multiphase fluid inclusions have more than two phases at room temperature. The Multiphase fluid inclusions have variable shape and size. Some of multiphase fluid inclusions have daughter crystal of halite, sylvite,
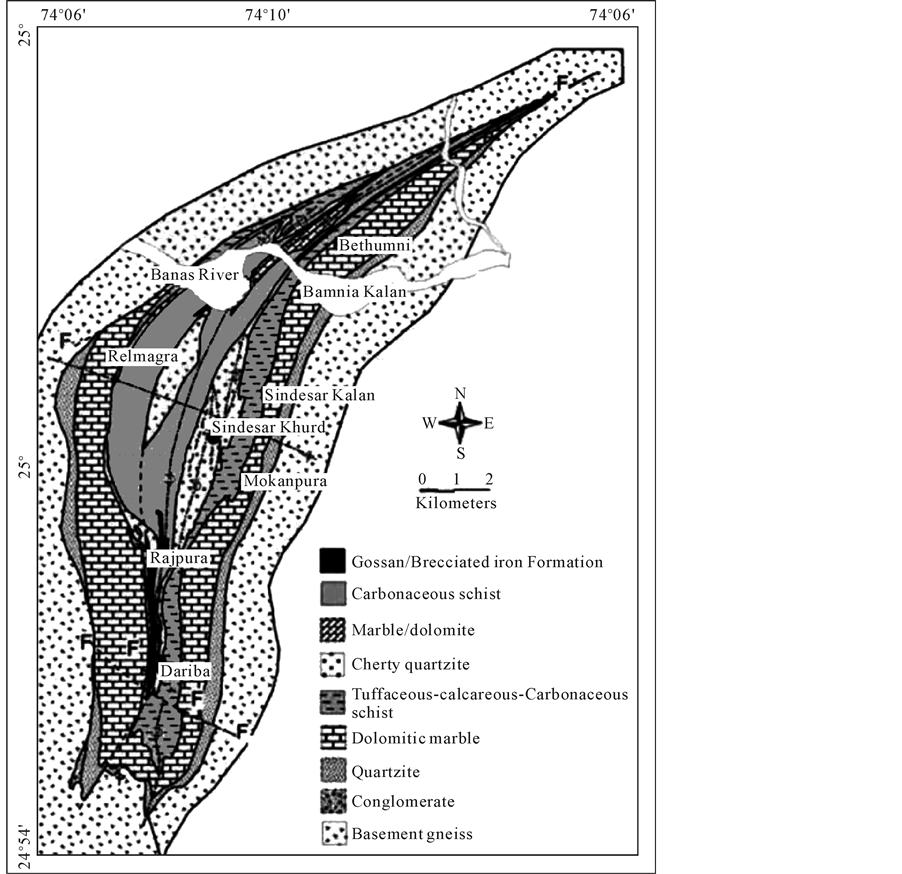
Figure 1. Geological map of Rajpura-Dariba-Bethumbi Belt [16] .
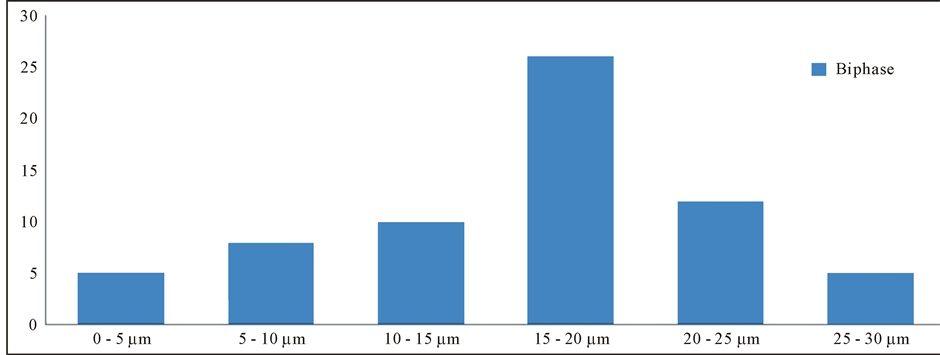
Figure 2. Histogram showing primary biphase fluid inclusions.

Plate 1. Photomicrographs showing―(a) and (b) Conoscopics and Orthoscopics view of the liquid rich polyphase fluid inclusion. (c) and (d) Conoscopics and Orthoscopics view of the liquid rich polyphase fluid inclusion. (e) and (f) Orthoscopics and Conoscopics view of the liquid rich biphase fluid inclusion. Rajpura-Dariba Belt, Uaipur (Rajasthan).

Table 1. Showing different properties of fluid inclusions.
anhydrite [18] , etc. The majority of multiphase fluid inclusions are shown in (Figure 3).
4) Biphase and Polyphase Fluid inclusions
Biphase fluid inclusions have two phases at room temperature. The Primary biphase fluid inclusions appear to have a vapor phase (represented by a bubble inside the inclusion) and a liquid phase under the microscope ( Plate 2 ) and vice versa. The bubble phase generally observed to have a dark periphery. The biphase fluid inclusions are very wide in shapes and sizes (Table 1). The population of biphase and multiphase fluid inclusions ( Plate 3 ) is shown by the histogram (Figure 4).
4.1.2. Secondary Fluid Inclusions
Secondary fluid inclusions are those which are developed due to the filling by the later fluids along the fractures initiated during the mechanical and thermal stress on the early formed crystal. They give us information on the nature of fluids that have interacted with the minerals after their formation [19] . They usually occur as:
・ Planar groups, outlining healed fractures ( Plate 4 ).
・ Thin, flat nature and small in size ( Plate 4 ).
4.2. Fluid Inclusions Stratigraphy
Touret [20] established a technique for basic cross cutting-relationship ( Plate 5 ) which gives the relative timing of entrapment of secondary fluid inclusions. Array of secondary fluid inclusions that formed in healed fractures ( Plate 6 ) indicate about the number of phases of generation of fluid inclusions and also correlate the younger and older sequences.
4.3. Pseudo-Brownian Motion of Fluid Inclusions
Sang [21] reported peculiar movement of bubble ( Plate 7 ) in same inclusion where thermal gradient was established across the inclusions. Some bubble moves ups a thermal gradient i.e. they appears to be attracted to warm probe and move through the fluid as the inclusion shape would permit. Other bubble either moves down a thermal gradient i.e. they appeared to be attracted by cooled probe and repelled by warm move, or they did not move at all in a thermal gradient even though were apparently free from the wall. The basis for all these phenomena
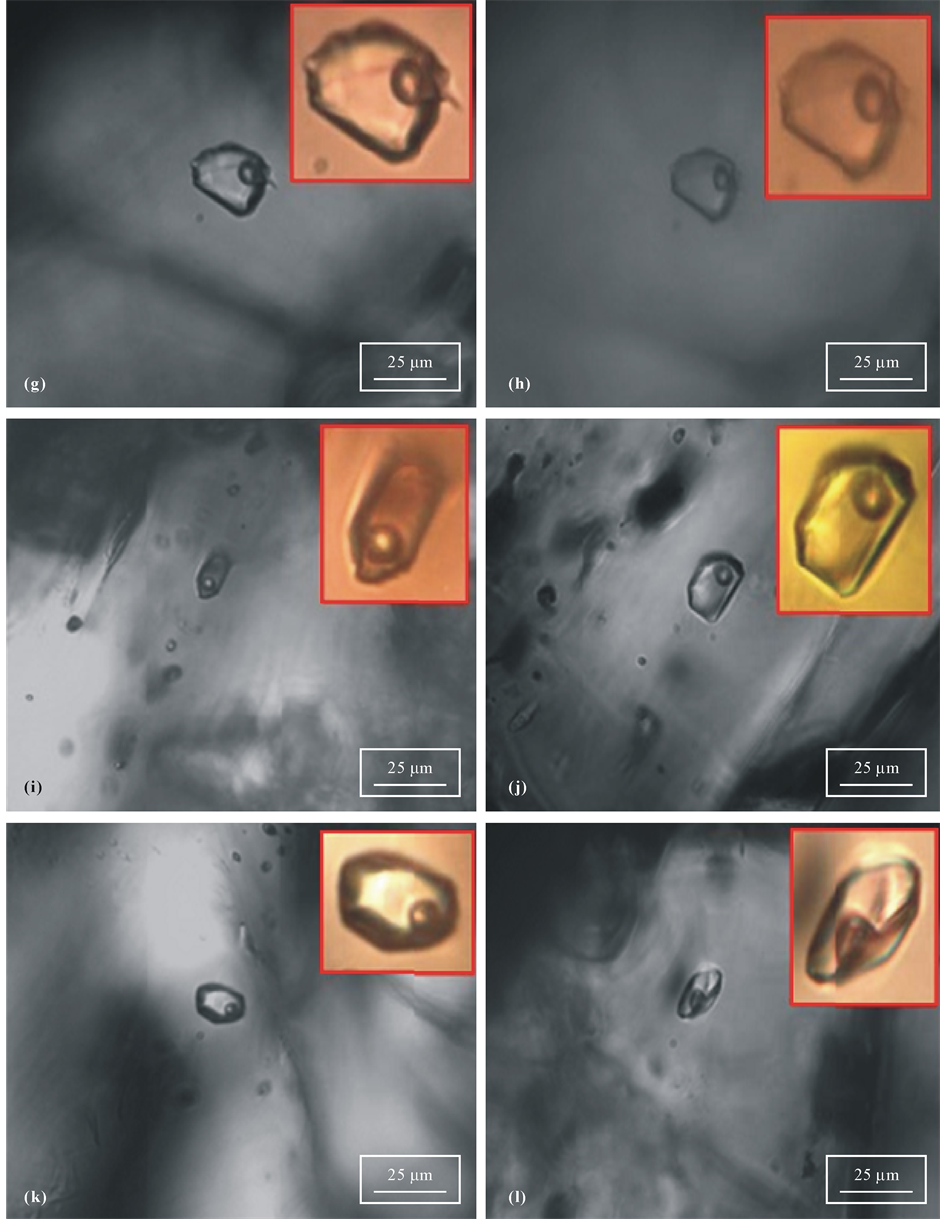
Plate 2. Photomicrographs showing―(g) and (h) Conoscopics view of the liquid rich polyphase fluid inclusion in different light focus. (i) and (j) Orthoscopics view of the liquid rich biphase fluid inclusion show negative crystal cavity. (k) and (l) Orthoscopics view of the liquid rich biphase fluid inclusion show negative crystal cavity. Rajpura-Dariba Belt, Uaipur (Rajasthan).
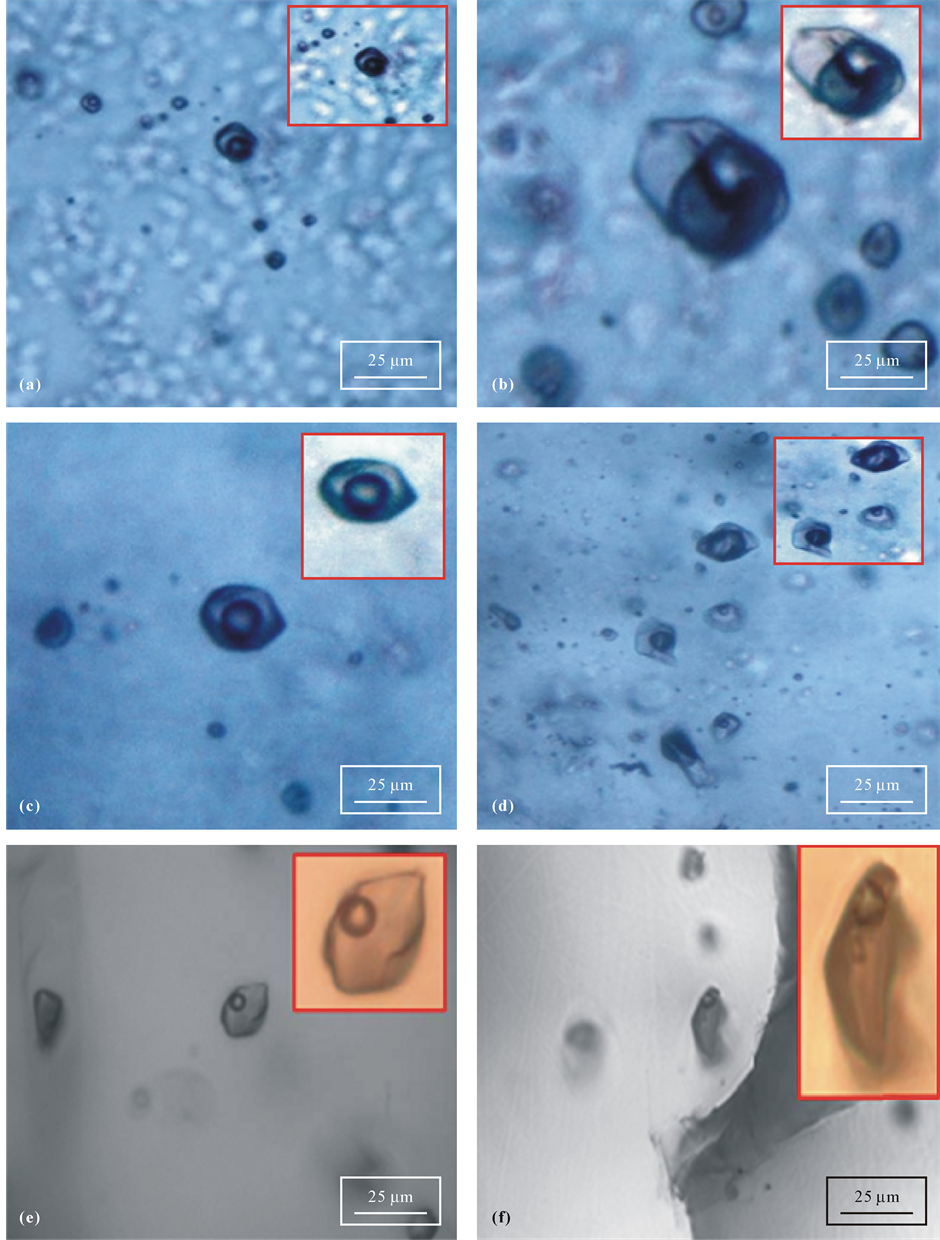
Plate 3. Photomicrographs showing―(a) and (c) Orthoscopics and conoscopic view of the liquid rich multiphase fluid inclusion. (b) and (e) Orthoscopic and Conoscopics view of the liquid rich multiphase fluid inclusion. (d) Multiphase inclusion, CO2 gas bubble may present (f) Trapped crystal along fracture plane. Rajpura-Dariba Belt, Uaipur (Rajasthan).
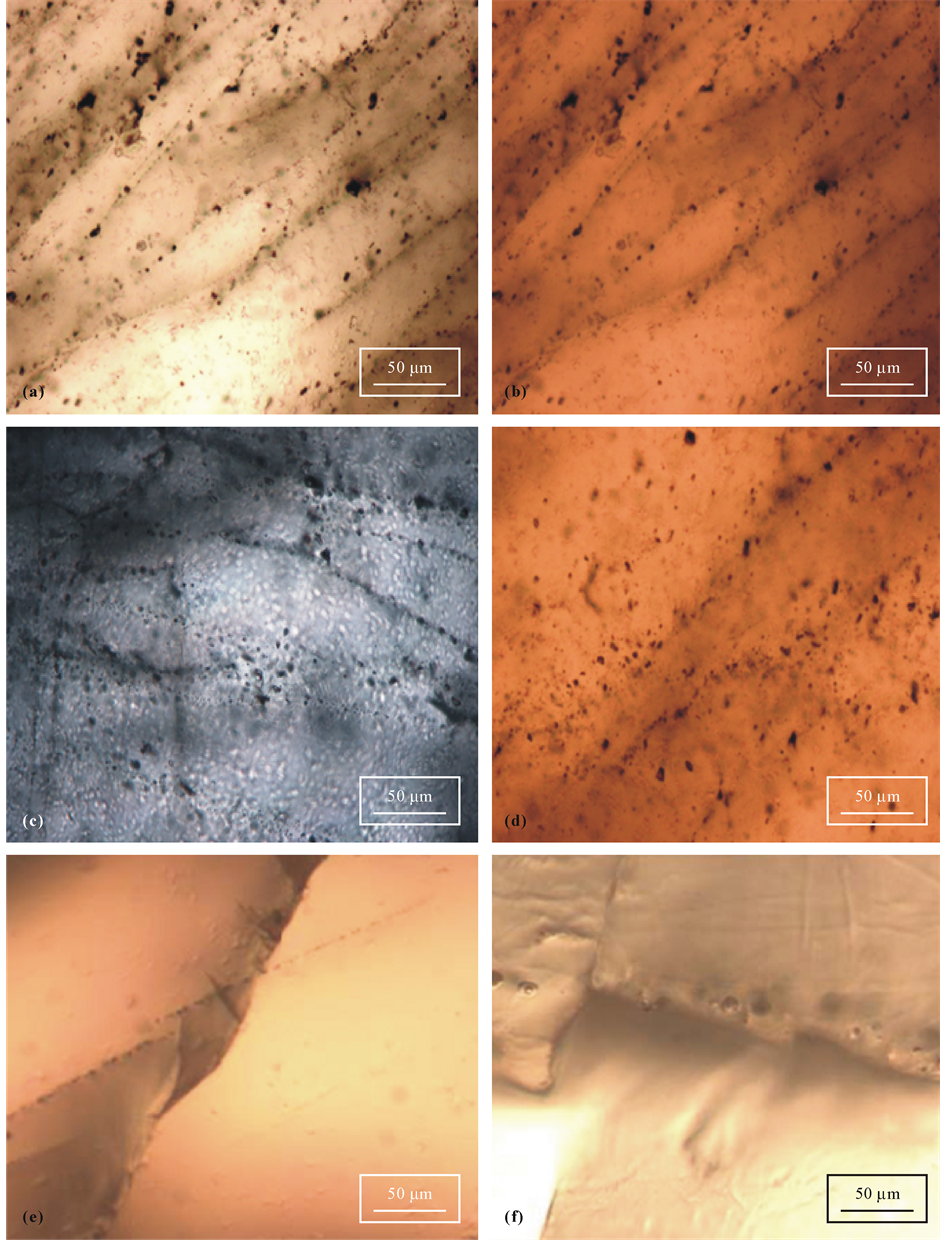
Plate 4. Photomicrographs showing secondary fluid inclusion. (a) and (b) Trails of secondary biphase fluid inclusion along the rehealed fracture zone. (c) and (d) Trails of secondary biphase fluid inclusions along the growth zone. (e) and (f) Trails of secondary biphase fluid inclusions which cross grain boundary.
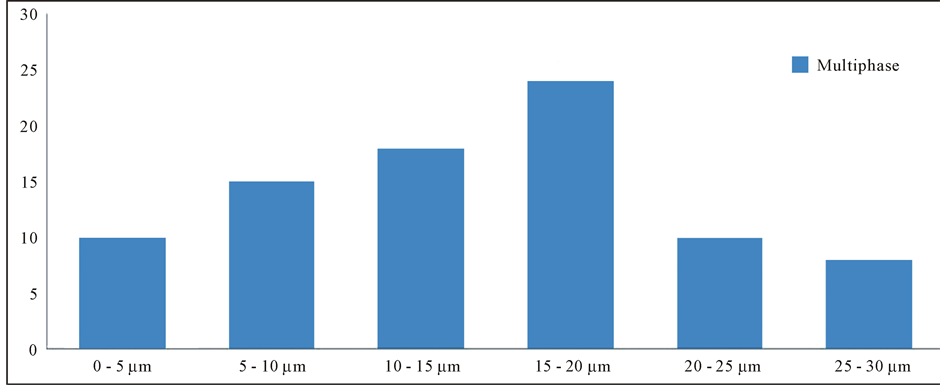
Figure 3. Histogram showing primary multiphase fluid inclusions.
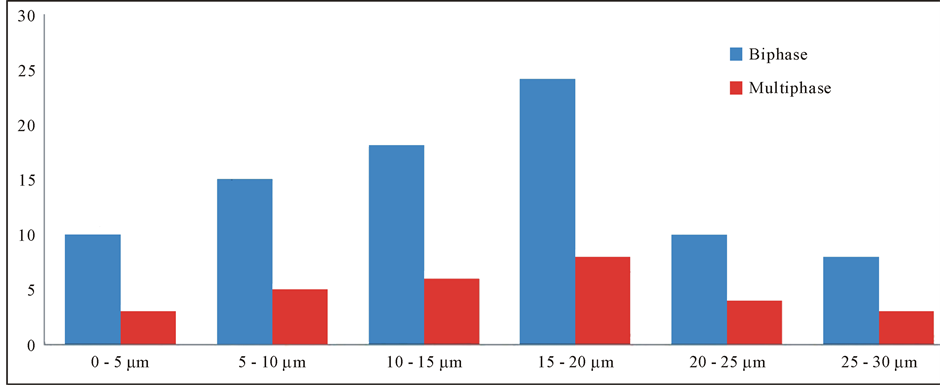
Figure 4. Histogram showing primary bi-multiphase fluid inclusions.
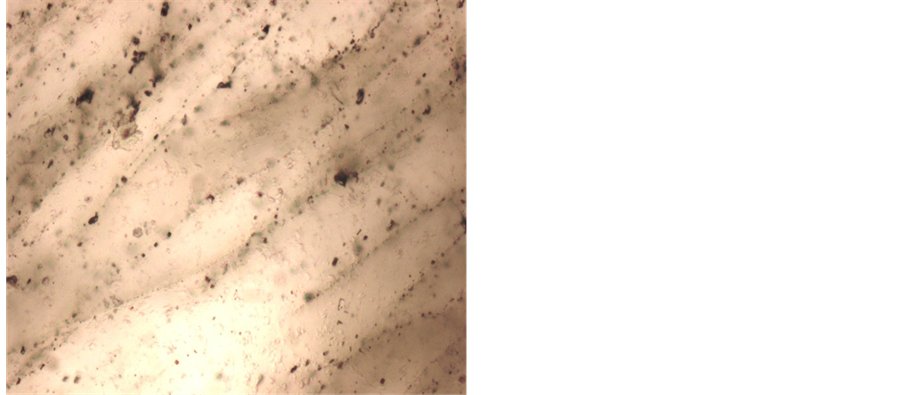
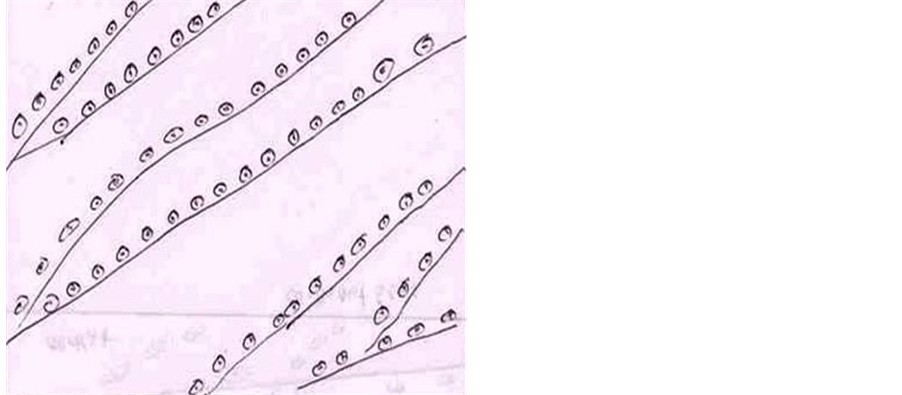
Plate 5. Sets of parallel trails of biphase secondary fluid inclusions cutting by fractures.
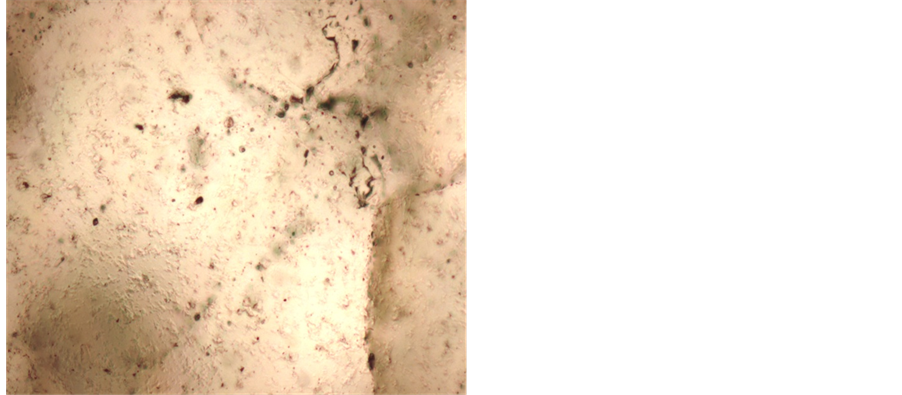
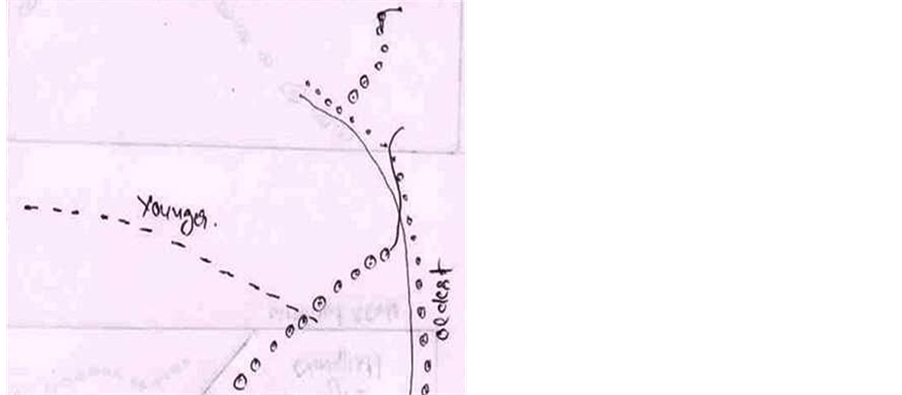
Plate 6. Trails of biphase secondary fluid Inclusions cutting across the fracture within the grain.
appear to be variations in surface tension from temperature differences over the bubble surfaces, causing flow of the surface that drag fluid with it. The motions are useful in inclusions studies in various ways.
1) Motion of fluid depends on composition and viscosity of fluid, so viscosity of fluid may determined.
2) The phenomena determine the freezing temperature of those inclusions in which the last ice crystal sticks to the bubble liquid interfaces.
3) The thermal gradient may use to discriminate between glass and liquid inclusion.
5. Micro-Thermometry
5.1. Introduction
Micro thermometry analysis is the most popular and widely used non-destructive analytical technique [22] . The micro thermometric studies (Figure 5) were performed by using a Chaixmeca stage fitted on a Leitz Laborlux microscope. The main purpose of micro thermometric study was to observe and record the different phase transitions (Table 2, Table 3 and Table 4) within the fluid inclusions in response to temperature changes.
5.2. Salinity Determination from Micro Thermometric Data
Salinity determinations of fluid inclusions are down by using the freezing point of the water in aqueous biphase inclusions and clathrate dissociation temperature in CO2 containing fluid inclusions. Bodnar [23] presented an equation relating to the freezing point depression to the salinity of the H2O-NaCl inclusions. The equation is represented as:

where Ѳ = Freezing point depression (DFP) in ˚C.
Salinity of the CO2 containing fluid inclusions are not calculated by the above equation because in the H2O- CO2-NaCl system clathrate melting temperature is a function of salinity.
5.3. Micro Thermometry Analysis of Biphase Liquid Rich Fluid Inclusion
Micro thermometric studies carried on primary biphase fluid inclusions presents in the quartz. The primary biphase fluid inclusions freeze around −93.7˚C to −97.4˚C (Table 2, Table 3 and Table 4) with sudden disappearances of gas/vapor bubble and the final ice melting temperature is recorded around −2.4˚C to −7.2˚C. The homogenization temperature of the inclusion is around 188˚C - 218˚C and homogenization into the liquid state by vapor disappearance (L + V ® L). The sequences of flowchart of the photographs are showing in the (Figure 6 and Figure 7).
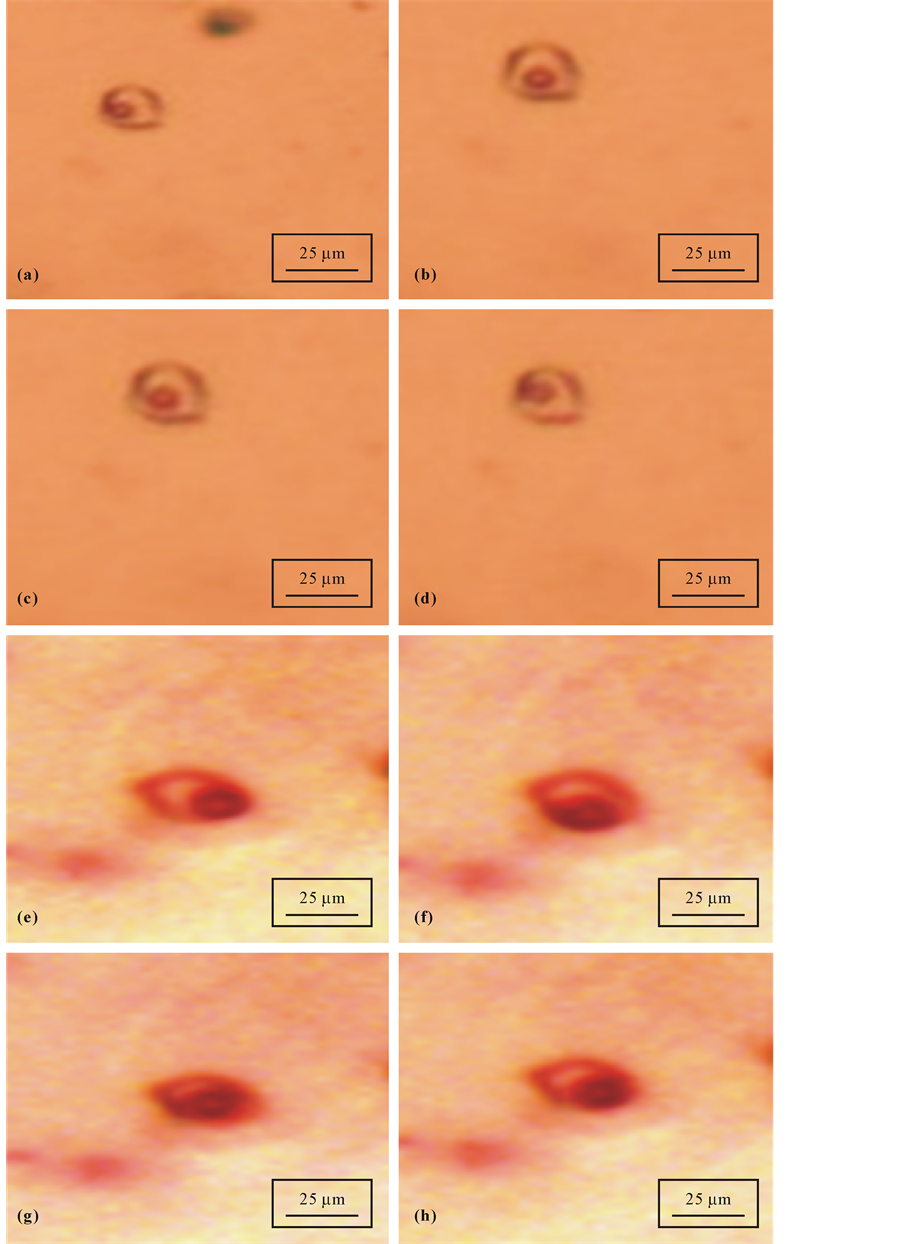
Plate 7. Microphotographs (a) to (d) showing false brownian motions of biphase fluid inclusions (smple no 1 of level 315, (e) to (h) showing false brownian motions of biphase fluid inclusions (smple no 2 of level 350. Host mineral quartz. Rajpura-Dariba Belt, Uaipur (Rajasthan).
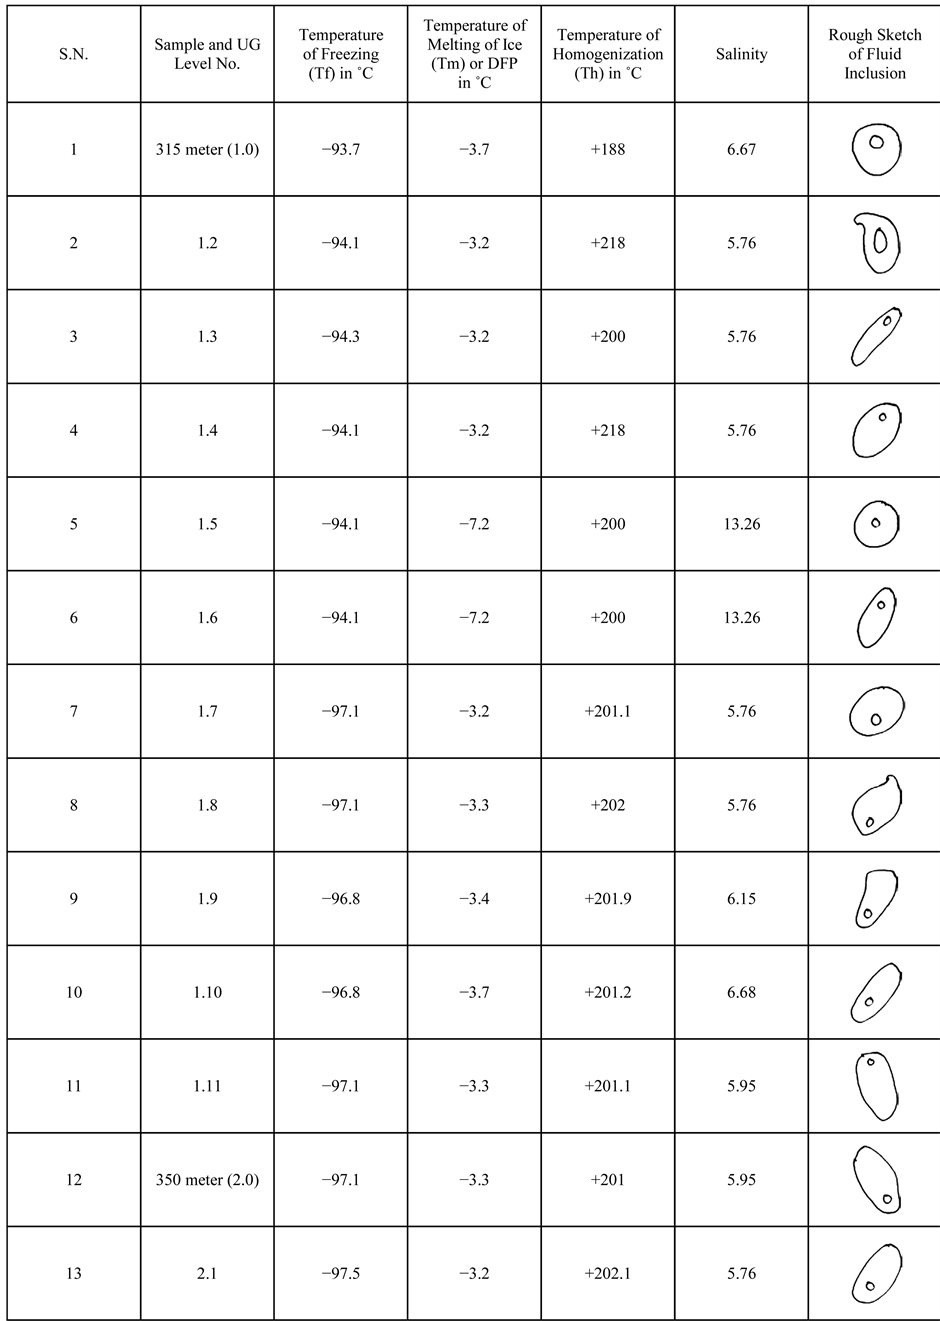
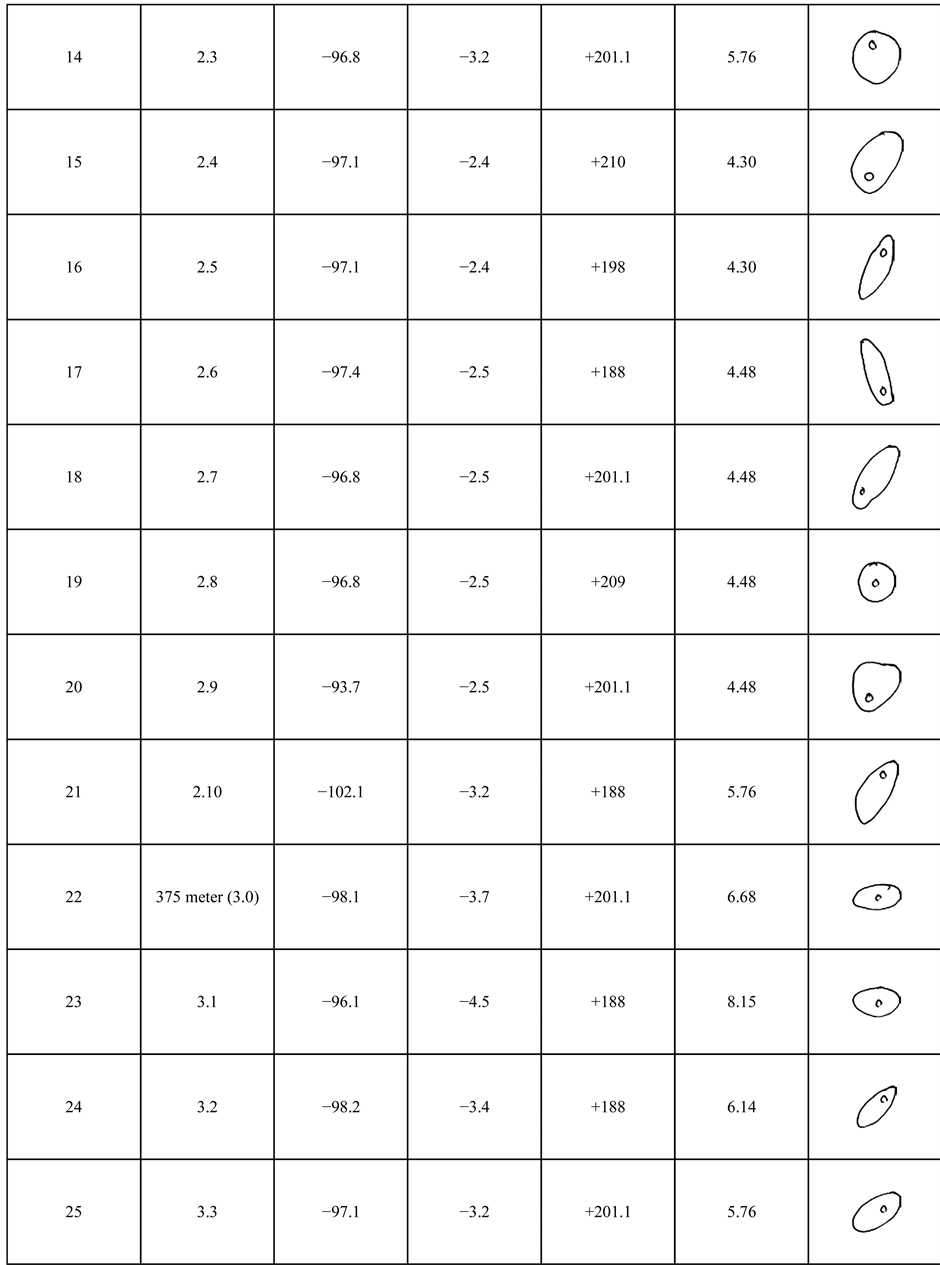
Figure 5. Showing the temperatures and salinity of different Fluid Inclusion under micro-thermometry study (heating and freezing stage). DFP―Depression Freezing Point.
Table 2. Primary biphase (H2O-NaCl) aqueous fluid inclusions (depth: 315 m).
Table 3. Primary biphase (H2O-NaCl) aqueous fluid inclusions (depth: 350 m).
Table 4. Primary biphase (H2O-NaCl) aqueous fluid inclusions (depth: 375 m).
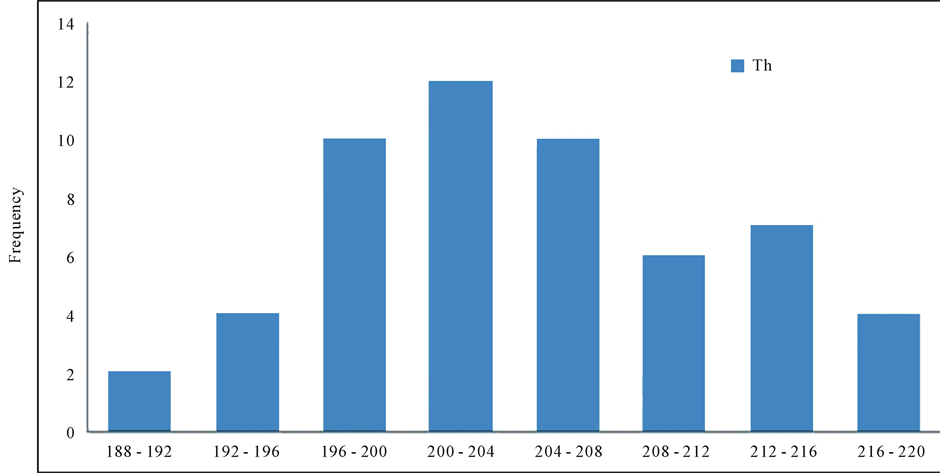
Figure 6. Histogram showing temperature of homogenization (Th).
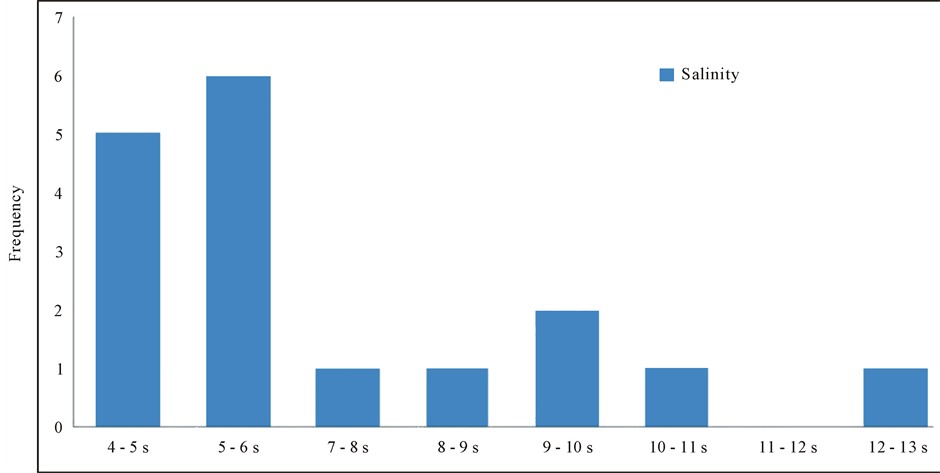
Figure 7. Histograms salinity of primary biphase inclusions.
5.4. Appendix
Heating and cooling studies are performed on quartz samples of different underground levels using Chaixmeca stage (−196˚C to +600˚C) fitted on a Leitz Laborlux microscope. The accuracy of heating and freezing measurement is about ±0.5˚C. The phase transformations observed in inclusions during freezing and heating studies on the various types of inclusion observed in quartz associated with sphalerite and galena ores.
Salinity determination of fluid inclusions is done using values of freezing point depression in the equation of Bodnar [23] . The result of microthermometric studies on the primary biphase inclusions are summarized in above table. Fluid inclusions in quartz samples show a narrow range of variation in their last ice melting (Tmice) and homogenization (Th) temperature values.
Result is showing the low salinity ranges (4.5 - 13.23 wt% NaCl eq.) and also low temperature of homogenization which reveal that the rate of cooling was the important mechanism of ore deposition in the study area.
6. Conclusions
The present study of Rajpura-Dariba-Bethumni Belt, Udaipur (Rajasthan), is on fluid inclusions petrography of Proterozoic Carbonate hosted formation. The Underground samples collected from the level of 375 meter, 350 meter and 315 meter from the SK mines, Vedanta Group Udaipur. This work involved the study of ore-petro- graphy, thin section petrography, wafer thin section (0.3 mm) petrography for fluid inclusions. On the basis of above parameters the following discussion was made to bring out valuable conclusion at the end.
The fluid inclusions study of host mineral quartz samples show that the presences of primary inclusions which are mainly multiphase types ( Plate 2 ), biphase ( Plate 3 ) and very few of liquid-rich monophase types of fluid inclusions. The majority of the inclusions are liquid rich biphase types having small gas/vapour bubble. In multi phase fluid inclusions the presences of daughter crystals and trapped crystals are more prominent than liquid phase. The secondary fluid inclusions are mainly biphase and occur as trails. The Population study of fluid inclusions shows that primary biphase inclusions are more at 15 - 20 µm size ( Plate 3 ).
Fluid inclusions in different diagenetic environments show different features e.g. the post diagenetic fluid inclusions show occurrences along growth zone of the host quartz and in the cementing material of it. A few of them were of naturally decrepitated fluid inclusion cavities. These changes by occurrences of different generations of fluid inclusions may through some light on paleoclimatic conditions of the study area. The fluid inclusion stratigraphy (FIS) shows ( Plate 5 and Plate 6 ) the cross cuttings relationship between the trails of fluid inclusions and/or with the cleavages and micro-fractures, which gives the indication of younger and older sequences of generations of fluid inclusions within a particular quartz grain boundary.
The micro-thermometric analyses of primary biphase fluid inclusions (H2O-NaCl) system show that the salinity of trapped fluid is vary between 4.5 - 13.25 wt% NaCl which indicates that the paleo-fluids might have been moderate in salinity and were showing the temperature of homogenizations ranging from 188˚C to 218˚C.
Acknowledgements
The authors are thankful to Indian Institute Technology Bombay for field and laboratory support in carrying out the investigation, to Chairman of Department of Geology, AMU Aligarh for providing necessary facilities and to Mr. Partha Sarath Chaudhary and Mr. Mohd Shaif (Research scholars) for fruitful discussion and support.
References
- Powar, K.B. and Patwardhan, A.M. (1984) Tectonic Evolution and Base Metal Mineralization in the Aravalli-Delhi Belt, India. Precambrian Research, 25, 309-323. http://dx.doi.org/10.1016/0301-9268(84)90038-X
- Haldar, S.K. (2006) Exploration Modeling of Base Metal Deposits. Elsevier, A Division of Reed Elsevier India Private limited, New Delhi, 227 p.
- Roy, A.B., Paliwal, B.S. and Goel, O.P. (1971) Superposed Folding in the Aravalli Rocks of the Type Area around Udaipur, Rajasthan. Journal of the Geological Society of India, 12, 342-348.
- Haldar, S.K., and Deb, M. (2001) Geology and Mineralization of Rajpura-Dariba Lead-Zinc Belt, Rajasthan. In: Deb, M. and Goodfellow, W.D., Eds., Sediment-hosted Lead-Zink Deposit Modeling Program: Delhi-Udaipur, Elsevier, A Di- vision of Reed Elsevier India Private limited, New Delhi, 177-187.
- Gupta, B.C. (1934) The Geology of Central Mewar. Memoir Geological Survey India, 65, 107-168.
- Talluri, J.K., Pandalai, H.S. and Jadhav, G.N. (2000) Fluid Chemistry and Depositional Mechanism of the Epigenetic, Discordant Ore Bodies of the Proterozoic, Carbonate-Hosted, Zawarmala Pb-Zn Deposit, Udaipur District, India. Economic Geology, 95, 1505-1525.
- Deb, M. and Bhattacharya, A.K. (1980) Geological Setting and Conditions of Metamorphism of Rajpura-Dariba Polymetallic Ore Deposit, Rajasthan, India. Proceedings of the 5th Quadrennia lInternational Association on the Genesis of Ore Deposits Symposium, Schweizer-Bart’sche Verlagsbuchhandlung, Stuttgart, 689-697.
- Hacket, C.A. (1881) On the Geology of the Aravalli Region, Central and Eastern. Geological Survey of India, 14, 279- 303.
- Gopalan, K., Trivedi, J.R., Balasubramanyam, M.N., Roy, S.K. and Sastri, C.A. (1979) Rb-Sr Chronology of the Khetry Belt, Rajasthan. Journal of the Geological Society of India, 20, 450-456.
- Roy, A.B. and Jakhar, S.R. (2002) Geology of Rajasthan, (Northwest India), Precambrian to Recent. Scientific Publishers (India), Jodhpur, 412 p.
- Roy, A.B. and Kroner, A. (1996) Single Zircon Evaporation Ages Constraining the Growth of the Archaean Aravalli Craton, Northwestern Indian Shield. Geological Magazine, 133, 333-342. http://dx.doi.org/10.1017/S0016756800009067
- Heron, A.M. (1953) Geology of Central Rajasthan. Mem.79, Geological Survey of India, Kolkata, 339 p.
- Wiedenbeck, M., Goswamia, J.N. and Royb, A.B. (1996) Stabilization of the Aravalli Craton of the North-Western India at 2.5 Ga: An Ion Microprobe Zircon Study. Chemical Geology, 129, 325-340. http://dx.doi.org/10.1016/0009-2541(95)00182-4
- Ray, J.N. (1980) An Evaluation of the Tectonic Framework of the Rampura-Agucha Zinc-Lead Deposit, Bhilwara District, Rajasthan. Indian Minerals, 34, 19-21.
- Gandhi, S.M. (2001) The Ancient Mining and Metallurgy in Rajasthan. Hindustan Zinc Limited, 4, 2-13.
- Ameta, S., Das Gupta, S. and Sharma, B.B. (1999) Geology, Structure and Mineralisation in Dariba-Bethumni-Sura- was Belt, Rajsamand Dist., Rajasthan. Records of the GSI, 129, 22-24.
- Roedder, E. (1984) Fluid Inclusions. Mineralogical Society of America. Review in Mineralogy, 12, 644.
- Roedder, E. (1972) Compositions of Fluid Inclusions. In Data of Geochemistry, U.S. Geological Survey Paper 440-JJ, 164.
- Rankin, A.H. and Alderton, D.H.M. (1983) Fluid Inclusion Petrography of SW England Granites and It Potential in Minerals Exploration. Mineralium Deposita, 18, 335-347. http://dx.doi.org/10.1007/BF00206483
- Touret, J. (1981) Fluid Inclusions in High-Grade Metamorphic Rocks. In: Hollister, L.S. and Crawford, M.L., Eds., Short Course in Fluid Inclusions: Application to Petrology, Mineral Association of Canada, Markham, 182-208.
- Sang, E. (1873) Notice of a Singular Properties Exhibited by the Fluid Enclosed in Crystal Cavities. Proceedings of the Royal Society of Edinburgh, 86, 81-88.
- Shepherd, T.J., Rankin, A.H. and Alderton, D.H.M. (1985) A Practical Guide to Fluid Inclusion Studies. Blackie, Glasgow; Chapman and Hall, New York, 239 p.
- Bodnor, R.J. (1993) Revised Equation and Table for Determining Freezing Point Depression of H2O-NaCl Solution. Geochimica et Cosmochimica Acta, 57, 683-684. http://dx.doi.org/10.1016/0016-7037(93)90378-A
NOTES

*Corresponding author.