International Journal of Geosciences
Vol.05 No.12(2014), Article ID:51726,12 pages
10.4236/ijg.2014.512121
Application of Seismic Attributes for Delineation of Channel Geometries and Analysis of Various Aspects in Terms of Lithological and Structural Perspectives of Lower Goru Formation, Pakistan
Tayyab Muhammad Naseer1, Shazia Asim1,2, Mirza Naseer Ahmad3, Farrukh Hussain4, Shahid Nadeem Qureshi5
1Department of Earth Sciences, Quaid-I-Azam University, Islamabad, Pakistan
2China University of Geosciences, Wuhan, China
3School of Sciences, Nusrat Jahan College, Rabwah, Pakistan
4Deewan Petroleum Limited, Islamabad, Pakistan
5COMSATS Institute of Information Technology (CIIT), Islamabad, Pakistan
Email: mtayyab.naseer1@gmail.com, shazia.asim1@gmail.com
Copyright © 2014 by authors and Scientific Research Publishing Inc.
This work is licensed under the Creative Commons Attribution International License (CC BY).
http://creativecommons.org/licenses/by/4.0/


Received 8 September 2014; revised 2 October 2014; accepted 25 October 2014
ABSTRACT
Miano area is one of the distinct major hydrocarbon producing fields of the Lower Indus basin. Lower Goru is the reservoir strait in this area. The aim of the present study is to exploit the channels reservoirs and other stratigraphic features in such a terrain where there is always a challenge for the geoscientist to search and exploit the channeled reservoirs. To resolve this issue we have utilized attribute analysis on high resolution 3D-seismic data for the detailed comparative studies for the channels. There are many astonishing features that are identified in the current study, which could not otherwise be easily enhanced with the help of 2D Seismic Data. Seismic attributes such as coherency, frequency (are also appropriate for lithological discrimination), which are sensitive to the channel edges are applied for the channel delineation and their geometrical analysis. Spectral decomposition techniques are also applied for the delineation of channels and to appropriately select the best band for channels identification. Three types of channel geometries are recognized: 1) highly sinuous channel; 2) narrow-broad meandering belts; 3) moderate to high sinuous channel. NW-SE, N-W trending faults can be helpful to compartmentalize the reservoir. Instantaneous and dominant frequency are more beneficial for further field development based on Gamma Ray logs from nearby drilled wells and dimensional perspectives analysis of the channel reservoir.
Keywords:
Seismic, Attributes, Spectral Decomposition, Lower Goru Strait, Miano, Lower Indus Basin, Channels

1. Introduction
Channels filled with porous rock and enclosed in a nonporous media possess more significant stratigraphic exploration plays. However, detailed mapping of channels has a much broader impact. By the application of advanced and pale analogous, mapping channels help to map the paleo-depositional environment and interpret less obvious prospective areas such as fans and levees. By mapping the width, tortuosity, and special relation of meandering channels, avulsions, braided streams, among others, geomorphologies are able to infer depth and fluid velocity during the time formation and thus, better risk whether the fill is sand or shale prone [1] . Seismic attributes that are sensitive to the edges of the stratigraphic events (Such as channels) which are coherence, frequency, curvature etc., are the most distinguished means of mapping the channel boundaries [2] . Although these attributes can easily detect channel edges, they cannot indicate the channel’s thickness, and when the channel become very thin (well below 1/4 wavelength), their waveforms become constant, such that coherence measures based on waveform shape cannot see the channel at all [3] . By the advancement in the seismic attributes, spectral decomposition has also highlighted channels [4] [5] . Spectral decomposition analysis is a significantly vigorous method in seismic data processing and interpretation. Generally spectral decomposition techniques output a suite of tight samples from event in which lateral continuity is also deployed for the lithological analysis. There are a number of volume cubes from a single processed cube [4] [6] . A large output cube gives the partial solution to this challenge. Liu and Marfurt (2006) combined peak frequency and peak amplitude to highlight the channel system. The instantaneous frequency attribute responds to both wave propagation effects and depositional characteristics, hence it is a physical attribute and can be used as an effective discriminator [7] - [9] . It is used to indicate bed thickness. Higher frequencies indicating sharp interfaces may be exhibited by thinly laminated shale; lower frequencies are indicative of more massive bedding geometries, e.g. sand-prone lithologies. A Gabor-Morlet type [10] [11] joint Time-Frequency analysis allows us to study frequency-varying attributes. Instantaneous spectra, spectral ratio and phase differences provide measurements for bed thickness variation and absorption [7] .
2. Geology/Tectonics and Depositional Settings of the Area
Lower Guru Formation is the reservoir formation in Miano, Lower Indus Basin (LIB) for which this study has been conducted [Figure 1(a) and Figure 1(b)]. Lower Guru Formation lies in the cretaceous Era. LIB is bounded to the north by the Central Indus Basin, to the northwest by the Sulaiman Fold belt Basin and the Kirthar

Figure 1. (a) Geographic location map; (b) Base map of the study area.
Fold Belt Basin in the south west. To go with the prominent convergence and the late Paleocene collision between the Indian and the Eurasian plates in the north Pakistan, the area was also affected by the translation between Indian plate and Afghan Craton in the northwest [12] and by tertiary convergence between Arabian Plate and Afghan Craton [13] . The main structures and sedimentology of the Lower Indus Basin are rifting of the Indian Plate from Gondwanaland (Jurassic or Early Cretaceous) which probably created NE-SW to N-S rift systems, isostatic uplift or ridge-push at the margins of the newly developed ocean probably caused uplift and eastwards tilting at the start of the Cretaceous. Separation of the Madagascan and Indian plates in the Middle to Late Cretaceous may have caused some sinisterly strike-slip faulting in the region and Hotspot activity and thermal doming at the Cretaceous-Tertiary boundary. This caused uplift, erosion, extrusion of the Deccan flood basalts and probably the NNW-striking normal faults. Paleocene-Eocene emplacement of the Bela Ophiolites may have caused gentle folding, Eocene passive margin conditions caused structural quiescence and carbonate deposition, Oligocene to present-day Himalayan collision caused sinistral transpression in the west of the Lower Indus Basin, with fold-thrust structures overprinted by sinisterly flower structures. Information about the description and deposition of various rock units is available in literature ( [14] [15] ). Cretaceous rocks are widely distributed in different parts of Lower Indus Basin. There is wide range of lithological heterogeneity in these rocks, mainly attributed to change in sediment supply and environmental conditions. The thick (+760 m) Neocomian Sembar Formation consists of black shale, which is silty and has interbeds of black siltstone and nodular argillaceous limestone. There are some sandstone beds as well. The siliciclastics were probably derived from the Indian Shield and have sand in more abundance in the eastern parts of the basin, while the western part is more silty and shaley [14] . The Aptian-Albian Guru Formation is mainly composed of black to gray and locally maroon shale/mudstone in the lower part. The upper part of Lower Guru is composed of sandstone that is of significant importance in terms of its reservoir character in different parts of the southern Indus Basin. Sandstone is rare in the upper part of the Formation that has shale as dominant lithology. The name Lower Guru is used for the lower sandy part of the Formation, whereas the upper shale unit is termed as Upper Guru [14] . The generalized depositional environments of the Formation appear to be relatively deep marine, with minor shallow phases of benthic rich fauna being indicated. The Lower Guru may, however, represent barrier to deltaic environments. Sember-Guru plays are very important in the context of hydrocarbon production. As gas is producing from the Lower Goru formation which is divided into three sand intervals, as A, B, C & D (Figure 2) [16] . Goru Formation consists of interbedded sandstone, shale and siltstone with very thin-bedded limestone [17] .
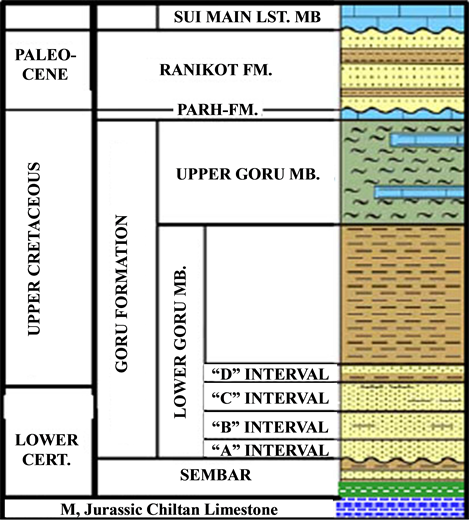
Figure 2. Stratigraphic column showing the subdivisions of Lower Guru Formation into Sand intervals A, B, C and D [16] .
3. Methodology
Synthetic seismograms were generated for wells to link logs (in depth domain) to time domain seismic data and to observe the seismic character of sands within the area. The synthetic seismograms were created by using the extracted Wavelet at well locations (Figure 3). Well to seismic ties were performed by establishing correlation between the seismic and synthetic seismograms by adjusting T-D functions through stretch and squeeze (Figure 4). The zone of interest is defined from 2140 m to 2835 m, which includes fluvio-deltaic sands reservoirs of Early to Middle Cretaceous. Three key horizons H1, H2 and H3 namely Upper Guru, Lower Guru D and C-Interval respectively were mapped throughout the 3D post stack migrated seismic data volume (Figure 5) and interpolated to obtain continuous horizon surfaces for surface seismic attribute scanning of various seismic attributes, shown along with the faults at various intervals with White, red and Black colors respectively. The Gamma Ray (GR) curve is displayed for the reference of lithological variations. In order to map in detail the vertical changes in sand distribution and seismic geomorphology some additional horizon slices were selected with reference to these three interpreted Horizons.
Zonation of Reservoir: About 900 ms to 1400 ms (1575 - 2450 m) window of the reservoir zone is selected in which three horizons H1, H2, H3 are marked and studied for the detailed morphological and lithological perspectives.
4. Selection of Seismic Attribute and Their Processing for Analysis
It is always a critical stage of research, because selection of seismic attributes is one of the main steps in recognizing stratigraphic events and to overcome pitfalls in interpretation. We incorporated Seismic amplitude,
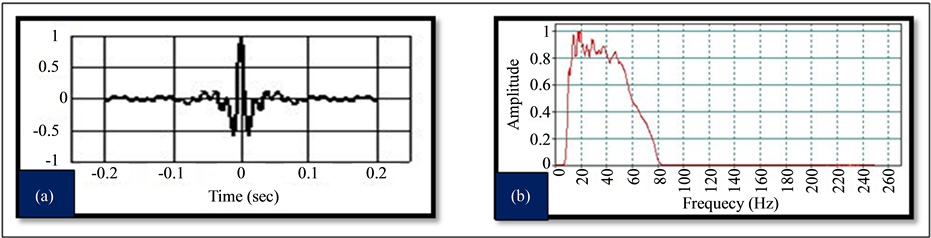
Figure 3. (a) Extracted wavelet used for synthetic generation in time series; (b) Frequency spectra of extracted wavelet.
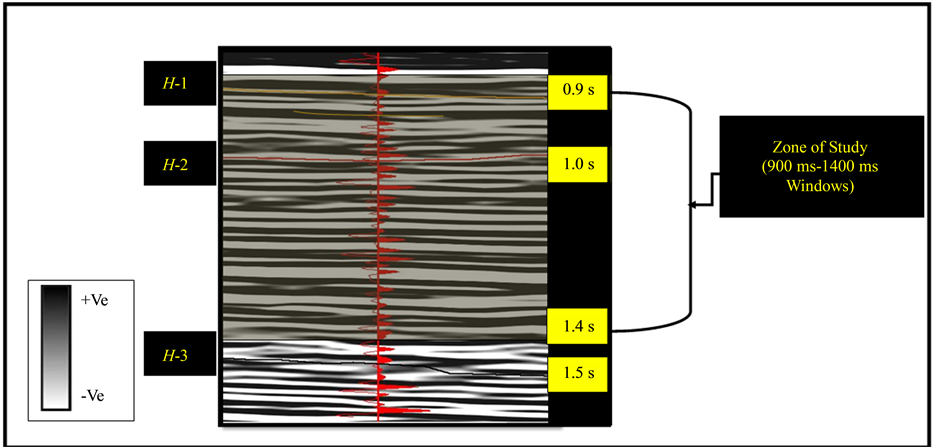
Figure 4. Synthetic to well tie in one of the wells.

Figure 5. Conventional seismic section showing the three marked horizons along with faults. The red curve is the GR curve.
instantaneous frequency, coherence, dominant frequency, curvature attributes in this study. These are the attributes which are sensitive to the channel edges and can be beneficial for channels identification and to interpret lithology as well. These attribute are extracted along the horizon of interest between three marked horizons. Cube Variance 3-D visualization technique is applied to confirm the channels from the seismic vertical sections followed by the horizon slices generation through seismic surface attributes scanning along the selected horizons of interest.
5. Discussion
The seismic data is of normal polarity with an increase in acoustic impedance being represented by a peak. Seismic amplitude horizon slice of H1 shows low amplitudes by red colors (Figure 6).
6. Seismic Coherency Horizon Slices Analysis
Seismic coherency is a measure of trace-to-trace similarity or continuity of seismic waveform in a specified window.
Coherency may be helpful to detect sands associated with fluvial-deltaic sands channels systems [5] . Coherence slices within H1 to H2 interval show narrow, low coherence, sinuous features. The associated vertical sections across the dark sinuous features reveal that they may be channels (Figure 7). These channels are confirmed from the low amplitude on the seismic vertical sections at various locations of the survey area and at most of the location these low amplitudes correlate along sandstone lithology from nearby drilled wells.
7. Seismic Geomorphology and Dimensional Perspectives of the Channels Geometries
Seismic coherence slice generated between the horizon H1 and H2, reveals the channels geometries. There are four channels identified on the coherency horizon slice. In Figure 7, there are four channel bodies labeled as “A”, “B”, “C”, and “D”. Channel A is trending in North-South orientation showing good sinuosity followed by the narrow shape at the end. Channels “B” and “C” are almost in the center of area. These channels showed variety of the morphology on the horizon slice. At the southern margin of the channel “C”, the east-west trending fault is cutting across the channel geometry and dividing the channel path towards the eastern margins of the channel. Channel “B” is almost in the middle of the area. Moving from North towards south, its morphology is wide to sinuous in the middle to narrow at the end.

Figure 6. Seismic amplitude horizon slice of the horizon H1.

Figure 7. Coherency horizon slice of H1.
8. Fault Detection and Seismic Geomorphology
There are five major faults/fractures identified on the seismic coherence horizon slice (Figure 7) which is further confirmed by moving the seismic vertical section on the horizon slice. Two discontinuities are trending in the East-west orientation. And the remaining three faults are almost ending in the middle of the horizon slice, as compared to other two east-west trending fault and are cutting along the three main channels which are entering into the large water body. As predominantly the area of study is of fluvio-deltaic and deep marine depositional conditions according to the literature. We can infer that the different channels are entering into the large water body. There is a structural disturbance in the research area two channels “A”, “B” which are in the North-south direction are cut by the two faults which are observed in the East-west direction. East-west trending faults cut the two main channels at point labeled as X and Y respectively. There is another good sinuous meander channel at western margins is cut by the fault which is moving in the East-west direction and it is dipping in the North direction. While moving from north towards south, it also gives very good sinuosity. Then finally the channel “C” is cut by the fault at the point, where the coherency values are extremely high. This is point labeled as “Z” and from this point, the meandering appearance of the channel become a little prominent. Now if we see on the eastern flank of the area, there is also channel “D”. As we move from north towards south “D”, the channels exhibits a narrow image and towards south, it gets the wider morphology, where there is very low coherency value.
9. Instantaneous Frequency Horizon Slice Analysis
Analysis for the channel “A” shows that in portion of the channel towards north, the fault is cutting along the channel making a sinuosity in the shape of the channel and it is filled with thick shale beds giving the high frequency values (Figure 8). It is also confirmed from the nearby drilled wells in the area. Almost in the middle of the channel there is sandstone lithology as very low frequency gives us the inference about the thick sandstone, filled by the shale and then finally at the lowest point “X” on the channel, is the point of the intersection of fault cutting the channel geometry.

Figure 8. Instantaneous frequency horizon slice of H1.
Channel B, is having thick sandstone lithology on the western flank of the channel. Then in the middle of the channel east-west trending fault cuts the channel giving it a little sinuous appearance. The channel “C” also appears as sinuous at the start of the channel, but in the middle of the channel, it is converted into the straight narrow channel form. Here the lithology is completely of sandstone composition, as it is confirmed from the scale bar by showing the extremely low frequency values which are of sandstone lithology and also from the nearby drilled wells. We can infer from the above sandstone portion the channels to be of good porosity zone. Then at the end of the channel, there are again thin shale beds that are the indicators of the low porosity zones. If the porosity logs would be available then the exact porosities would be used for lithology confirmation and with the help of spontaneous potential logs we could easily declare the exact thickness of the sand-shale bodies.
10. Dominant Frequency Horizon Slice Analysis
There are also some possible point bars identified on the bottom of the channel geometry (Figure 9). The northern flank of the channel is sinuous and in the middle of the channel, it gets into narrow morphology. Thick sand bodies are confirmed and there are also some places which can be interpreted as possible point bars indicated by the blue arrows on the (Figure 10).

Figure 9. Dominant (Peak) frequency horizons slice of horizon H1.

Figure 10. Dominant (Peak) frequency horizon slice of H1 for field development study.
If Spontaneous potential logs were available, then the thickness of the sands could be measured and it would be more beneficial for the deep studies. But to overcome this issue, we have applied spectral decomposition bands to fulfill our objective. Presence of sands is clearly proved from the seismic dominant frequency attribute. With the availability of more well data, the uncertainty level would be much reduced for compartmentalization of the channeled reservoir. The future well locations can be those which are shown by the blue arrows on dominant frequency attribute horizon slice (Figure 10).
11. Calibration of Lithology from the Nearby Wells for Future Field Development
Here we have utilized the dominant frequency instead of instantaneous frequency. The reason behind it is that from the instantaneous frequency horizon slice (Figure 8), we are not able to give clue about the presence of thick sand bodies that can be clearly seen on the dominant frequency horizon slice (Figure 10). On the basis of this, we have analyzed the dominant frequency horizon slice for future field development of prospects. In (Figure 10) the wells 01, 02, 05, 06, 08, and 09 are used for the calibration. Figure 11 is showing very good response of gamma ray concerning the lithology. There are also some pay zones which are between the horizons H2 and H3. These pay zones are lying in the zone of interest in which different channels morphologies are identified. Now from well-02, we can clearly see that the pay zone lying between times 1.2 ms - 1.3 ms is at the horizon slice showing channel A (Figure 10). The channel lithology is confirmed form the dominant frequency
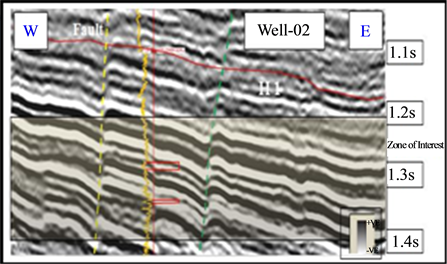
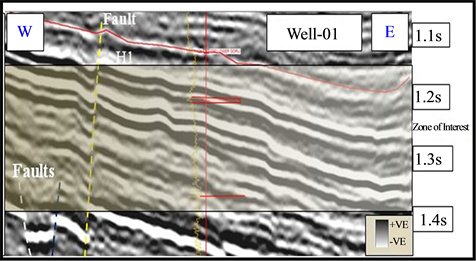
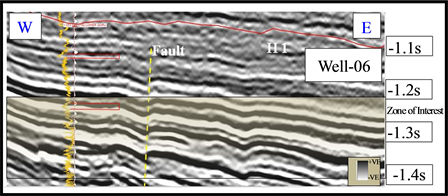
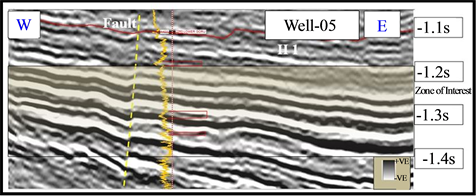
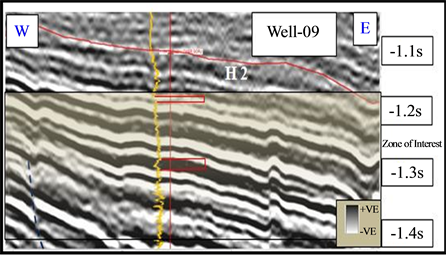
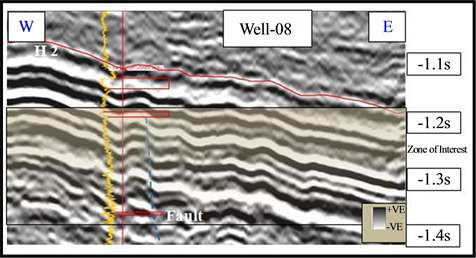
Figure 11. The yellow curves are showing the gamma ray value increasing towards right. The Red Curves are showing pay zones of the respective wells.
horizon slice as well as from the vertical scale bar depicting the lithology. Channel D present at the eastern flank of the survey area can be more productive in the future. The pay zone of well-02 near 1.320 ms is also indicative of the sandstone lithology. It should be noticed here that there is also some shale part in this channel, confirming from the vertical scale bar of dominant frequency horizon slice. For the lithological perspectives, we can have better visualization that the channel C is at the western flank of the area; it is evident that the channel time on the horizon slice is from 1.15 ms to 1.220 ms range. And the well-09 is also confirming that the most of the sandy part is present in the channel. We can clearly identify that the pay zone are shown by red boxes in the available curves.
12. Response of Spectral Decomposition for Bright Amplitudes Interpretation
The purpose of the vertical seismic section analysis of spectral decomposition is to compare the response of sands with various frequency ranges. In Figure 12 the low frequency of 28 Hz is showing thick sand beds. White curve is showing the gamma ray log of the well used for the analysis. With increase in frequency of 37 Hz the thin sands have appeared in the same portion of the well shown in Figure 13 but 48 Hz frequency is showing the thin sand beds (Figure 14). Now at 61 Hz (Figure 15) some distortions result in these beds.
13. Conclusion
Lower Guru Formation is one of the leading reservoirs of the lower Indus basin. Various seismic attributes are

Figure 12. Showing the spectral decomposition analysis on vertical seismic section.

Figure 13. Showing the spectral decomposition analysis on vertical seismic section.

Figure 14. Showing the spectral decomposition analysis on vertical seismic section.

Figure 15. Showing the spectral decomposition analysis on vertical seismic section.
applied to 3D seismic data of Miano field and the channeled reservoirs are delineated and analyzed. There are several structures found in this area: 1) Highly sinuous channel; 2) narrow-broad meandering belts and 3) Moderate to high sinuous channel.
NW-SE, N-W trending faults have played a significant role in compartmentalization of reservoir. Dominant frequency and spectral decomposition techniques have proved to be more reliable as there are clear signs of sands bodies that can be explored further through the delineation of the channel geometries. The various frequency bands of the spectral decomposition have given a clear picture for the future development of this gas field. If these sand bodies are analyzed in a more comprehensive way, then the exploration risks can be reduced.
Acknowledgements
We are thankful to Directorate General of Petroleum Concession for giving the data for research purpose and permission to publish this paper. We are thankful to SMT-Kingdom for providing the academic license of kingdom software. We are also thankful to Department of Earth Sciences, Quaid-i-Azam University, DGPC and LMKR for providing the research data.
References
- Liu, J.L. and Marfurt, K. (2007) Multi-Color Display of Spectral Attributes. The Leading Edge, 26, 268-271.
- Bahorich, M. and Farmer, S. (1995) 3D Seismic Discontinuity for Faults and Stratigraphic Features: The Coherence Cube. The Leading Edge, 14, 1053-1058. http://dx.doi.org/10.1190/1.1437077
- Chopra, S. and Marfurt, K. J. (2006) Seismic Attribute Mapping of Structure and Stratigraphy: CSEG Recorder. Special Edition, 110-121.
- Partyka, G., Gridley, J. and Lopez, J. (1999) Interpretational Applications of Spectral Decomposition in Reservoir Characterization. The Leading Edge, 18, 353-360.
- Peyton, L., Bottjer, R. and Partyka, G. (1998) Interpretation of Incised Valleys Using New 3-D Seismic Techniques: A Case History Using Spectral Decomposition and Coherency. The Leading Edge, 17, 1294-1298. http://dx.doi.org/10.1190/1.1438127
- Liu, J. and Marfurt, K. J. (2007) Instantaneous Spectral Attributes to Detect Channels. Geophysics, 72, 23-31. http://dx.doi.org/10.1190/1.2428268
- Cohen, L. (1995) Time-Frequency Analysis. Prentice-Hall Signal Processing, 291 p.
- Barnes, A.E. (1991) Instantaneous Frequency and Amplitude at the Envelope Peak of a Constant-Phase Wavelet. Geophysics, 56, 1058-1060. http://dx.doi.org/10.1190/1.1443115
- Barnes, A.E. (1992) Instantaneous Spectral Bandwidth and Dominant Frequency with Applications to Seismic Reflection Data. Geophysics, 58, 419-428.
- Gabor, D. (1946) Theory of Communication: J.I.E.E. (London) 95 (III), 429-457.
- Morlet, J., Arens, G., Fourgeau, E. and Giard, D. (1982) Wave Propagation and SAMPLING Theory―Part II: Sampling Theory and Complex Waves. Geophysics, 47, 222-236. http://dx.doi.org/10.1190/1.1441329
- Banks, B.P. and Warburton, J. (1986) Passive-Roof, Duplex Geometry in the Frontal Structures of the Kirthar and Suleiman Belts, Pakistan. Journal of Structural Geology, 8, 229-237. http://dx.doi.org/10.1016/0191-8141(86)90045-3
- Zaigham, N.A. and Mallick, K.A. (2000) Prospect of Hydrocarbon Associated with Fossil-Rift Structures of the Southern Indus Basin, Pakistan. American Association of Petroleum Geologists Bulletin, 84, 1833-1848.
- Kadri, I.B. (1995) Petroleum Geology of Pakistan. Graphic Publishers, Karachi, 545 p.
- Shah, S.M.I. (1977) Stratigraphy of Pakistan. Geological Survey of Pakistan, 12, 4351.
- Ahmed, N., Fink, P., Sturrock, S., Mahmood, T. and Ibrahim, M. (2004) Sequence Stratigraphy as Predictive Tool in Lower Goru Fairway, Lower and Middle Indus Platform, Pakistan. PAPG, ATC.
- Kazmi, A.H. and Jan, M.Q. (1997) Geology and Tectonics of Pakistan. Graphic Publishers, Karachi.