International Journal of Geosciences
Vol.4 No.9(2013), Article ID:40225,8 pages DOI:10.4236/ijg.2013.49124
Prediction of Porosity and Density of Calcarenite Rocks from P-Wave Velocity Measurements
1Laboratory of Thermodynamics, Department of Physics, Faculty of Science, Mohammed V University, Rabat, Morocco
2University of Strasbourg, EOST, Institute of Global Physics, Strasbourg Cedex, France
3Department of Earth Science, Scientific Institute, Mohamed V University, Rabat, Morocco
Email: *a.rahmouni@yahoo.fr
Copyright © 2013 Abdelaali Rahmouni et al. This is an open access article distributed under the Creative Commons Attribution License, which permits unrestricted use, distribution, and reproduction in any medium, provided the original work is properly cited.
Received August 17, 2013; revised September 19, 2013; accepted October 15, 2013
Keywords: Calcarenite Rocks; Porosity; Density; P-Wave Velocity; Regression Analysis; T Student
ABSTRACT
Petrophysical proprieties such as porosity, density, permeability and saturation have a marked impact on acoustic proprieties of rocks. Hence, there has been recently a strong incentive to use new geophysical techniques to invert such properties from seismic or sonic measurements for rocks characterization. The P-wave velocity, which is non-destructtive and easy method to apply in both field and laboratory conditions, has increasingly been conducted to determine the geotechnical properties of rock materials. The P-wave velocity of a rock is closely related to the intact rock properties, and been measuring the velocity in rock masses describes the rock structure and texture. The present work deals with the use of a simple and non-destructive technique, ultrasonic velocity, to predict the porosity and density of calcarenite rocks that are characteristic in historical monument. The ultrasonic test is based on measuring the propagation time of a P-wave in the longitudinal direction. Good correlations between P-wave velocity, porosity and density were found, which indicated them as an appropriate technique for estimating the porosity and density.
1. Introduction
The characterization of rock materials by ultrasonic methods is widely used. Since 1972, ultrasonic velocity measurements have been applied to determine the quality of natural stones, in order to demonstrate homogeneity and degree of alteration [1]. Mamillan [2] applied ultrasonic velocity measurements to stone conservation and diagnostic state of alteration on marble sculptures introducing a new non-destructive methodology to stone conservation.
Ultrasonic pulse velocity has been used for many years in geotechnical practice and mining science. They are widely used to determine properties and states of materials. In the case of engineering solids, measurements of ultrasonic wave propagation velocities are routinely used to determine elastic constants [3,4]. There has been an increasing use of ultrasonic velocity measurements for non-destructive characterization of material microstructures and mechanical properties [5,6]. Therefore, it is important to have appropriate practical methods for making velocity measurements on a variety of material samples.
Various researchers [7,8] demonstrated that the prediction of petrophysical properties in rocks is often difficult due to the possession of complex textures and petrophysical properties, porosity and permeability, which are dependable and are influenced by the diagenetic processes they may have undergone right from the time of deposition to the late diagenesis set in. Certain studies that combined seismic, petrophysical and petrological data to established useful relationship between velocity and petrophysical of rocks were carried out by Kahraman et al. [5] and Yasar et al. [9].
The study of compressional and shear wave propagation, a material to dry and saturated, evaluates the physical properties of materials such as porosity, cracking state and its elastic properties in modeling of the wave propagation. For rocks, it is often interested in the compressional waves propagation (P-wave) and shear waves (S-wave). For a P-wave, the vibration occurs in the direction of propagation and affects the volume of the rock. For S-wave, the vibration propagates in a plane normal to the direction of propagation; it is slower than the P-wave and does not propagate in water. The P-wave and S-wave are characterized by their velocities VP and VS respectively, and their attenuation.
The relationship between velocity and density in rocks is usually considered as linear [10]. The transit time of the waves depends on the density of the minerals forming the rocks [11]. It also depends on porosity (voids proportion and pore size distribution), and on the possibly anisotropic arrangement of the material forming particles [12].
Physical properties, such as porosity and density, are important parameters for the quality of building stones, hence, if good correlations are established between Pwave velocity and the physical properties of calcarenite rocks, which would be helpful to those working in stone processing plants. In this study, the possibility of estimating the physical properties of calcarenite rocks from P-wave velocity obtained from laboratory measurements was investigated.
2. Materials and Methods
The materials used in this study are sedimentary rocks calcarenite, collected in a quarry near the town of Rabat, Morocco. The monuments of Rabat are all constructed by the plioquaternary calcarenite that constitutes the basement of the whole region. A few kilometers to the north of the city, quarries still provide this ornamental rock widely used by stone craftsmen. It is characterized by variable and high porosity (18% - 47%) and thus an elevated permeability [13]. Its chemical composition is very rich in calcium carbonates and its rough surface allows a high receptivity to the atmospheric gaseous pollutants and to hydrous marine sprays charged with various salts.
Six rock samples were cored in size 7 × 7 × 7 cm3 to determine their physical properties. The specimens were dried at 105˚C for 24 h to remove the moisture. Following the standard recommended by the AFPC-AFREM [14], and ISRM [15,16] suggested methods, relevant rock properties i.e., porosity (ϕ), saturated density (ρsat), dry density (ρdry) and P-wave velocity (VP) were determined.
2.1. Porosity
Many techniques are used to estimate the porosity [17, 18], and highlight some geometric properties of the porous network. The technique used for this work is the total saturation with water.
The evaluation of the porosity of a material can not be done directly. Indeed, the estimation of void volume in the connected content material requires the injection of a fluid whose properties are known. The total saturation by a wetting fluid (usually water) is the easiest method to access the value of porosity. According to a suitable protocol, after degassing, the sample is fully saturated with water, and after different weighed, a value of the total porosity is calculated.
The method of measuring the water total porosity is that defined by the standard RILEM [19], which provides that the samples are soaked in the absence of air, i.e. in monophasic regime.
Initially, the samples were dried in an oven at 105˚C to constant mass. Then they were weighed once dry (Ws), then were placed in a vacuum chamber, where they are subjected to a primary vacuum of 2 × 10⁻² mmHg (2.6 Pa) for 24 hours. Meanwhile, in another crystallizer, water distilled and degassed under high vacuum (Figure 1).
After 24 hours of degassing, the samples were soaked vacuum by capillary: the water level is readjusted regularly as and when the progress of the fringe capillary in the material [20]. When the samples are totally immersed, the vacuum is broken, and they are held for 24 hours. Finally, a weighing of samples saturated (W1) and a hydrostatic weighing (W2 = weight of saturated samples subjected to Archimedes) complete measures the value of porosity is given by:
 (1)
(1)
with W1 the weight of the sample saturated with water, W2 weight saturated obtained by hydrostatic weighing, Ws is the dry weight of the sample.
2.2. Density
Bulk density is determined either by measuring precisely sample dimensions and sample weight, after drying in an oven at 105˚C during 24 h or by hydrostatic weighing method which is based on the Archimedes principle on a sample saturated and submerged in a wetting fluid: water. In this test, samples are dried in an oven at 105˚C until constant weight (Ws). Then, the samples are saturated by imbibition in a cell under vacuum during 24 h, by complete immersion during a day in out-gassed water. Then a hydrostatic weighing of the saturated samples immersed
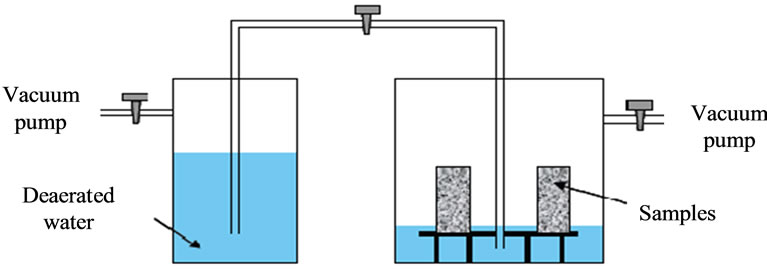
Figure 1. Explanatory scheme of measurement setup of the water porosity.
in water (W2) and a weighing in air of the saturated samples wiped with a wet rag (W1) are carried out. Dry (ρdry) and saturated (ρsat) bulk density can then be calculated from:
 (2)
(2)
 (3)
(3)
The results of density are given in Table 1.
2.3. P-Wave Velocity
The velocity of ultrasonic pulses travelling in a solid material depends on the density and elastic properties of that material. The quality of some materials is sometimes related to their elastic stiffness so that measurement of ultrasonic pulse velocity in such materials can often be used to indicate their quality as well as to determine their elastic properties [21]. The ultrasonic velocity test method employs the principle of measuring the travel velocity of ultrasonic pulses through a material medium.
The pulse velocity equipment consists of an emitter (generating transducer) from which ultrasonic pulses are transmitted, a receiver (or receiving transducer) where the pulses are received, and a device for indicating the time of travel from the transmitter to the receiver (Figure 2). Piezoelectric types of transducers may be used, the latter being more suitable for the lower part of the frequency range. The ultrasonic pulse is created by applying a rapid change of potential from a transmitter-driver to a piezoelectric transformation element that causes it to vibrate at its fundamental frequency. The transducer is placed in contact with the material so that the vibrations are transferred to the material. The vibrations travel through the material and are picked up by the receiver. The wave velocity is calculated by using the time taken by the pulse to travel the measured distance between the transmitter and the receiver. The transducers are held tight onto the surfaces of the specimens, and the display indicates the time of travel of the ultrasonic wave. As
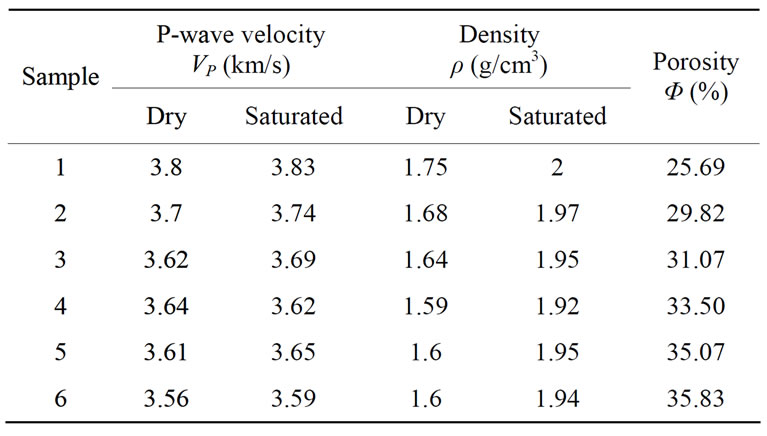
Table 1. Physical properties of calcarenite rocks.
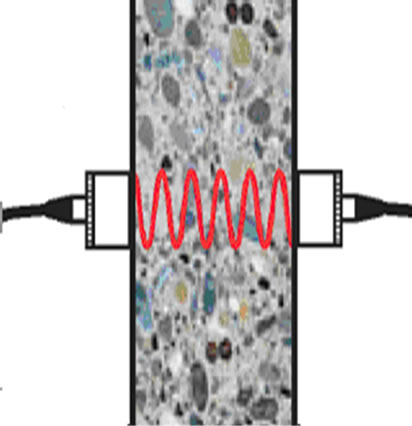

Figure 2. Methods for measuring the transmission time with transducers acting as transmitter and receiver, for calculating the pulse velocity.
soon as the measured value is stable for 3 seconds, a beep sound and the speed of sound appears. The pulse velocity is given by the formula:
 (4)
(4)
where V is pulse velocity (km/s), L is path length (cm) and t is transit time (μs).
To have a perfect contact between the rocks and the transducers, it is necessary to sand and level the part of the surface where the transducer is fixed, and it is recommended to use a paste made of coupling kaolin and glycerol at both ends of rocks and take care to ensure that the transducers are pressed against the surface to be tested. The standard 54 kHz transducers are calibrated on the display unit must be controlled by a calibration test. The calibration factor is marked on the standard toolbar (20.6 μm).
2.4. Student’s t-Test
To study the relationship between P-wave velocity values and other tests like porosity and density of the tested rocks, student’s t-test has been performed.
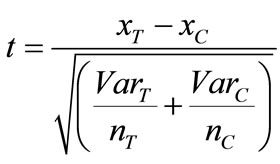
The formula for the t-test is a ratio in which the numerator is just the difference between the two means or averages and the denominator is a measure of the variability or dispersion of the scores. The numerator of the formula is easy to compute by finding the difference between the means. The denominator is called the standard error of the difference which is computed by the calculating the variance for each group and dividing it by the number of people in that group. These two values are then added and their square roots are taken. The formula for the t-test is [22]:
 (5)
(5)
where xT and xC are the tabulated and computed mean, respectively, VarT and VarC are the tabulated and computed variance, respectively, and n is the number of samples.
The t value is positive if the first mean is larger than the second and negative if it is lower. Once the t value is computed, it is then compared with the tabulated value. If the computed value is larger than the tabulated one, then it indicates a strong and significant correlation. To test the significance, one needs to set a risk level (called the alpha level). In most cases, the “rule of thumb” is to set the alpha level at 0.05, i.e., 95% confidence interval. The results of calculated and tabulated values of t-test are given in Table 2.
3. Results and Discussions
Porosity controls all other physical parameters of the rock (density, permeability, thermal conductivity, diffusivity ...). It corresponds to the ratio of the total pore volume and the total volume of the rock and is expressed as a percentage.
In practice, only the open porosity of a rock is measurable. The space created between the grains and microcracks is often recorded with the volume of porosity. In this work, we used the water total porosity.
Table 1 shows that these samples have a difference of porosity. The total porosity of the samples varies between 25.69% and 35.83%. The average porosity is 31.83%.
The P-wave velocity is dependent of several parameters: mineral composition, porosity, presence of cracks and water content. The measured velocity in a macroscopic sample is a balanced average of the velocity in the minerals (e.g. 6.06 km/s in quartz, 6.65 km/s in calcite) and in the fluid present in the porous network (e.g. 1.5 km/s in water, 0.34 km/s in air), altered by the crossing of solid-solid, fluid-fluid or solid-fluid interfaces. The measurements have been performed on dry and water saturated samples.
The results obtained for the measurement of P-wave velocities of dry samples range from 3.56 to 3.8 km/s and
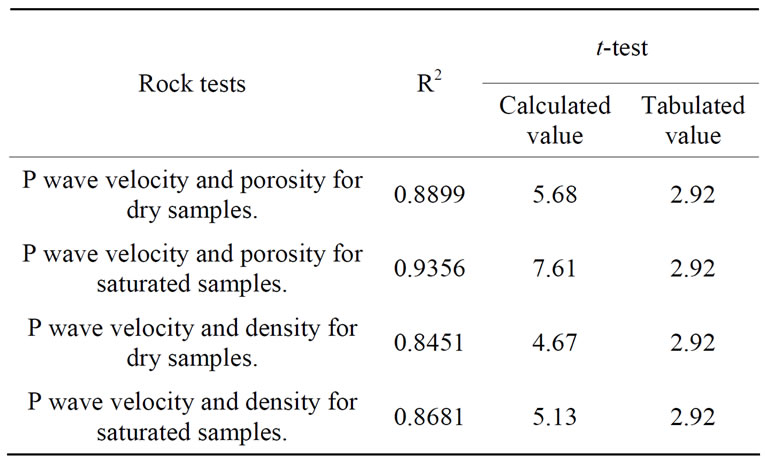
Table 2. Tabulated results of the t-test.
those of water saturated samples vary between 3.59 and 3.83 km/s. These results are consistent with literature results [21,23]. In general, we observe that the high value of the P-wave velocity is obtained for the samples saturated and the low value is obtained for dry samples. The authors Boulanouar et al. [22,23], Kahraman [24], Gué- guen et al. [25] and Oghenero [26] compared the velocities P-wave in dry and water saturated states. They observed generally that VP (dry) < VP (saturated). Ezzdine [27] observed that the P-wave velocity is higher in the saturated state for the limestone.
Furthermore, the P-wave velocity of the dry and water saturated calcarenite rocks were reducing as the porosity is increasing (Figures 3 and 4). This observation is in consistent with the findings of Han et al. [28] and Klimentos [29], for sandstone and limestone by Oghenero [26] and Assefa et al. [7]. In spite of the fact that the samples investigated composed of high proportion of calcite mineral, there was variation in the ranges of VP. The variation is attributable to the amount of porosity and pore types in the calcarenite.
In order to describe the relationships between P-wave velocity, porosity and density of the tested rock samples,
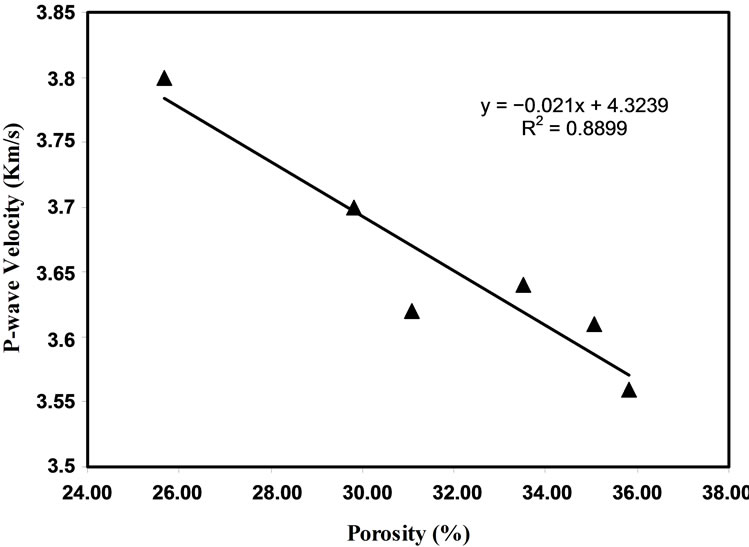
Figure 3. P-wave velocity versus porosity for dry samples.
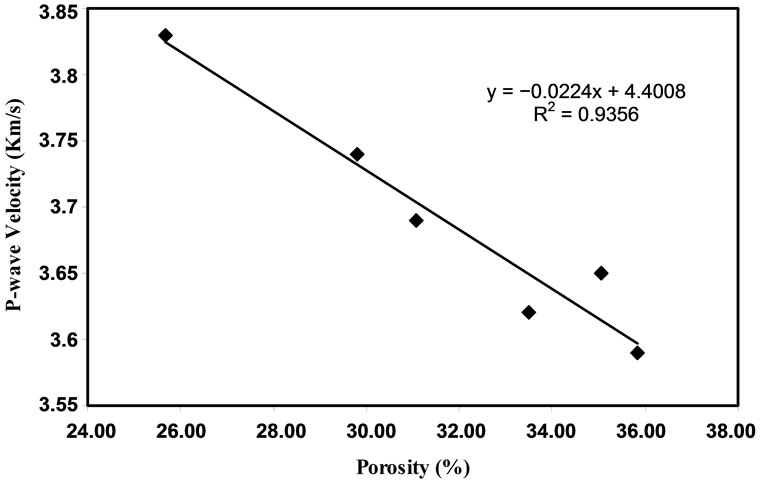
Figure 4. P-wave velocity versus porosity for saturated samples.
a regression analysis was carried out. The equation of the best fit line and the coefficient of determination (R2) were determined for each test result.
The best fit line and its regression analysis for each data set are illustrated in Figures 3-6. It can be seen from the figures that, in all cases, the best fit relationships were found to be best represented by linear regression curves. However, this is only applicable under the Pwave range 3.56 km/s - 3.8 km/s (dry state) and 3.59 km/s - 3.83 km/s (saturated state). For the lower and higher P-wave values, these equations may produce misleading results. Extrapolation should therefore not be used to validate the results from empirical equations.
The graphs between P-wave velocity and porosity are shown in Figures 3 and 4.
There is linear relation between P-wave velocity (VP) and porosity (ϕ) for calcarenite rocks. A strong correlation (R2 = 0.8899 (dry state), R2 = 0.9356 (saturated state)) was found between P-wave velocity and porosity for rocks (Figures 3 and 4). The equations of this relation are given below:
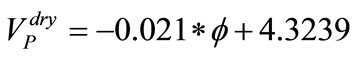 (6)
(6)
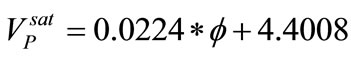 (7)
(7)
The lithology is a determining factor for the P-wave velocity. Sedimentary rocks at high velocity are often carbonates and at low velocity of the sandstones or marnes [24]. On the other hand, the velocities of rocks are controlled by those minerals, but up to a certain point only. In this case, the material contains mainly calcite whose P-wave velocity is 6.65 km/s [24] and secondary minerals (Fe, Mg, P). The variations come then from the variability of the porosity and the presence of secondary minerals whose velocity and density can be high (for iron VP is 1.4 km/s), in this case the velocity and density increase together (Figures 5 and 6). But in a more general way, the P-wave velocity-density correlations have foundations that are more complicated and are located on a microscopic scale.
The plot of P-wave velocity (VP) as a function of density (ρ) is shown in Figures 5 and 6. There is a linear relationship between P-wave velocity and density for calcarenite rocks. A strong correlation (R2 = 0.8451 (dry state), R2 = 0.8681 (saturated state)) was also found between P-wave velocity and the density for rock. Gaviglio [12], Kahraman et al. [5] and Yasar et al. [9] reported a relation between P-wave velocity and density in carbonate rocks with a regression coefficient of 0.78, 0.82 and 0.81, respectively. The equations of relation are as given below:
 (8)
(8)
 (9)
(9)
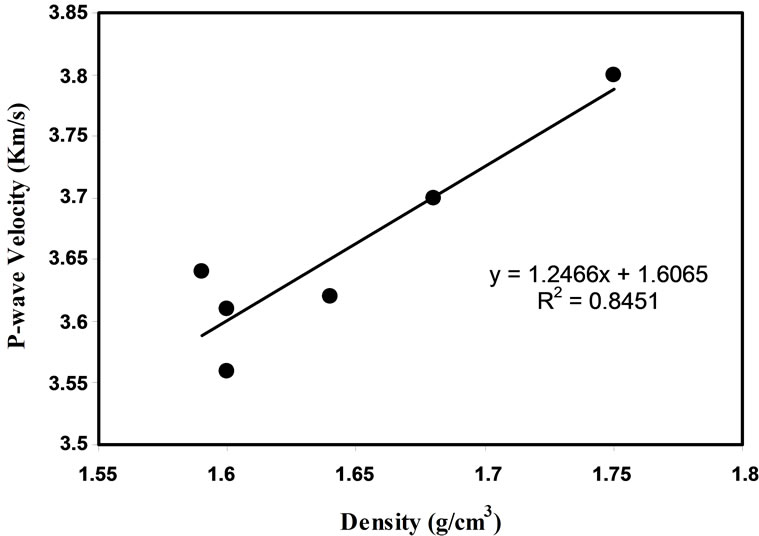
Figure 5. P-wave velocity versus density for dry samples.
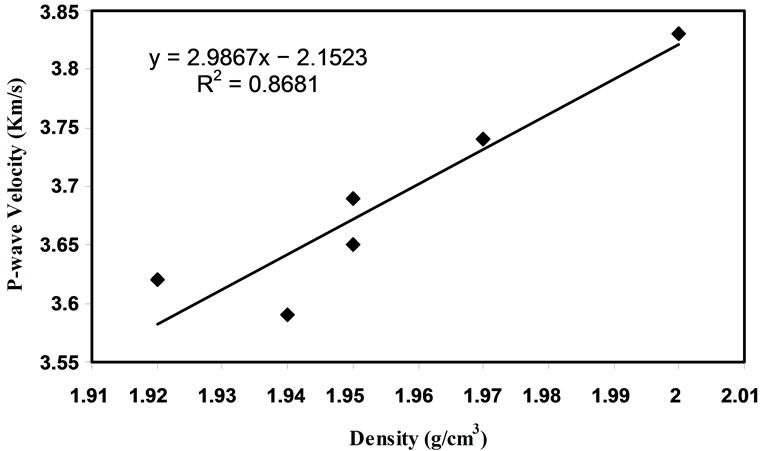
Figure 6. P-wave velocity versus density for saturated samples.
Data from each test were used in the respective empirical equation to calculate other properties. The predicted values of porosity and density were then plotted against the measured values for all tested rocks, respectively, on 1:1 line (Figures 7-10). Point lying on the slope line indicates an exact estimation. It is clear from the Figures 7-10 that P-wave velocity is one of the reliable methods to estimate porosity and density, and to avoid cumbersome and time-consuming laboratory test methods.
To determine the empirical relationships between P-wave velocity, porosity and density of the tested rock, the t-tests have been performed using the so-called student t-test. The t-test is performed to test the null hypothesis. According to the t-test, when computed t value is greater than tabulated t-value, the null hypothesis is rejected and the obtained correlation coefficient (R-value) is acceptable. In the present study, the t value is computed and compared with the tabulated value. Since a 95% confidence level was chosen in this test, a corresponding critical t value 2.92 is obtained. Table 2 shows the calculated and tabulated values of t-test.
In all the above cases for rocks, the calculated value of t-test is much higher than the tabulated value and hence,
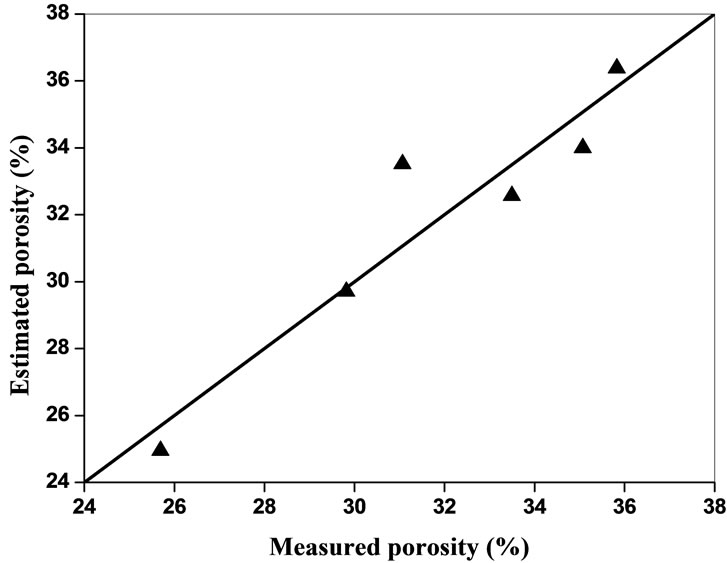
Figure 7. Estimated porosity and measured porosity from P-wave velocity for dry samples.
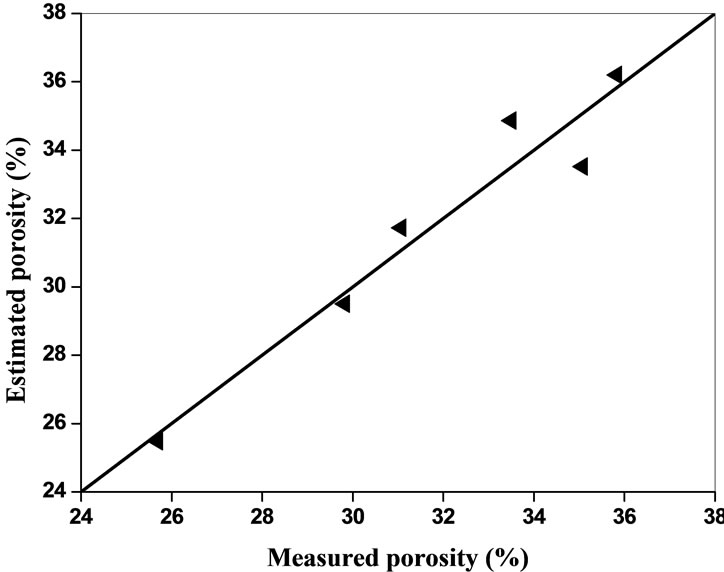
Figure 8. Estimated porosity and measured porosity from P-wave velocity for saturated samples.
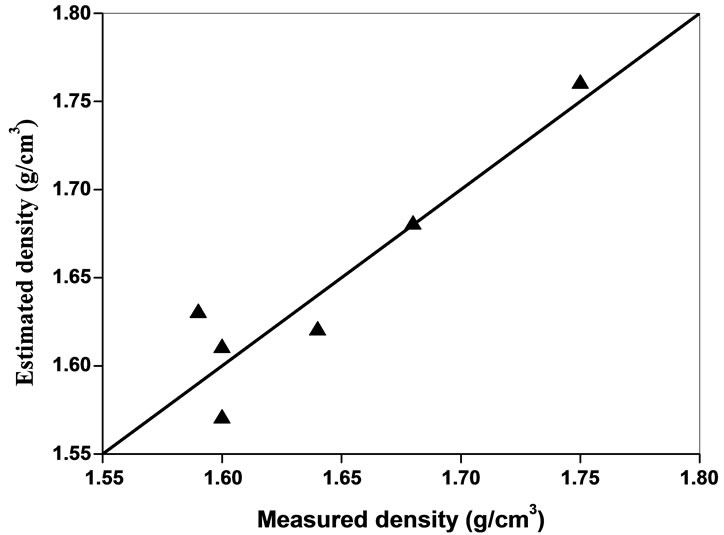
Figure 9. Estimated density and measured density from P-wave velocity for dry samples.
they all have significantly strong correlation among themselves, and this may be used for prediction of the porosity and density using P-wave velocity.
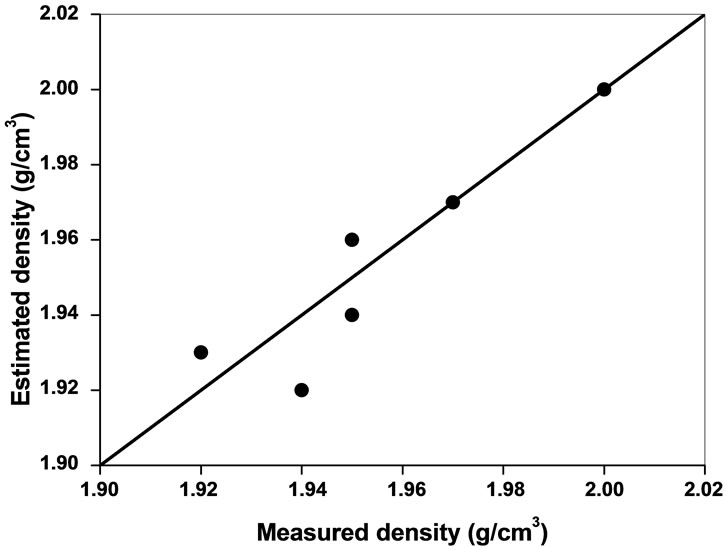
Figure 10. Estimated density and measured density from P-wave velocity for saturated samples.
4. Conclusions
In this study, basic physical properties of 6 rocks samples have been measured and analyzed in an integrated manner. Laboratory measurements have been carried out on the following physical parameters: porosity, density and P-wave velocity.
A strong coefficient of determination was found between P-wave velocity with porosity and density of the tested calcarenite rocks. This was also verified by student’s t-test, which showed higher calculated values for each relation, rather than tabulated values. Hence, they all have significantly a strong correlation among themselves and the proposed correlation equations can be used for the determination of porosity and density by P-wave velocity.
The study has shown that porosity, dry and saturated density can be estimated by the use of P-wave velocity with the given empirical equations for calcarenite rocks that are characteristic in historical monument; however, those equations should be used with care for the rocks composed of high proportion of calcite mineral. Such a correlation can provide a good estimation of such properties as porosity and density, which in many cases can avoid time-consuming and tedious test methods.
5. Acknowledgements
This work is performed in collaboration with our partners in the Scientific Institute of Rabat and those of the Institute of Global Physics of Strasbourg, in the project Integrated Action Franco-Moroccan No. MA/07/168 between University of Strasbourg and Mohammed V University of Rabat.
REFERENCES
- M. Mamillan, “Connaissances Actuelles pour Mesurer le Degré d’Altération des Pierres et l’Efficacité des Méthodes de Traitement,” 1st International Sympo-Soium on the Deterioration of Building Stones, La Rochelle, 1972, pp. 47-56.
- M. Mamillan, “Méthodes d’Essais Physiques Pour Evaluer l’Altération des Pierres des Monuments, The Conservation of Stone I,” Bologna, Rossi-Manaresi, 1975, pp. 595-634.
- A. Bouineau, “L’Intérêt des Essais Non-Destructifs Utilisés pour l’Etude de la Restauration des Monuments et des Sculptures, Altération et Protection des Monuments en Pierres,” RILEM, Paris, 1978, pp. 1-29.
- G. Vasconcelos, P. B. Lourenço, C. S. A. Alves and J. Pamplona, “Prediction of the Mechanical Properties of Granites by Ultrasonic Pulse Velocity and Schmidt Hammer Hardness,” Masonry Conference, Missouri, 2007, pp. 998-1009.
- S. Kahraman and T. Yeken, “Determination of Physical Properties of Carbonate Rocks from P-wave Velocity,” Bulletin of Engineering Geology and the Environment, Vol. 67, No. 2, 2008, pp. 277-281. http://dx.doi.org/10.1007/s10064-008-0139-0
- R. Zivor, J. Vilhelm, V. Rudajev and T. Lokajíček, “Measurement of Pand S-wave Velocities in a Rock Massif and its Use in Estimating Elastic Moduli,” Acta Geodynamica et Geomaterialia, Vol. 8, No. 2, 2011, pp. 157- 167.
- S. Assefa, C. McCann and J. Sothcott, “Velocity of Compressional and Shear Waves in Limestones,” Geophysical Propecing,” Vol. 51, No. 1, 2003, pp. 1-13. http://dx.doi.org/10.1046/j.1365-2478.2003.00349.x
- H. Soroush, H. Qutob and W. Ltd, “Evaluation of Rock Properties Using Ultrasonic Pulse Technique and Correlating Static to Dynamic Elastic Constants,” The 2nd South Asain Geoscience Conference and Exhibition, GEO India, New Delhi, 2011.
- E. Yasar and Y. Erdogan, “Correlating Sound Velocity With the Density, Compressive Strength and Young’s Modulus of Carbonate Rocks,” International Journal of Rock & Mining Sciences, Vol. 41, No. 5, 2004, pp. 871- 875. http://dx.doi.org/10.1016/j.ijrmms.2004.01.012
- Y. Youash, “Dynamic Physical Properties of Rocks: Part 2. Experimental Result,” Proceedings of the 2nd Congress of the International Society for Rock Mechanic, Beograd, Vol. 1, 1970, pp. 185-195.
- F. Birch, “The Velocity of Compressional Waves in Rocks to 10 Kilobars (Part I),” Journal of Geophysical Research, Vol. 65, No. 4, 1961, pp. 1083-1102. http://dx.doi.org/10.1029/JZ065i004p01083
- P. Gaviglio, “Longitudinal Waves Propagation in a Limestone: The Relationship between Velocity and Density,” Rock Mechanics and Rock Engineering, Vol. 22, No. 4, 1989, pp. 299-306. http://dx.doi.org/10.1007/BF01262285
- N. Zaouia, M. ELwartiti and B. Baghdad, “Superficial Alteration and Soluble Salts in the Calcarenite Weathering Case Study of Almohade Monuments in Rabat: Morocco,” Environmental Geology, Vol. 48, No. 6, 2005, pp. 742-747. http://dx.doi.org/10.1007/s00254-005-0013-3
- AFPC-AFREM, “Détermination de la Masse Volumique Apparente et de la Porosité Accessible à l’Eau. Méthodes Recommandées pour la Mesure des Grandeurs Associées à la Durabilité,” Compte-rendu des Journées Techniques, Toulouse, 11-12 Décembre 1997, pp. 121-124.
- ISRM, “Suggested Method for Rock Characterization, Testing and Monitoring,” International Journal of Rock Mechanics and Mining Sciences & Geomechanics Abstracts, Vol. 18, No. 6, 1981, p. 109. http://dx.doi.org/10.1016/0148-9062(81)90524-6
- ISRM, “Suggested Method for Determining Sound Velocity,” International Journal of Rock Mechanics and Mining Sciences & Geomechanics Abstracts, Vol. 15, No. 2, 1978, pp. 53-58. http://dx.doi.org/10.1016/0148-9062(78)91678-9
- Y. Géraud, “Déformation Thermomécanique et Porosité des Roches Granitiques: Evolution des Espaces Poreux,” PhD Thesis, Université de Marseille, Marseille, 1991.
- F Surma, “Détermination de la Porosité de la Zone Endommagée autour d’une Faille. Rôle des Caractéristiques du Matériau (Minéralogie, Structure de Porosité, Caracté- ristiques Physiques) sur les Propriétés d’Echange Fluides Roche,” PhD Thesis, Université Luis Pasteur, Strasbourg, 2003.
- M. Rosener, “Etude Pétrophysique et Modélisation des Effets des Transferts Thermiques entre Roche et Fluide dans le Contexte Géothermique de Soultz-Sous-Forêts,” PhD Thesis, Université Luis Pasteur, Strasbourg, 2007.
- P. Bousquie, “Texture et Porosité des Roches Calcaires,” PhD Thesis, Université Paris VI et Ecole des Mines de Paris, Paris, 1979.
- S. Yagiz, “P-Wave Velocity Test for Assessment of Geotechnical Properties of Some Rock Materials,” Bulletin of Materials Science, Vol. 34, No. 4, 2011, pp. 947-953. http://dx.doi.org/10.1007/s12034-011-0220-3
- M. Khandelwal, “Correlating P-Wave Velocity with the Physico-Mechanical Properties of Different Rocks,” Pure and Applied Geophysics, Vol. 170, No. 4, 2013, pp. 507- 514. http://dx.doi.org/10.1007/s00024-012-0556-7
- A. Boulanouar, A. Rahmouni, M. Boukalouch, Y. Géraud, I. El Amrani El Hassani, M. Harnafi and M. J. Sebbani, “Corrélation entre la Vitesse d’Onde P et la Conductivité Thermique des Matériaux Hétérogènes et Poreux,” MATEC Web of Conferences, Vol. 2, No. 05004, 2012, pp. 1-7. http://dx.doi.org/10.1051/matecconf/20120205004
- S. Kahraman, “The Correlations between the Saturated and Dry P-wave Velocity of Rocks,” Ultrasonics, Vol. 46, No. 4, 2007, pp. 341-348. http://dx.doi.org/10.1016/j.ultras.2007.05.003
- Y. Guéguen and V. Palciauskas, “Introduction à la Physique des Roches,” Editeurs des Sciences et des Arts, Heremann, Paris, 1992, pp. 168-169.
- O. A. Oghenero, “Acoustic Velocity Properties of Danian Limestone Section Exposed at the Curfs Quarry, Southeastern Netherlands,” Journal of Geology and Mining Research, Vol. 4, No. 4, 2012, pp. 65-74.
- R. Ezzdine, “Endommagement des Monuments Historiques en Maçonnerie,” PhD Thesis, Université Bordeaux 1, Bordeaux, 2009.
- D. Han, A. Nur and D. Morgan, “Effects of Porosity and Clay Content on Wave Velocity in Sandstones,” Geophysics, Vol. 51, No. 11, 1986, pp. 2093-2107. http://dx.doi.org/10.1190/1.1442062
- T. Klimentos, “The Effect of Porosity—Permeability-Clays Content on the Velocity of Compressional Waves,” Geophysics, Vol. 56, No. 12, 1991, pp. 1930-1939. http://dx.doi.org/10.1190/1.1443004
NOTES
*Corresponding author.