International Journal of Geosciences
Vol.4 No.7(2013), Article ID:36956,12 pages DOI:10.4236/ijg.2013.47100
New Structural Elements in Tellian Foreland Domain of the Northeastern Tunisia (Mateur Plain) after Integrating Geological and Geophysical Data
1Georessources Laboratory, Water Researches and Technologies Centre, Borj Cedria Ecopark, Soliman, Tunisia
2Department of geology, Faculty of Sciences of Tunis, University Tunis El Manar, Manar II, Tunisia
Email: *alyahyaouisofien@yahoo.fr
Copyright © 2013 Sofien Alyahyaoui et al. This is an open access article distributed under the Creative Commons Attribution License, which permits unrestricted use, distribution, and reproduction in any medium, provided the original work is properly cited.
Received April 5, 2013; revised May 2, 2013; accepted June 8, 2013
Keywords: Northeastern Tunisia; Wells; Bouguer Gravity; Upward Continuation; Seismic Lines; Lineaments
ABSTRACT
The following paper presents an integrated geological (field observations, wells data) and geophysical data (Gravity measurements and seismic profiles) in Tellian foreland domain of the northeastern Tunisia (Mateur plain) served for a new proposed structural map with many faults already recognized or supposed by traditional structural studies and highlights major regional accidents.
1. Introduction
Three-dimensional view of the Tellien foreland domain, situated at the oriental extremity of the western Mediterranean region, shows a various elevation between lowlands (near 0 - 50 m) (Mateur Basin, Ichkeul lowlands, Bizerte Lake and El Mabtouha lowlands) and mountains (near 800 - 1200 m) (J. Ichkeul, J. Kechabta, diapirs Baouala-sakkak, El Alia, Kef cheggaga and Bechateur). The study area (Figures 1 and 2) is characterized by the presence of anticlines with curved axes at several direction such as NE-SW striking like Jebel Messeftine and Jebel Kechabta. We can note also some anticlines associated with Triassic salt tectonics, like Jebel Lansarine, Jebel Baouala and Jebel Sakkak. The study area (Figures 1 and 2) is characterized also by board synclines with NE-SW direction curved axes such as Mateur region and El Mabtouha Lowlands. These structures (anticline and synclines) and faults, characterized by different directions of axes (Figures 1 and 2), remain a matter of debate. Several directions of these faults have contributed to generate the complex geometry [1-23].
2. Geological Setting and Structural Setting
This study focuses on the Northeastern Tunisian Atlas Mountains. This region is affected by folds and faults. The structural style of Northeastern Tunisia is characterized by folds and faults at several directions E-W, N-S, NE-SW and NW-SE. The lithostratigraphic units of Mesozoic and Cenozoic (Figures 2 and 3) of Northeastern of Tunisia are derived from the geological mapping scale 1/500,000 [24]. The major series in this region extend from Triassic to Quaternary. The Triassic strata is composed by gypsum, shale and dolostones recognized in outcrops logs (Jebel Lansarine, Jebel Baouala, Jebel Fernane and Jebel sakkak) and dolostones and rare thin limestones beds determined in the well petroleum W5. The Jurassic strata outcropping in the Jebel Ichkeul, composed by limestones and dolostones, is subdivided to four units [26,27]. The Early Cretaceous strata lithologies are composed essentially by marl, clay and thin carbonates and marls intercalations determined in the well petroleum W7. The Late Cretaceous lithologies vary from carbonate and shale outcrops. The Paleocene (El Haria Formation) is formed by marl and rare intercalation limestones beds. The Eocene strata are represented by limestone and shale. The Oligocene to Early Miocene sandstones are observed only in the extreme northwest part of Menzel Bourguiba town. The Miocene strata are composed essentially by marl, clay, gypsum and sandstones beds [28]. The Pliocene deposits are composed essentially by marl and sandstones [28].
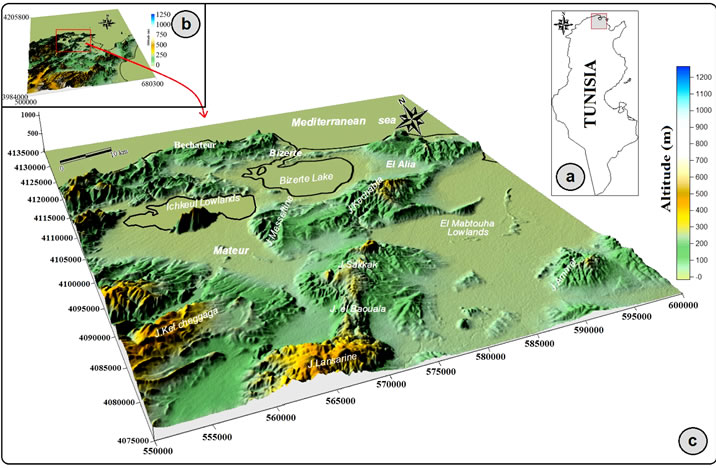
Figure 1. Location of the study area. (a) and (b) Location of study area in Northeastern Tunisia. (c) Digital elevation model of study area.
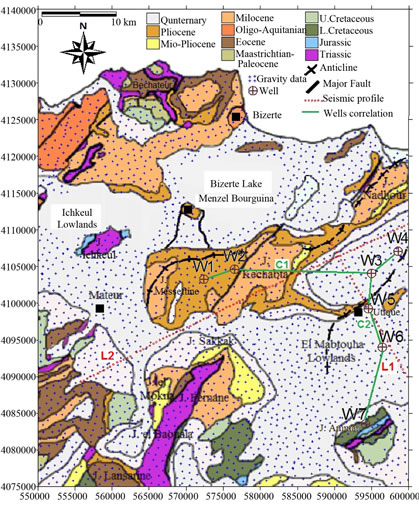
Figure 2. Simplified geological map of the study area 1:500,000. (+) Location of the gravity data. W1 (El Haroune 3 well), W2 (Ain Ghelal well), W3 (Basse Majerda a well), W4 (Sidi Hassoune 1 well), W5 (Utique 1 well), W6 (Basse Majerda b well) and W7 (Jebel Ahmar1 well) are drillhole locations. C1 and C2 correlations of the drillhole. L1 and L2 seismic reflection profiles.

Figure 3. Lithostratigraphic chart of the north Tunisia showing stratigraphic series in the study area [25].
The Quaternary deposits are composed by continental sediments related to depocenters. The lithostratigraphic chart of the Northeastern Tunisia shows also lateral facieses changes and variable thickness of Mesozoic and Cenosoic deposits in the study area (Figure 3).
3. Borehole Data Correlation and Analysis
The borehole data consist of four petroleum wells (W1 (El Haroune 3), W2 (Ain Ghelal), W4 (Sidi Hassoune 1) and W5 (Utique 1)) and hydrogeological wells (W3 (Basse Majerda a), W6 (Basse Majerda b) and W7 (Ahmer 1)) obtained from the “Entreprise Tunisienne des Activités Pétrolières” (ETAP) and the “Société de Recherches et d’Exploration des Pétroles en Tunisie” (SEREPT) (Figures 4 and 5). The drillholes location is shown in Figure 2.
The correlation wells C1 oriented approximately West-East (Figure 4) between W4, W3,W5,W6 and W7 shows thickness variation of Mesozoic and Cainozoic units. Correlation of wells W1 to W2 shows also a dis-
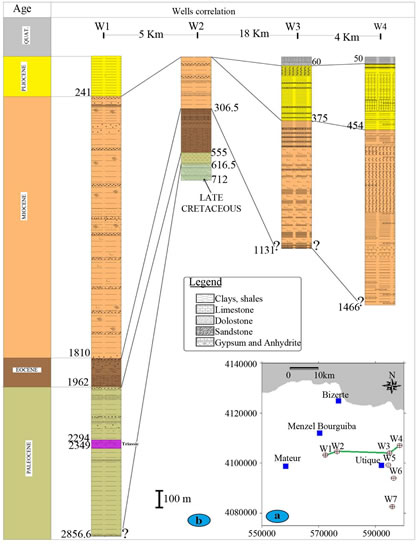
Figure 4. (a) Localisation correlation of the drillhole C1 in the study area; (b) Lithostratigraphic correlation through petroleum, hydrogeological wells, oriented approximately West-East correlation wells C1 between W1 (El Haroune 3), W2 (Ain Ghelal), W3 (Basse Majerda a) and W4 (Sidi Hassoune 1), showing differential variation in thickness of Mesozoic to Cenozoic strata, across main uplifts and synclines in the Northeastern Tunisia.
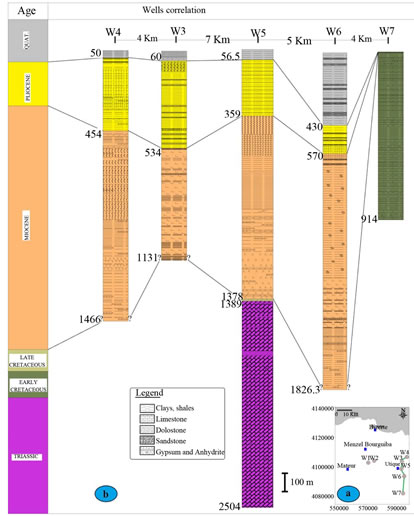
Figure 5. (a) Localisation correlation petroleum wells C2 in the study area; (b) Lithostratigraphic correlation through peutroleum and hydrogeological wells, oriented approximately North-South correlation wells C2 between W4 (Sidi Hassoune 1), W3 (Basse Majerda a), W5 (Utique 1), W6 (Basse Majerda b) and W7 (Jebel Ahmar1) across main synclines and uplifts in the Northeastern Tunisia, showing differential variation in thickness of Mesozoic to Cenozoic strata.
appearance of the Quaternary and Pliocene units; reduce of thickness Miocene unit from 1579 m (W1) to 306.5 (W2); a decrease of the Paleocene unit thickness from 994.6 m (W1) to 71.5 m (W3). Correlation of wells W2 to W4 shows the increase thickness Pliocene and Miocene units and lateral facieses changes of these series (from clay to sand deposits).
The Correlation wells C2 oriented approximately North-South (Figure 5) between W4, W3, W5, W6 and W7 shows variable thickness of Pliocene in wells W3 to W6 and lateral facieses changes of Miocene and Pliocene series.
The Correlation of wells C1 and C2 shows lateral facieses changes and variable thickness of Pliocene and Miocene deposits related to uplifts structures (part West of Jebel Kechabta (W2) and Jebel Ammar (W7) and synclines structures (part East of Jebel Messeftine (W1) and El Mabtouha lowlands (W6) and north Utique city (W3 and W4) in the East part of the study area. This uplifts and synclines structures are bordered by faults system with several striking.
4. Geophysical Data
4.1. Data Gravity Analysis and Interpretation
The present study is based on qualitative and quantitative analysis of the gravity data to delineate both deep and shallow basement structures in the study area.
The gravity data used for this study were obtained from the Office National de Mine (ONM). All the data were merged and reduced using the 1967 International Gravity formula. Free Air and Bouguer gravity corrections were made using sea level as a datum and 2.34 g/cm3 as a reduction density. The gravity anomaly data were gridded at 1km spacing and contoured to produce a Bouguer gravity anomaly map.
For gravity field, it is commonly used to upward continue the data in order to determine regional anomaly patterns. To determine the regional gravity anomaly, upward continued the Bouguer gravity field. The resulting Residual gravity map (Bouguer gravity field minus Regional gravity field) shows some well defined structures. Detailed inspection allows us to identify, in the study region, some new regional-scale features which represent significant basement discontinuities that have controlled the tectonic setting and the subsidence history in the region.
The complete Bouguer gravity anomaly (Figure 6) shows a regional variation in the Northeastern Tunisia ranged from −4 mGal (negatives anomalies) to 36 mGal (positive anomalies). These gravity anomalies are related to crustal thickness [29,30], thick piles of low-density sedimentary rocks [20,31], and lithospheric thickness or densities [32].
The Bouguer anomaly map (Figure 6) shows five gravity lows situated over depression zones with recent Cainozoic-Quaternary series and five gravity highs, associated with Mesozoic series uplifts. We can distinguish:
1) Low-gravity anomalies (negative anomalies) 1 to 5: associated with the low density sediments (clay, thin sand beds and gypsum) are showed in Jebel Messeftine (1), extreme south-western part of study area (2), southeast part of Jebel 2) High-gravity anomalies (positive anomalies): 6 to 10 associated with high density sediments (dolostones and limestones) are showed in Bechateur region (6), Jebel Ichkeul and Mateur region (7), west part of Jebel Nadhour (8), Jebel Ammar (9) and west part of Jebel Lansarine (10).
Baouala (3), south part of Jebel Ammar (4) and south part of Utique region (5).
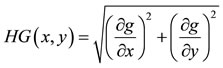
The horizontal derivative of Bouguer gravity field maps at several directions: N0 (a), N90 (b), N45 (c), N135 (d) show several lineaments (Figure 7).
The Horizontal Gradient is a simple approach to locate
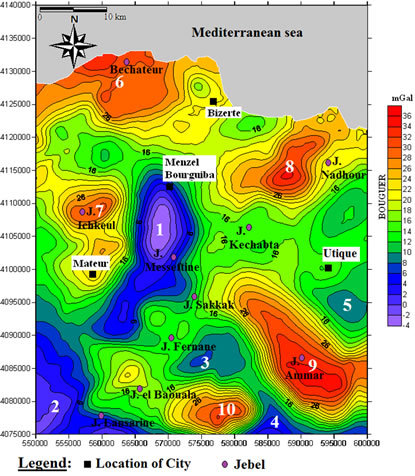
Figure 6. Bouguer anomaly map of the study area. Contour interval = 2 mGal. Black solid rectangles are the locations of major cities. Mauve solid circle are the locations of major mountains (Jebel). 1 to 5 negatives anomalies. 6 to 10 positives anomalies.
linear structures, such as contacts and faults from potential field data. The Horizontal Gradient Magnitude (MGH) is calculated using north-south and east-west directional derivations. The Horizontal Gradient Magnitude (MGH) method has been used intensively to locate contacts of density contrast from gravity data [33] and the squared magnitude of the horizontal gravity gradient HG (x,y) is given by Equation (1) :
The partial derivatives of gravity with respect of the x and y directions were obtained in the wave number domain following described [34,35] stated that the horizontal gradient of gravity anomaly because it trends to place narrow ridges over edges of abrupt changes in density [36,37]. The procedure HMG, which is illustrated the location of the maxima of the horizontal derivative defined on a regular grid by comparing the value at a centre point of a 3 × 3 grid window to the surrounding eight points along four main directions: horizontal, vertical, and both diagonals.
Peaks in the horizontal gradient magnitude of gravity field are used to locate the vertical contacts (Figures 8(a) and (b)) and estimate their strike directions (Figure 8(c)).
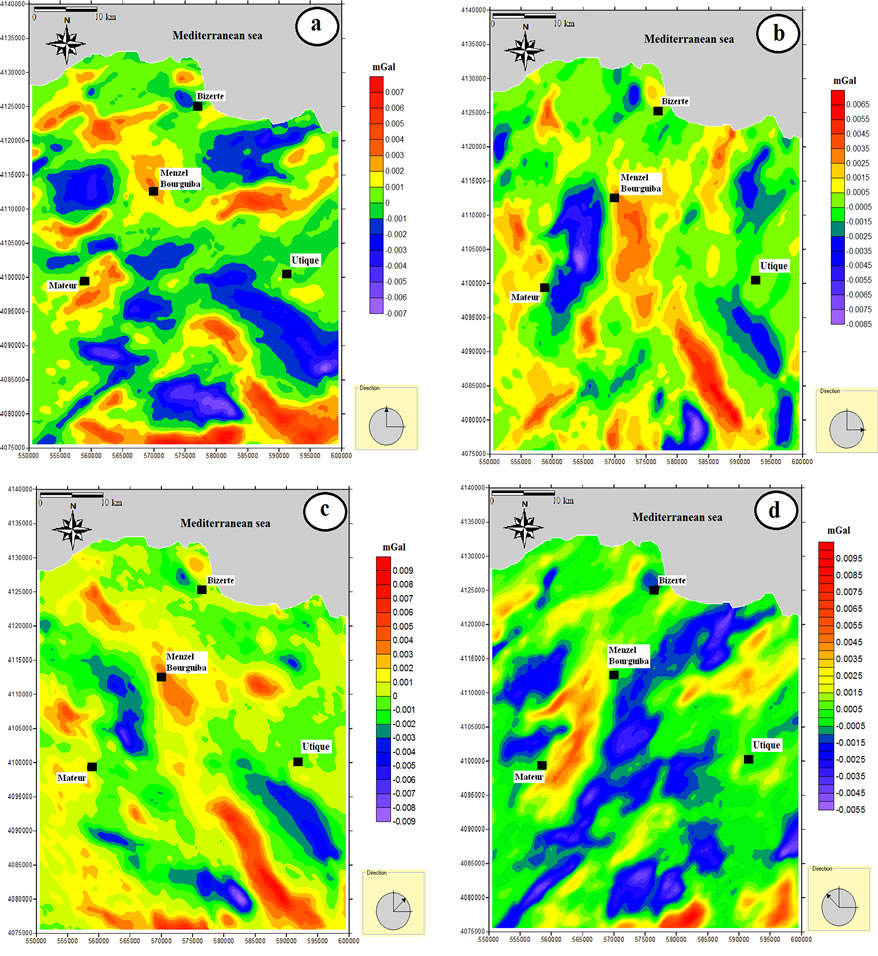
Figure 7. Horizontal derivative of the Bouguer anomaly map of the study area at different directions: N0(a), N90 (b), N45(c) and N135(d). Contour interval = 0.001 mGal. Black solid rectangles are the locations of major cities.
The horizontal gradient magnitude is also robust to delineation either shallow comparison with the vertical gradient, which is useful only for the shallower structures.
Figure 9 represents the superimposition of Horizontal gravity gradient (HGG) and this map shows alignments outlining the contacts. The several faults determined by geophysical analysis are interpreted as lineaments oriented E-W, N-S, NE-SW and NW-SE.
The Bouguer anomaly map is really constituted by two regional and residual fields. The regional term remains rather subjective. For our study, one has no information on the shape and the depth of the substratum. The selection of the degree of the polynome of regional anomaly
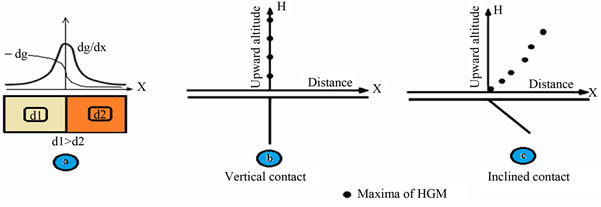
Figure 8. (a) The horizontal gradient anomaly (dg/dx) due to a vertical contact between two different bodies of different densities (d1 and d2). g is the gravity anomaly; (b) Location of the Horizontal Gradient Magnitude (HGM) maximum at different elevations due to a vertical density contact; (c) Location of the Location of the Horizontal Gradient Magnitude (HGM) maximum at different elevations due to a dipping density contact. The HGM maximum changes its horizontal location toward the dip direction (adapted after [37]).
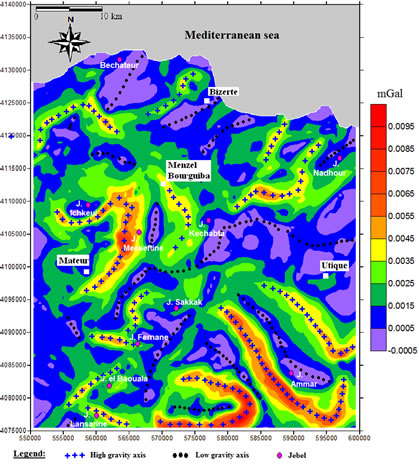
Figure 9. Horizontal gravity gradient map of the Bouguer anomaly Residual anomaly map of the study area. Contour interval = 0.001 mGal. White solid rectangles are the locations of major cities. pink solid circle are the locations of major mountains (Jebel).
map is based on the upward continuation (Figure 10).
Figure10 shows the Bouguer anomaly and its upward continuation at several heights, from 500 m (Figure 10(a)) to 20,000 m (Figure 10(h)). The upward continuation of Bouguer gravity field at 20,000 m map (Figure 10(h)) represents the regional gravity field of the study area because the gravity effect of the most prominent structure related to the Jebel Ammar anticline disappear totally.
Figure 11 shows the distribution from the horizontal derivative of the Bouguer anomaly and its upward continuation at several heights, up to 500 m to 20,000 m. These maxima represent the major deep contacts in the study area. In the case of a dipping contact, the maxima move down dip with increasing continuation height.
The Euler method has been applied to the residual data using a moving window of 20 m × 20 m. We have assigned several structural index values and found that structural index of 0.25 gives good clustering solutions.
3D form of Euler’s equation can be defined [38] as Equation (2)
where ,
,  and
and  are the derivatives of the field in the x, y and z directions,
 is the structural index value that needs to be chosen according to a prior knowledge of the source geometry. By considering four or more neighboring observations at a time, source location (x0, y0, and z0) and b can be computed by solving a linear system generated from Equation (2). Then by moving the operated window from one location to the next over the anomaly, multiple solutions for the same source are obtained.
Figure 12 shows the results of the Euler deconvolution method from the gravity data. The Euler solutions (Figure 12) indicate that the E-W, N-S, NW-SE and NESW trends characterize the shallower structure setting. The Euler solutions indicate that:
• 33% of contacts where are found to be about 0 to 1000 m.
• 45.4% of contacts where are found to be about 1000 to 2000 m.
• 19.1% of contacts where are found to be about 2000 to 3000 m.
• 2% of contacts where are found to be about 3000 to 4000 m.
• 0.5% of contacts where are found to be about 4000 to 500 m.
These results confirm that the regional-scale faults characterized the shallower structure setting of the Northeastern of Tunisia, probably affected the basement. The proposed model as a mosaic of quadratic blocks
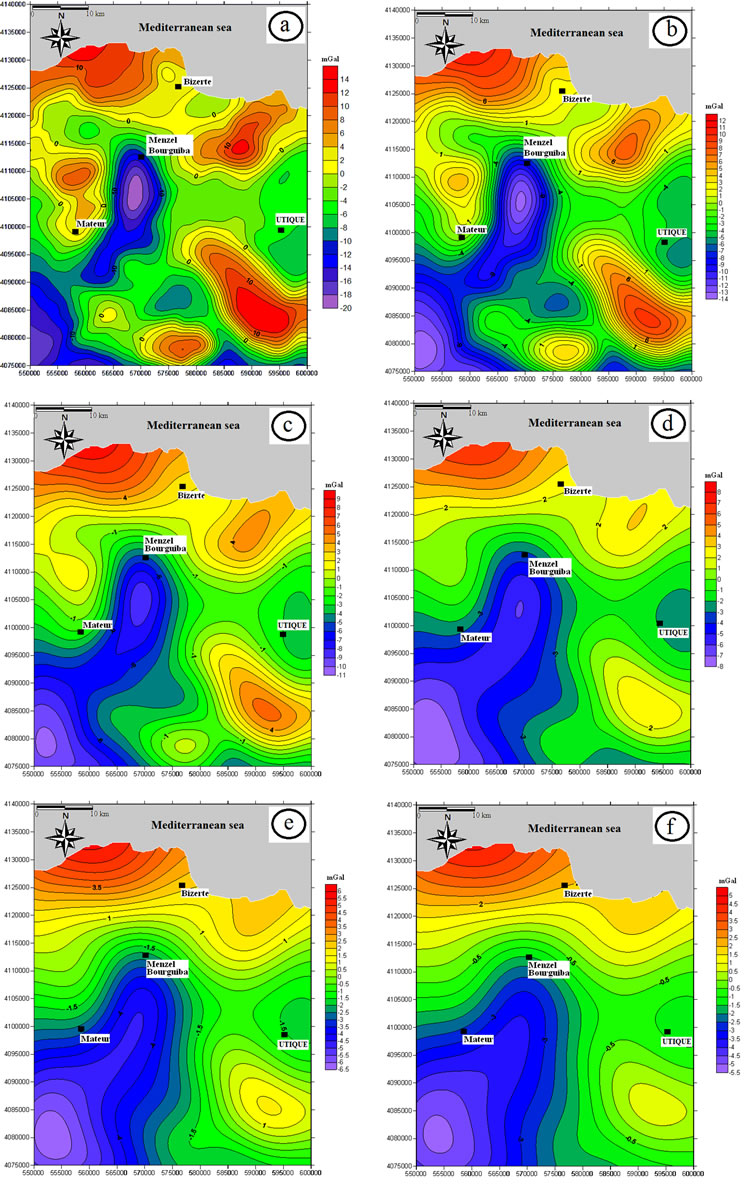
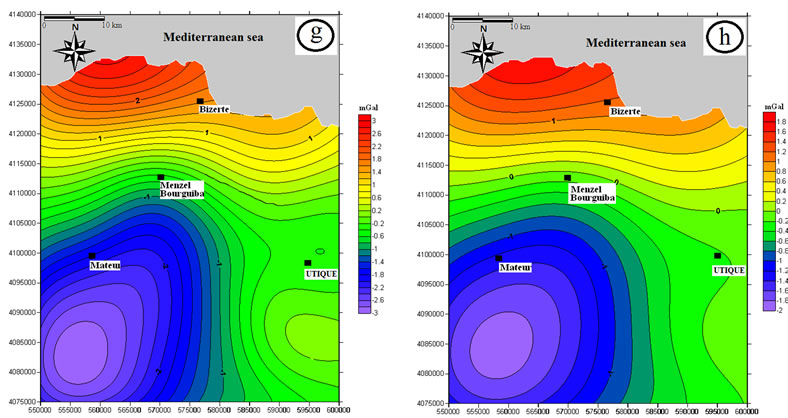
Figure 10. Upward continuation of the Bouguer anomaly maps at several heights: 500 m (a); 2000 m (b); 4000 m (c); 6000 m (d); 8000 m (e); 10,000 m (f); 15,000 m (g) and 20,000 m (h). Black solid rectangles are the locations of major cities.
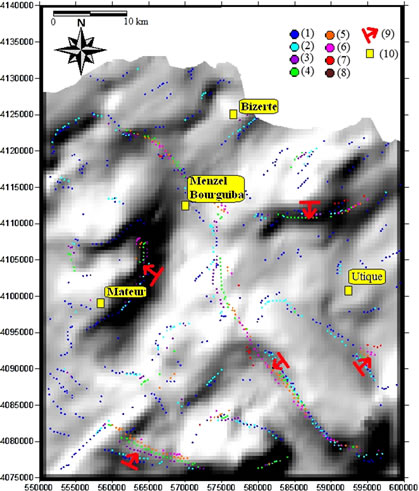
Figure 11. Superposition of the Residual gravity map (gray background) to the Horizontal gradient maxima of the Bouguer anomaly and its upward continuations to different heights: 500 m (1); 2000 m (2); ![]() 4000 m (3); 6000 m (1); 8000 m (5); 10,000 m (6); 15,000 m (7) and 20,000 m (8). (9) Dipping direction. (10) Locations of the major cities.
4000 m (3); 6000 m (1); 8000 m (5); 10,000 m (6); 15,000 m (7) and 20,000 m (8). (9) Dipping direction. (10) Locations of the major cities.
bounded by probably deep basement E-W and NW-SE faults characterized the deep structural scheme of the study area.
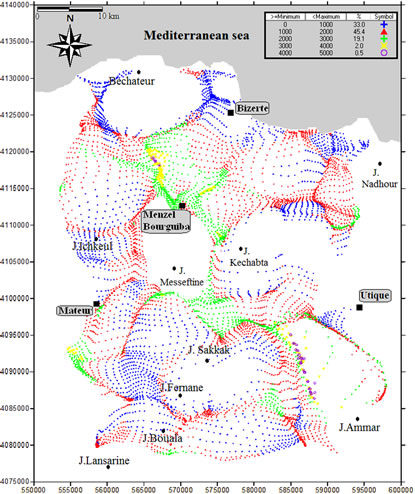
Figure 12. Euler solutions from the Bouguer gravity data. Black solid rectangles are the locations of major cities. Black solid circle are the locations of major mountains (Jebel).
4.2. Interpretation of Seismic Profiles
In the study area, the Mesozoic and Cenozoic deposits is based on seismic interpretation of 2D seismic reflection lines (L1 and L2 (Figure 2)) are obtained by ETAP company. The migrated seismic reflection lines were analyzed to determine correlations between stratigraphic horizons correlated from the boreholes W1 to W6 and seismic reflection marks.
The NW-SE Residual gravity profile L1 (Figure 13(a)), Horizontal gravity gradient (HGG) profile L1 (Figure 13(b)) and interpretation seismic profile L1 (Figures 13(c) and (d)) showing some results:
-The major deep faults at several direction affected Mesozoic and Cenozoic deposits;
-Important thickness of Miocene and Pliocene deposits;
-Lateral facieses change; the thickness of the Pliocene deposit varies on both sides of the basin in the part north of Utique region and the thickness of the Miocene deposits reduced towards the El Mabtouha Lowlands.
The NE-SW Residual gravity profile L2 (Figure 14(a)), Horizontal gravity gradient (HGG) profile L2 (Figure 14(b)) and interpreted seismic profile L2 (Figures 14(c) and (d)) showing:
• The presence of depressions (syncline) in Utique region and Southwestern part of Mateur region;
• The uplifts zones in Jebel Kechabta and southeastern part of Mateur region;
• The uplifts and depression structures are controlled by major deep faults at several directions;
• Thick Miocene unit deposits;
• Thin Miocene deposits towards the Utique region and southwestern part of Mateur region.
The interpretation of two seismic profile L1 and L2 reveals that the uplifts are limited by listric deep normal faults and reverse fault at several direction (Figures 13 and 14) and Thickness variation of the and lateral facieses change of Mesozoic and Cenozoic deposit. These listric faults delimited the study region in different blocks. The Southeastern part of Mateur region block is marked by eventail configuration (Figure 14) attesting for tilted blocks geometry as a consequence of normal component movement of limited listric faults during Miocene.
5. Conclusion
Integration surface data (Geological maps analysis) and subsurface data (correlation wells, gravity data and seismic reflection profiles) provide us information to identify the geometry and the structural style of folding structures and lineament at several directions (Figure 15): E-W (L1
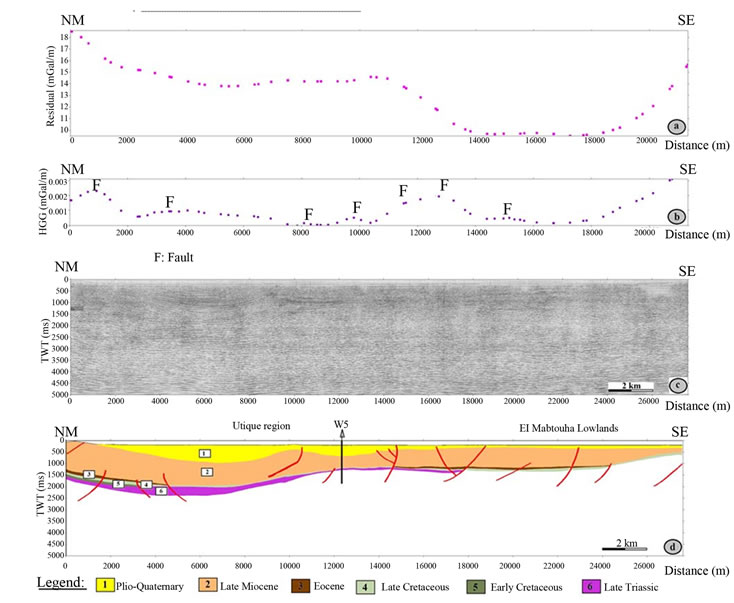
Figure 13. (a) Residual gravity anomaly profile L1; (b) Horizontal gravity gradient (HGG) profile L1 proving the principal faults of profile L1; (c) and d Interpretation seismic profile L1.
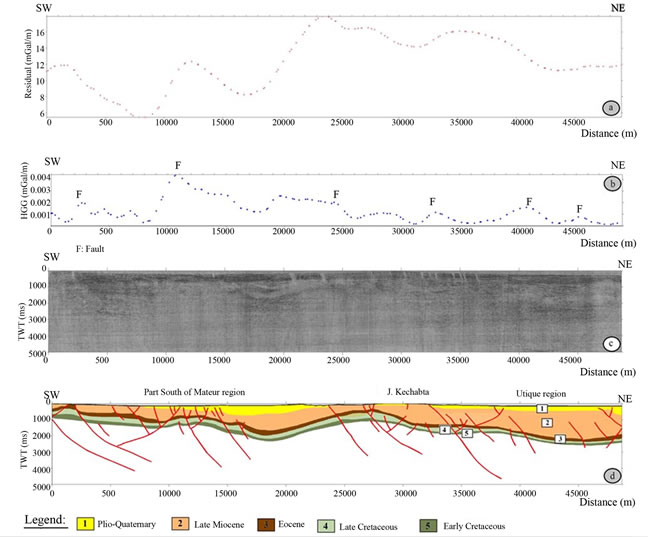
Figure 14. (a) Residual gravity anomaly profile L2; (b) Horizontal gravity gradient (HGG) profile L2 proving the principal faults of profile L2; (c) and d Interpretation seismic profile L2.
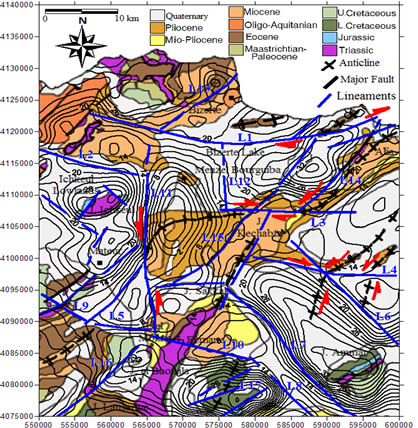
Figure 15. Major lineaments and residual map overlaying geological map at scale 1:500,000 of the study area. Black solid rectangles are the locations of major cities.
(L6 to L10), N-S (L11 and L12) and NE-SW (L13 to L17). These structures and lineaments (faults) are essential for understanding the evolution of the deformation to L5), NW-SE that affected the Mesozoic and Cenozoic deposits.
6. Acknowledgements
We express our appreciation to the ETAP petroleum society of Tunisia for support and access to subsurface data (seismic reflection sections and wells). We wish to thank the SEREPT petroleum society (Tunisian Company for Oil Research and Exploitation) for providing petroleum wells data.
REFERENCES
- H. Rouvier, “Géologie de l’Extrême Nord-Tunisien,” Thesis, Université Pierre et Marie Curie, Paris, 1977, 1000p.
- N. Ben Ayed, “Evolution Tectonique de l’Avant-Pays de la Chaîne Alpine de Tunisie du Début du Mésozoïque à l’Actuel,” Thèse Doctorat, Université Paris Sud Orsay, Paris, 1986, 327p.
- F. Zargouni, “Tectonique de l’Atlas Méridional de Tunisie, Évolution Geometrique et Cinematique des Structures en Zone de Cisaillement,” Thèse Doctorat, University of Tunis, Tunis, 1986, 304p.
- H. Zouari, M. M. Turki and J. Delteil, “Nouvelles Données sur L’évolution Tectonique de la Chaîne de Gafsa,” Bulletin de la Societe Geologique de France, Vol. 6, 1990, pp. 621-628.
- H. Zouari, “Les Variations Géométriques du Plissement Liées à la Cinématique Coulissante en Relais des Accidents Préexistants: Exemple de l’Atlas Méridional de Tunisie,” Comptes Rendus de l’Académie des Sciences, Vol. 314, No. 7, 1992, p. 699-702.
- N. Boukadi, “Structuration de l’Atlas de Tunisie, Signification Géométrique et Cinématique des Noeuds et des Zones D’interférences Structurales au Contact de Grands Couloirs Tectoniques,” Thèse ès Sciences, Université Tunis II, Tunisie, 1994, 249 p.
- M. Dlala and S. Rebai, “Rélation Compression/Extension Miocéne Supérieur à Quaternaire en Tunisie,” Comptes Rendus de l’Académie des Sciences, Vol. 319, No. 8, 1994, pp. 945-950.
- M. Bédir, “Mécanismes Géodynamiques des Bassins Associés aux Couloirs de Coulissement de la Marge Atlasique de la Tunisie,” Thèse Doctorat, Université Tunis II, Tunis, 1995, 416 p.
- L. Chihi, “Les Fossés Néogènes à Quaternaires de la Tunisie et de la Mer pélagienne: Étude Structurale et Leur Signification Dans le Cadre Géodynamique de la Méditerranée Centrale,” Thèse Doctorat ès Science, Université Tunis II, Tunis, 1995, 566p.
- M. Dlala, “Evolution Géodynamique et Tectonique Superposées en Tunisie; Implications sur la Tectonique Récente et la Sismicité,” Tunis II, 1995.
- H. Zouari, “Evolution Géodynamique de l’Atlas CentroMéridional de la Tunisie: Stratigraphie, Analyse Géométrique, Cinématique et Tectono-Sédimentaire,” Thèse doctorat Es Sciences, University of Tunis, 1995, 278p.
- H. Zouari, M. M. Turki, J. Delteil and J. F. Stephen, “Tectonique Transtensive de la Paléomarge Tunisienne au Cours de l’Aptien-Campanien,” Bulletin de la Société Géologique de France, Vol. 170, No. 3, 1999, p. 295-301.
- S. Bouaziz, E. Barrier, M. Soussi, M. M. Turki and H. Zouari, “Tectonic Evolution of the Northern African Margin in Tunisia from Paleostress Data and Sedimentary Record,” Tectonophysics, Vol. 357, No. 1-4, 2002, pp. 227-253. doi:10.1016/S0040-1951(02)00370-0
- C. Abbes, “Structurations et Evolutions TectonoSédimentaires Mésozoïques et Cénozoïques, Associées Aux Accidents Reghmatiques, à la Jonction des Marges Téthysienne et Nord-Africaine (Chaîne Nord-Sud, Tunisie Centrale),” Thèse ès Sciences, Université Tunis El Manar, Tunisie, 2004, 440p.
- J. Kacem, “Etude Sismotectonique et Evaluation de l’Alea Sismique Régional du Nord-Est de la Tunisie: Apport de la Sismique Réflexion Dans l’Identification des Sources Sismogeniques,” Thèse, University of Tunis El Manar, Fac.Sci.Tunis, Tunis, 2004, 168p.
- S. Khomsi, “Géodynamique des Bassins Paléogènes et des Réservoirs Associés du Sahel de Kairouan (Tunisie Orientale): Structuration, Sismotectonique et Organisation Séquentielle, Implications Pétrolières,” Thèse Doctorat (Ph.D.), Université Tunis El Manar, Tunisie, 2005, 365 p.
- J. Ouali, “Importance du Réseau Réghmatique Dans la Tectonogenèse de la Tunisie Atlasique à Travers l’Etude de l’Axe Nord-Sud,” Thèse ès Sciences, Université Tunis El Manar, Tunisie, 2007, 399 p.
- L. Mejri, V. Regard, S. Carret, S. Brusset and M. Dlala “Evidence of Quaternary Active Folding near Utique (Northeast Tunisia) from Tectonic Observations and a Seismic Profile,” Tectonophysics, Vol. 342, No. 11, 2010, pp. 864-872.
- F. Melki, T. Zouaghi, M. Ben Chelbi, M. Bedir and F. Zargouni, “Tectono-Sedimentary Events and Geodynamic Evolution of the Mesozoic and Cenozoic Basins of the Alpine Margin, Gulf of Tunis, North-Eastern Tunisia Offshore,” Comptes Rendus Geoscience, Vol. 342, No. 9, 2010, pp. 741-753. doi:10.1016/j.crte.2010.04.005
- H. Gabtni, C. Jallouli, K. L. Mickus and M. M. Turki, “Geodynamics of the Southern Tethyan Margin in Tunisia and Maghrebian Domain: New Constraints from Integrated Geophysical Study,” Arabian Journal of Geosciences, Vol. 6, No. 1, 2011, pp. 271-286. doi:10.1007/s12517-011-0362-z
- F. Melki, T. Zouaghi, S. Harrab, A. Casas Sainz, M. Bédir and F. Zargouni, “Structuring and Evolution of Neogene Transcurrent Basins in the Tellian Foreland Domain, North-Eastern Tunisia,” Journal of Geodynamics, Vol. 52, No. 1, 2011, pp. 57-69. doi:10.1016/j.jog.2010.11.009
- T. Zouaghi, M. Bédir, F. Melki, H. Gabtni, R. Gharsali, A. Bessioud and F. Zargouni, “Neogene Sediment Deformations and Tectonic Features of Northeastern Tunisian: Evidence for Paleoseismicity,” Arabian Journal of Geosciences, Vol. 4, No. 7-8, 2010, pp. 1301-1314. doi:10.1007/s12517-010-0225-z
- L. Mejri, “Tectonique Quaternaire, Paléosismicité et Sources Sismogéniques en Tunisie Nord-Orientale: Etude de la Faille d’Utique,” Doc. Univ. Toulouse., 2012, 184p.
- M. Ben Haj Ali, Y. Jedoui, T. Dali, H. Ben Salem and L. Memmi, “Carte géologique à l’échelle 1/500,000 de la Tunisie,” Ed. Serv. Géol. Tunise, 1985.
- H. El Euchi, “Structural Style and Hydrocarbon Habitat in Northern Tunisia,” The 6th Tunisian Petroleum Exploration Conference, Tunis, 5-9 May 1998.
- R. Alouani, “Le Jurassique du Nord de la Tunisie: Marqueurs Géodynamique d’une Marge Transformante: Turbidites, Radiolarites, Plissement et Métamorphisme,” Thèse 3éme cycle. Univ. Tunis II, 1991, 202p.
- M. Soussi, “Nouvelle Nomenclature Lithostratigraphique ‘Evenementalle’ Pour le Jurrassique de la Tunisie Atlasique,” Geobios Vol. 36, No. 6, 2003, pp. 761-773. doi:10.1016/j.geobios.2003.03.001
- P. F. Burollet, “Etude Géologique des Bassins MioPliocènes du Nord-Est de la Tunisie,” Ann. Mines et Géol., Tunis, (7), 1951, 91p.
- K. L. Mickus and C. Jallouli, “Crustal Structure Beneath the Tell and Atlas Mountains (Algeria and Tunisia) through the Analysis of Gravity Data,” Tectonophysics, Vol. 314, No. 4, 1999, pp. 373-385. doi:10.1016/S0040-1951(99)00225-5
- C. Jallouli and K. L. Mickus, “Regional Gravity Analysis of the Crustal Structure of Tunisia,” Journal of African Earth Sciences, Vol. 30, No. 1, 2000, pp. 63-78. doi:10.1016/S0899-5362(00)00008-7
- B. Tadili, M. Ramdani, D. Ben Sari, K. Chapochnikov and A. Bellot, “Structure de la Croute Dans le Nord du Maroc,” Annales Geophysicae, Vol. 4, No. 1, 1986, pp. 99-104.
- F. Marillier and S. Mueller, “The Western Mediterranean Region as an Uppermantle Transition Zone between Two Lithospheric Plates,” Tectonophysics, Vol. 118, No. 1-2, 1985, pp. 113-130. doi:10.1016/0040-1951(85)90162-3
- L. Cordell and V. J. S. Grauch, “Mapping Basement Magnetization Zones from Aeromagnetic Data in the San Juan Basin,” 52nd SEG Annual Meeting, Society of Exploration Geophysicists, New Mexico, 1982, pp. 246-247.
- W. R. Roest and M. Pilkington, “Identifying Remnant Magnetization Effects in Magnetic Data,” Geophysics, Vol. 58, No. 5, 1993, pp. 653-659.
- R. J. Blakely, “Potential Theory in Gravity & Magnetic Applications,” Cambridge University Press, New York, 1995, 441p. doi:10.1017/CBO9780511549816
- N. Archibald and F. Bochetti, “Multiscale Edge Analysis of Potential Field Data,” Exploration Geophysics, Vol. 30, No. 2, 1999, pp. 38-44. doi:10.1071/EG999038
- L. T. A. Vanié, D. Khattach and M. R. Houari, “Apport des Filtrages des Anomalies Gravimétriques à l’Etude des Structures Profondes du Maroc Oriental,” Bulletin de l’Institut Scientifique, Rabat, Section Sciences de la Terre, 2005, No. 27, p. 29.
- A. B. Reid, J. M. Allsop, H. Granser, A. J. Millett and I. W. Somerton, “Magnetic Interpretation in Three Dimensions using Euler Deconvolution,” Geophysics, Vol. 55, No. 1, 1990, pp, 80-91.
NOTES
*Corresponding author.