International Journal of Geosciences
Vol.3 No.5(2012), Article ID:24955,5 pages DOI:10.4236/ijg.2012.35109
Spatial Distribution of Seismicity: Relationships with Geomagnetic Z-Component in Geocentric Solar Magnetospheric Coordinate System
1Institute of Seismology, Almaty, Kazakhstan
2Institute of Space Techniques and Technologies, Almaty, Kazakhstan
Email: khachikjan@seismology.kz
Received July 21, 2012; revised August 23, 2012; accepted September 23, 2012
Keywords: Earthquake Occurrence; Earthquake Magnitude; Main Geomagnetic Field; Geocentric Solar Magnetospheric Coordinate System
ABSTRACT
For 173,477 epicenters of earthquakes with М ≥ 4.5, which occurred at the globe in 1973-2010, the geomagnetic Zcomponent in Geocentric Solar Magnetospheric (GSM) coordinate system were evaluated for the moment of earthquake occurrence on the base of the International Geomagnetic Reference Field model (IGRF-10). It is found that in the regions, where the ZGSM reaches large positive value (low and middle latitudes), earthquake occurrence is higher than in the regions where ZGSM is mainly negative (high latitudes). In the area of strongest seismicity at the globe, which is located in the longitudinal ranges of about 120˚E - 170˚W, the values of ZGSM are the most high at the globe. It is found that statistically significant dependence, with correlation coefficient R = 0.91, exists between the maximal possible magnitude of earthquake (Mmax) and the logarithm of absolute value of ZGSM. We suggest that earthquake occurrence is triggered by the perturbations, which in first occur at the magnetopause due to reconnection of the magnetic field of the solar wind with the Earth’s magnetic field, and then propagate into the solid earth via the GEC, which is considered at present as a main applicant for a physical mechanism of solar-terrestrial relationships. It is clear that much work remains to further verify this speculative assertion and to find the physical processes linking seismicity with the main geomagnetic field structure.
1. Introduction
From the beginning of the space age, the satellites obtained a lot of evidences on the electromagnetic effects in the near space plasma parameters prior major earthquakes [1]. To explain that findings, an idea was advanced [2] that the generation mechanism of electromagnetic effects of earthquakes is a modification of the electric field in the Global Electric Circuit (GEC) due to earthquake preparation. The classical concept of GEC, firstly suggested in [3], presents a system of stationary electric currents between the ground and the ionosphere driven by the global thunderstorm activity [4]. Recently, the idea of electric coupling between the ionosphere and earthquake region was successfully used in [5] to explain the changes in the natural extremely low-frequency radio noise observed in the topside ionosphere aboard the DEMETER satellite at night, before major earthquakes. As in any electric circuit the electromagnetic perturbation in one region affects another regions, one may speculate that not only the state of near space plasma responds to electromagnetic perturbation in the lithosphere, as it is suggested in [2,5], but and vice versa, the lithosphere responds to electromagnetic perturbation in the near space plasma up to the upper boundary of the GEC. At present, the GEC is considered as a main applicant for the mechanism of solar-terrestrial coupling [4,6], and it is believed [7,8] that its upper boundary may be located at the magnetopause, where the reconnection of the solar wind magnetic field with the earth’s magnetic field occur. The effectiveness of magnetic reconnection [9] depends on value and orientation of Z- components in both the solar wind magnetic field and Earth’s magnetic field as estimated in the Geocentric Solar Magnetospheric (GSM) coordinate system [10]. The most effective reconnection occur when the ZGSM-component for solar wind magnetic field is large and negative, while the geomagnetic ZGSM-component is large and positive [9]. As the geomagnetic ZGSM-component shows noticeable spatial and temporal variations, we check up in present paper if a pattern of spatial variation of seismicity shows any similarity with a pattern of spatial variation of geomagnetic ZGSM-component. It is found that the largest amount of earthquakes occur in the regions where the geomagnetic ZGSM-component reaches large positive value.
2. Data and Method
In this study, we use the data on earthquakes with magnitude М ≥ 4.5 occurred at the globe in 1973-2010 years (173477 events) from the global seismological catalogue NEIC [11]. For the each of the epicenters, the components of the main geomagnetic field in Geocentric Solar Magnetospheric (GSM) coordinate system were calculated with using the FORTRAN subroutines Geopack- 2008 [12], which are based on the International Geomagnetic Reference Field model (IGRF-10) [13]. Geomagnetic field components (XGSM, YGSM, and ZGSM) were calculated exactly for point of the epicenter and exactly for the time of earthquake occurrence. In GSM coordinate system [10] the X-axis points from the Earth towards the Sun. The Z-axis (positive) is perpendicular to the X-axis and parallel to the projection of the negative dipole moment on a plane perpendicular to the X-axis (the northern magnetic pole is in the same hemisphere as the tail of the magnetic moment vector). The Y-axis completes a right-handed coordinate system. It is defined to be perpendicular to the Earth’s magnetic dipole so that the X-Z plane contains the dipole axis. Since the Y-axis is perpendicular to the dipole axis, it is always in the magnetic equator and since it is perpendicular to the Earth-Sun-line, it is in the dawn-dusk meridian (pointing towards dusk). The GSM coordinate system rocks about the solar direction with a 24 hour period in addition to a yearly period due to the motion of the Earth about the Sun. As a result, for any particular geographical point, the geomagnetic components in GSM coordinate system vary in the course of day and year.
Since for the magnetic reconnection the most important is the value of ZGSM [9], in this study we analyze only the behavior of ZGSM-component (ZGSM here and after). To visualize the spatial and temporal ZGSM variations, the test calculations have been performed. For this purpose, ZGSM values were calculated for each hour and each month of 2005 year at geographical latitudes: 90˚S, 60˚S, 30˚S, 0˚, 30˚N, 60˚N, and 90˚N at four longitudes: 0˚, 180˚, 90˚W and 90˚E. In Figure 1, we present, as an example, the ZGSM values for each hour and each month at geographical equator (latitude 0˚) for two longitudes: 90˚W and 90˚E (a, b, respectively).
It is seen from Figure 1 that at the geographical equator, the ZGSM values are always positive but vary noticeably from hour to hour, and from month to month, and reach more high values in the eastern hemisphere (90˚E) in comparison with the western hemisphere (90˚W). Figure 2 presents latitudinal variation of the mean ZGSM
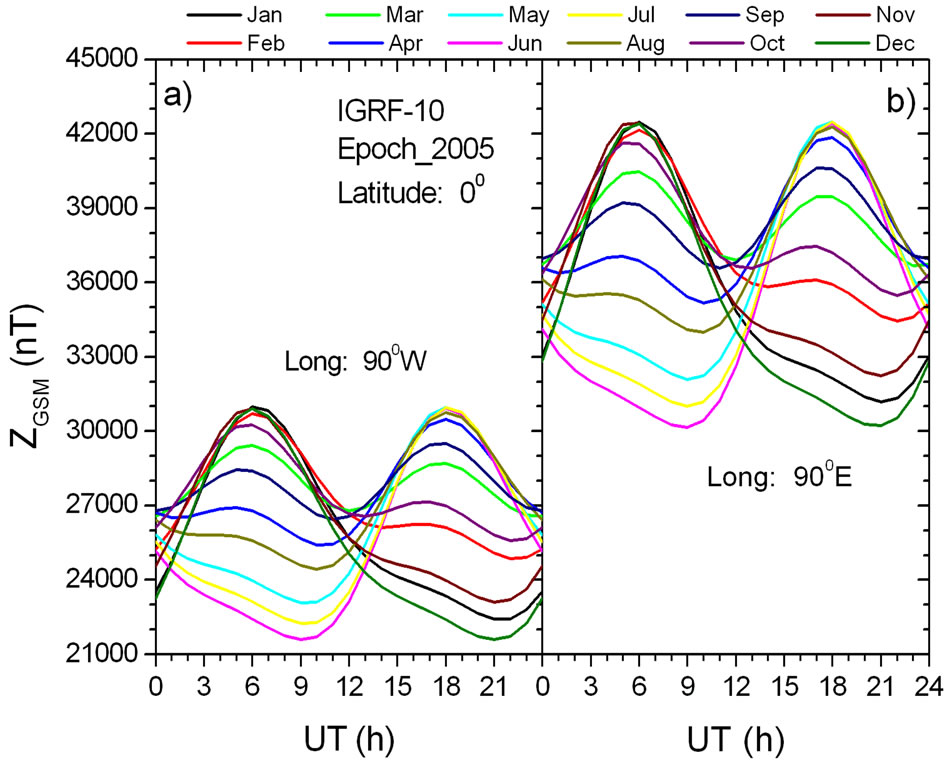
Figure 1. Test calculations: the diurnal variations of geomagnetic ZGSM-component for different months at earth’s surface at latitude 0˚, longitudes 90˚W and 90˚E (a, b, respectively) for 2005 year, calculated with help of computer codes Geopack-2008 [12].
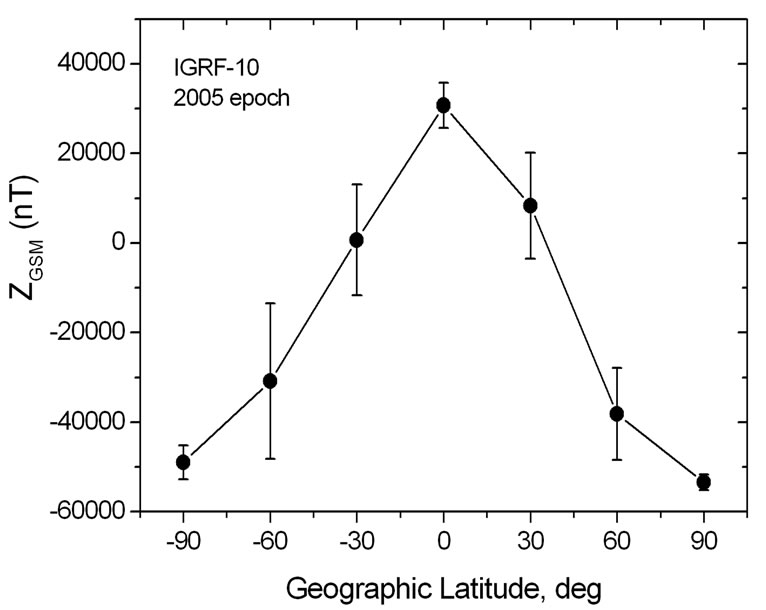
Figure 2. Test calculations: the latitudinal variation of the mean ZGSM values for 2005 year calculated with help of computer codes Geopack-2008 [12]. Vertical bars show standard deviations with percentile 95.
value calculated for 2005 year. Vertical bars show standard deviations with percentile 95.
It is seen from Figure 2 that at low latitudes (30˚S - 30˚N), the mean ZGSM values are positive, while they are negative at high latitudes. The ZGSM component has also secular variation (not shown) which is in agreement with the secular variation of the main geomagnetic field, which is included in the IGRF-10 model, but this variation is not so appreciated as those ones presented in Figures 1 and 2.
3. Results
3.1. Does the Earthquake Counts Depend on Geomagnetic ZGSM?
Let us consider the composed Figure 3, where the panel
 (a)
(a)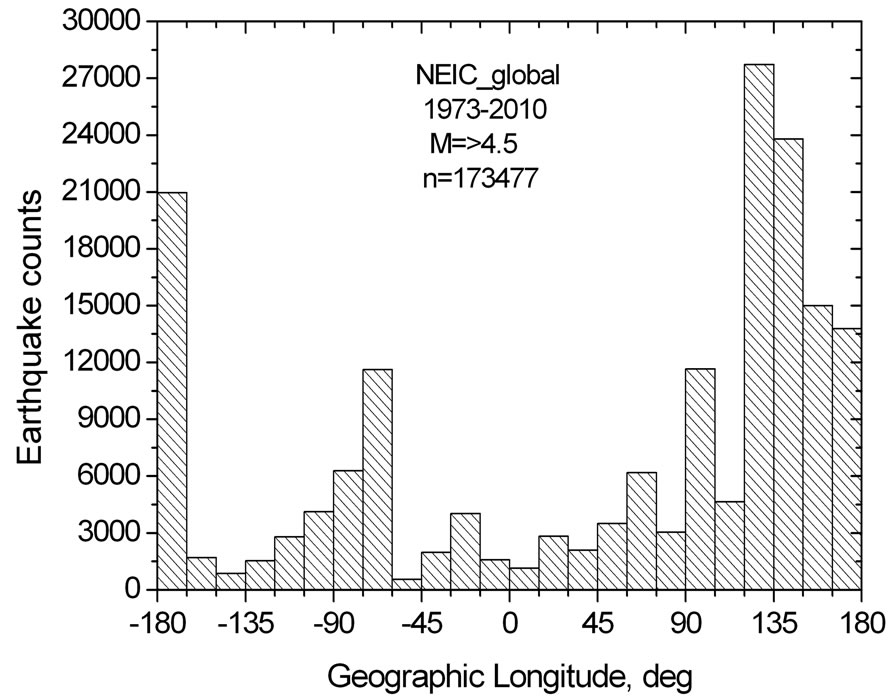 (b)
(b)
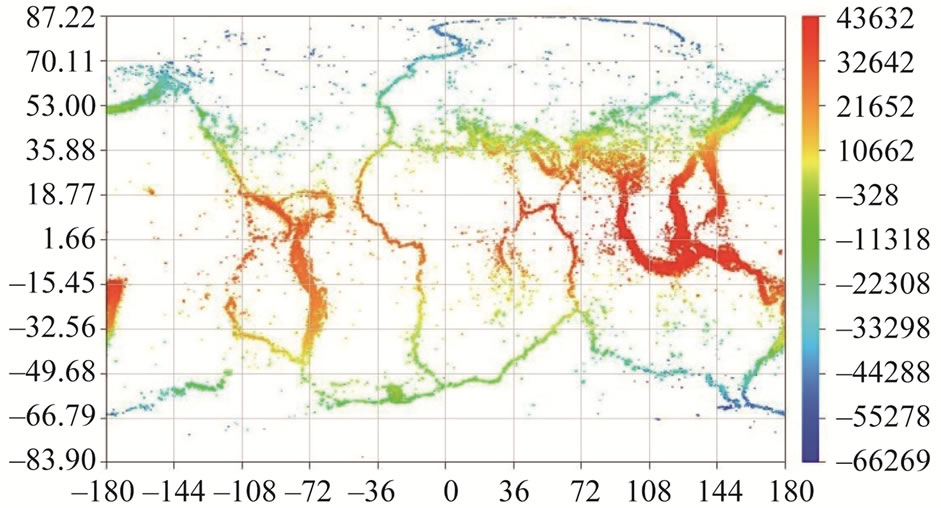
Figure 3. (a) The map of epicenters of earthquakes with magnitude М ≥ 4.5 occurred at the globe in 1973-2010 years (173477 events) from the global seismological catalogue NEIC [11], where the color corresponds to value of geomagnetic ZGSM-component in the point of epicenter in the moment of earthquake occurrence, as calculated by Geopack- 2008 [12]; (b) The histogram for longitudinal distribution of number of earthquakes presented in (a).
(a) presents the map of epicenters of earthquakes with magnitude М ≥ 4.5 occurred at the globe in 1973-2010 years (173477 events) from the global seismological catalogue NEIC [11], and the panel (b) shows the histogram for longitudinal variation of seismicity (number of earthquakes) obtained on the base of 173477 events presented at the panel (a).
Different colors of epicenters correspond to different values of the geomagnetic ZGSM-component in the point of epicenter in the moment of earthquake occurrence, as calculated with help of Geopack-2008 [12]. The scale for ZGSM values is given in right. One may conclude from (3a) that in agreement with the test calculations (Figures 1 and 2), the ZGSM value is large positive in epicenters located at low and middle latitudes, while it is small positive or negative in epicenters located at high latitudes. It is seen also, that ZGSM reach more high values (red color) in eastern hemisphere where the seismic activity is the most high. This is evident from the bottom panel (3b) where the histogram for number of earthquakes depending on geographical longitude is presented. A compareson between 3(b) and 3(a) allows one to suggest that in seismically active areas (where tectonic destructions take place), the earthquakes prefer occur in those regions, where the geomagnetic ZGSM component has the highest positive value. This suggestion may be supported by the results in Figure 4, which presents the histogram for earthquakes counts (EC) depending on the value of ZGSM in the epicenter in the moment of event occurrence.
Black curve on Figure 4 is an exponential of order 2 fit to data as follows:
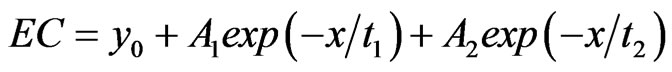 (1)
(1)
where y0 = 0, A1 = 7112, t1 = –43827, A2 = –1859, and t2 = –2011597 with correlation coefficient R = 0.99. It is seen that the largest number of earthquakes indeed occur in regions where geomagnetic ZGSM values are large positive—reach more than 30000 nT. At the same time, the earthquake counts are decreased for ZGSM ≥ 40000 nT. Investigations in more details showed that this phenomenon results from the geometry of the main geomagnetic field, which allows to reach the value of ZGSM ≥ 40000 nT only for restricted time intervals.
3.2. Does the Magnitude of Earthquake Depend on the Geomagnetic ZGSM?
Figures 5 is a scatter plot of the magnitude of earthquake versus the geomagnetic ZGSM value. Visually, cloud of points is fairly stretched and, to a first approximation, can be characterized by a linear dependence.
Black solid line in Figure 5 is an envelope of maximal magnitude in the sequential ZGSM bins of 3000 nT size, and red solid line is the linear fit to envelope with a cor-
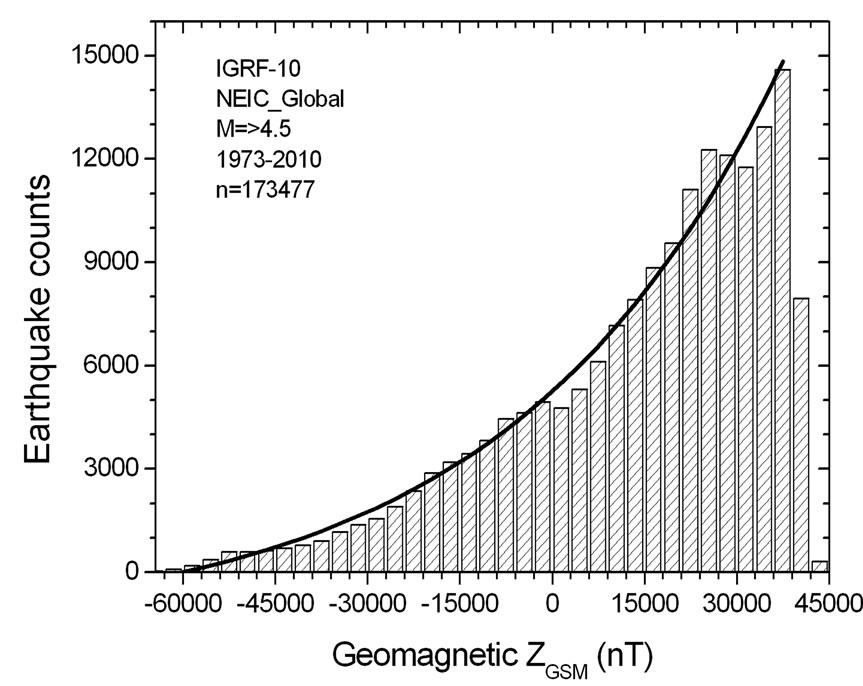
Figure 4. The histogram for number of earthquakes with magnitude М ≥ 4.5 (173477 events from the global NEIC catalogue for 1973-2010) in dependence on the value of geomagnetic ZGSM-component in the epicenter in the moment of earthquake occurrence.
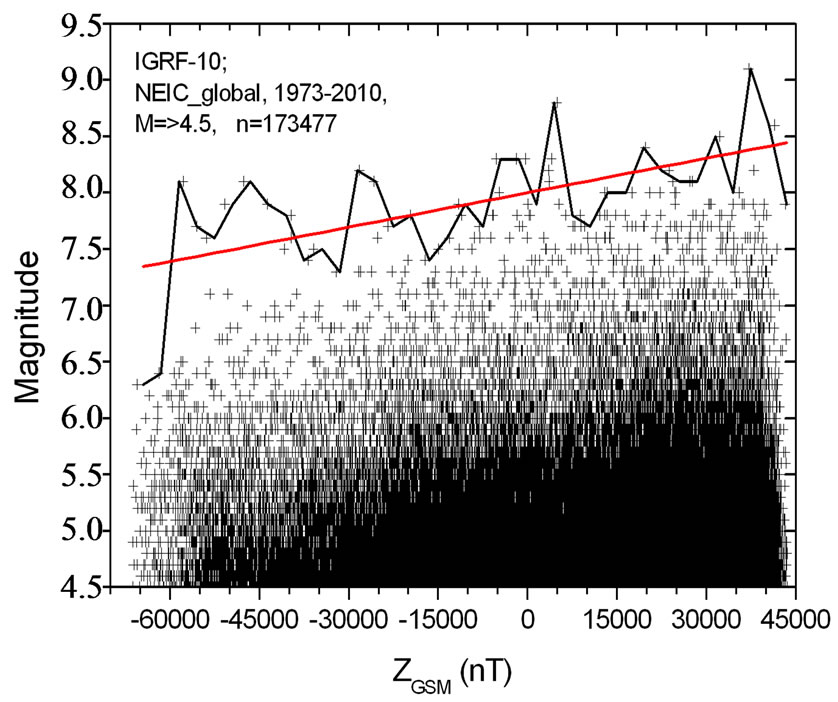
Figures 5. Distribution of the magnitude of earthquake versus the value of geomagnetic ZGSM component in the epicenter in the moment of earthquake occurrence.
relation coefficient R = 0.62. The correlation coefficient is not high because it is seen from figure that the maximal possible magnitude (Mmax) may reach high values (more than 8.0) for both the large positive ZGSM values, and large negative ZGSM as well. The analysis in more details showed dependence between Mmax and the logarithm of the absolute value of geomagnetic ZGSM component. Therefore, in Figure 6 we present a scatter plot of the magnitude of earthquake versus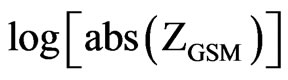 . Black solid line in Figure 6 is an envelope of maximal magnitude (Mmax) in sequential
  bins of 0.15 size, and red solid line is the linear fit to envelope as follows:
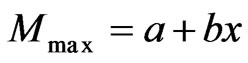 (2)
(2)
where a = 5.22 ± 0.17, b = 0.78 ± 0.06, with correlation coefficient R = 0.91, standard deviation SD = 0.56, and probability 0.95. Rather high value of correlation coefficient between  and Mmax supports suggestion that the magnitude of earthquake depends not only on the geometry of the geomagnetic field, but on its intensity as well.
4. Discussion and Conclusion
It is documented at present that earthquake epicenters are located mainly along the boundaries of lithospheric plates, at the same time, the forces that trigger earthquakes are not well known yet. Thanks to the satellite measurements, the electromagnetic disturbances in the near space plasma parameters prior major earthquakes were observed, that allowed to advance an idea that earthquake is an element of Global Electric Circuit (GEC). In a modern concept of GEC, it is a vertical electrical loop electrodynamically coupling all geospheres from the magnetopause to the Earth’s core. As in any electric circuit the electromagnetic disturbances in one
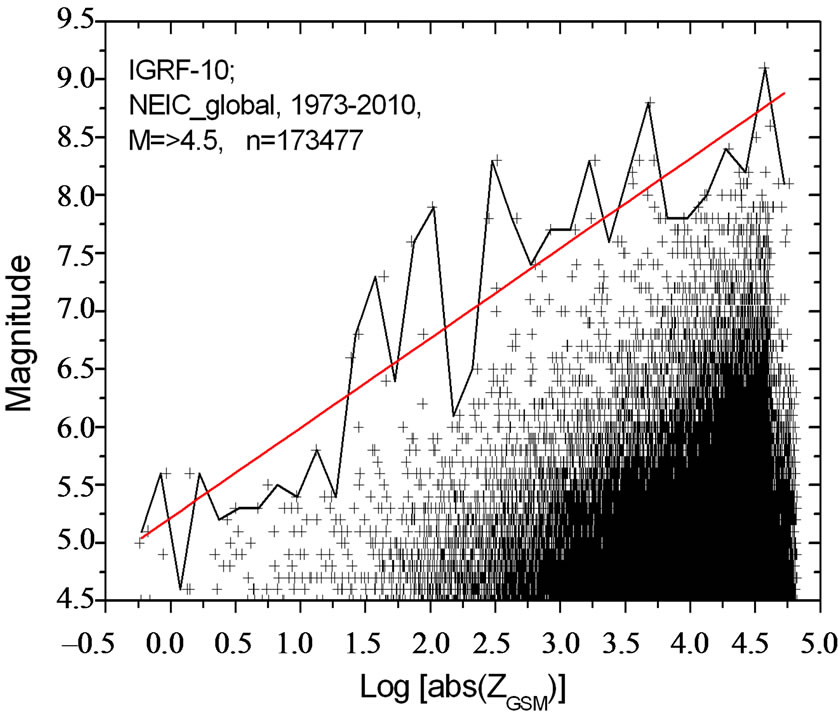
Figures 6. Distribution of the magnitude of earthquake versus the logarithm of the absolute value of the geomagnetic ZGSM component in the epicenter in the moment of earthquake occurrence
 and a possible maximal magnitude of earthquake (Mmax). This finding may be used, in first approximation, for seismic zoning on the base of the International Geomagnetic Reference Field model. Presented results support an idea that earthquake is element of GEC which, in modern concept, provides electrodynamical couplings between different Earth’s spheres.
In conclusion:
1) Rather close relationships between earthquake counts, earthquake magnitude and geomagnetic Z component in geocentric solar magnetospheric coordinate system (ZGSM) is revealed.
2) Since the value and direction of ZGSM are the key parameters for the process of magnetic reconnection between the magnetic field of the solar wind and the Earth’s magnetic field, we suggest that earthquake occurrence is related somehow to the process of magnetic reconnection. For example, earthquake occurrence may be triggered by the electromagnetic disturbances, which firstly appear at the magnetopause due to magnetic reconnection, and then penetrate to the lower Earth’s spheres via the global electric circuit.
It is clear that much work remains to further verify this speculative assertion and to find the physical processes linking seismicity with the main geomagnetic field structure.
5. Acknowledgements
We thank N. Tsyganenko for consultations regarding his set of programs Geopack-2008. Constructive comments from both referees are appreciated. Also, we thank the IJG Editorial Board for a number of consultations regarding the paper submitting.
REFERENCES
- S. A. Pulinets and K. A. Boyarchuk, “Ionospheric Precursors of Earthquakes,” Springer, Berlin & New York, 2004.
- S. A. Pulinets, “Physical Mechanism of the Vertical Electric Field Generation over Active Tectonic Faults,” Advances in Space Research, Vol. 44, No. 6, 2009, pp. 767- 773. doi:10.1016/j.asr.2009.04.038
- C. T. R.Wilson, “Investigations on Lightning Discharges and on the Electric Field of Thunderstorms,” Philosophical Transactions of the Royal Society A, Vol. 221, No. 582-593, 1920, pp. 73-115. doi:10.1098/rsta.1921.0003
- M. J. Rycroft, S. Israelsson and C. Price, “The Global Atmospheric Electric Circuit, Solar Activity and Climate Change,” Journal of Atmospheric and Solar-Terrestrial Physics, Vol. 62, No. 17, 2000, pp. 1563-1576. doi:10.1016/S1364-6826(00)00112-7
- R. G. Harrison, K. Aplin and M. Rycroft, “Atmospheric Electricity Coupling between Earthquake Regions and the Ionosphere,” Journal of Atmospheric and Solar-Terrestrial Physics, Vol. 72, No. 5-6, 2010, pp. 376-381.
- R. G. Harrison, “The Global Atmospheric Electrical Circuit and Climate,” Survey in Geophysics, Vol. 25, No. 5-6, 2004, pp. 441-484. doi:10.1007/s10712-004-5439-8
- E. A. Bering, A. A. Few and J. R. Benbrook, “The Global Electric Circuit,” Physics Today, Vol. 51, No. 10, 1998, pp. 24-30. doi:10.1063/1.882422
- L. N. Makarova and A. V. Shirochkov, “A New Approach to the Global Electric Circuit Conception,” 1998. http://www.sgo.fi/SPECIAL/Contributions/Makarova.pdf
- С. T. Russell, “Reconnection in Planetary Magnetospheres,” Advances in Space Research, Vol. 29, No. 7, 2002, pp. 1045-1052.
- C. T. Russell, “Geophysical Coordinate Transformations,” Cosmic Electrodynamics, Vol. 2, 1971, pp. 184- 196.
- Global NEIC Catalogue, 1973-2010. http://neic.usgs.gov/neis/epic/epic_global.html
- N. A. Tsyganenko, “Geopack: A Set of Fortran Subroutines for Computations of the Geomagnetic Field in the Earth’s Magnetosphere,” 2008. http://geo.phys.spbu.ru/~tsyganenko/Geopack-2008.html
- The International Geomagnetic Reference Field model. http://www.ngdc.noaa.gov/IAGA/ vmod/igrf.html