International Journal of Geosciences
Vol. 3 No. 3 (2012) , Article ID: 21216 , 10 pages DOI:10.4236/ijg.2012.33054
Sediment Characteristics of Tidal Deposits at Mandvi, Gulf of Kuchchh, Gujarat, India: Geophysical, Textural and Mineralogical Attributes
1Department of Geology and Geophysics, Indian Institute of Technology, Kharagpur, India
2Department of Ocean Engineering, Indian Institute of Technology, Madras, India
3National Geophysical Research Institute, Hyderabad, India
4Department of Earth and Environmental Science, Temple University, Philadelphia, USA
5Structural Engineering Research Centre, Chennai, India
6Variable Energy Cyclotron Centre, Kolkata, India
Email: rajeshnair.iitkgp@iitm.ac.in
Received February 10, 2012; revised March 23, 2012; accepted May 8, 2012
Keywords: Tidal Currents; Mandvi; Grain Size Analysis; XRD; GPR Data; OSL Ages
ABSTRACT
The textural and mineralogical characteristics of subsurface sediments along with Ground Penetrating Radar (GPR) data collected along the Western margin of India were used to understand the depositional environments and the provenance of sediments. Textural attributes such as mean, standard deviation, skewness and Kurtosis show fluctuations due to fluvio-marine interaction and it is well understood that the bottom sediments are enriched with muddy sand, which may be deposited by mean of tidal invasion. The abundance of very coarse silt to very fine sand indicates the prevalence of low energy environment. The Linear Discriminate Function analysis indicates the fluvio marine deposition of sediments under low energy condition. GPR data upto a depth of 5 m shows the stratigraphic sequences of very fine sands and coarse silt. Optically Stimulated Luminescence (OSL) dating of sediments implies that the tidal sediments had deposited between ~30 ± 1 and ~90 ± 4 years before Present. XRD studies results the dominance of K-feldspar and deficiency of clay minerals, indicating that most of the sediments are derived from hinterland. Studies indicate that the Provenance of sediments in the Mandvi area is not related to Indus delta even though a considerable part of Gulf sediments are deposited by the Indus River.
1. Introduction
The continental shelf on the northwest coast of India is quite wide and leads into a converging channel, the Gulf of Kachchh. Oscillatory flow driven by the tides of the adjacent Arabian Sea is the dominant motion in this part of the coast. Demanding studies have been carried out on modern tidal environments such as tidal flats, tidal inlets, deltas and subtidal shelf banks, focusing on the siliciclastic tidal flats of North Sea [1,2], the Gulf of California [3], Inchon Bay of South Korea [4], tidal flats in India [5-7] and Gironde estuary of France [8]. The high speed tidal currents at the mouth of the gulf play the major role in the excursion of sediments in the gulf [9]. The main source of sediments in the Gulf of Kuchchh is Indus River, located about 100 km North West of Gulf of Kuchchh, discharging an annual suspended load of 435 million tones, occupying an area of about 8500 km2. The sediments consist mostly of clay particles, which remains in suspension for a long period of time and finally settle as mud flats, towards the head of Gulf. The total dissolved contents of water are measured as high as 21 - 69 mg·I−1 [10].
Gulf hydrography is characterized by strong alongshore currents at the mouth, moving in and out during flood and undergoing dynamic changes with tidal phases. Pradhan et al. [11] observed the suspended sediment dispersal patterns at different stages of tide cycles by using Indian Remote sensing Satellite data. The western part of Gulf of Kuchchh is influenced by open sea and the eastern part is influenced by the Gulf environment [12]. The sediment distribution boundaries counterpart the boundaries defined by current velocity distribution, as the sediment pattern of the study area is season dependant. Gulf sediments have a consistent one layered structure due to the prevailing climate and condensed fluvial discharge [11]. More suspended sediments occurred where high magnitude tidal currents are present whereas low to very low suspended sediments occurred where tidal currents are less. Higher aeolian distribution into the region is not reported yet to sustain the turbidity in water. The reason behind the suspended nature of sediments is the presence of islands, pinnacles and turbulent tidal currents. Turbidity in near shore waters is caused by the churning and transportation of suspended sediments along with submarine sediments. The sediments are continuously transported due to the action of tidal currents. The sediment transportation directions in the Gulf region is shown in Figure 1. Sediments enter into the mouth of gulf of Kuchchh from both north and south directions and its movements are season dependant [13].
The eddy type structures around the islands are mainly due to the tidal and ebb tidal currents in this region [14], which is documented by the 18 m thick layered deposition in the Gulf [15]. Minor cuspates are seen in the coastline along the seaward margin of the beach and beach cusp features which are being produced by the superposition of processes operating in the intertidal zones with different scales of motions [16]. These developed features replicate the regional trend of the shelf edge and are governed by the reactivation of east west regional fault in the Gulf of Kutch [17]. Other factors that are responsible for the development of crescent shaped coastal landforms are the waves which are normal to the straight coast and make the impact against the curved coast [12].
The present work is paying attention on evaluating the GPR technique in understanding the shallow subsurface architecture of Mandvi region of Gulf of Kuchchh. Processed radar profiles have been used successfully to construct the radar stratigraphy in both, ancient and modern sand bodies [13,14]. Mandvi area was selected because of its good exposure to sediments from the hinterland as
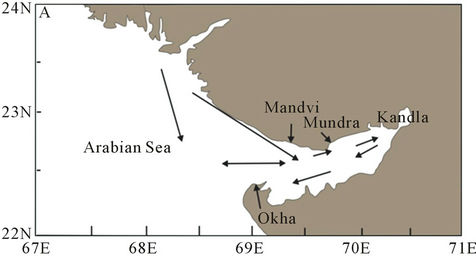
Figure 1. Schematic representation showing the directions of sediment transportations, over a complete tidal cycle, in and around Gulf region (after Pradhan et al. [11]). A major part of sediments are transported from Indus delta towards the head of Gulf. At Mandvi, Mundra and Okha regions, sediments are derived from local sources by small rivers.
being nearby Rukmavati River. Textural and compositional characteristics along with Optically Stimulated Luminescence dating (OSL Dating) of sediment samples aided to reconstruct the paleoclimate of the study area.
2. Regional Setting
The study area is Mandvi (22˚49'05.43"N, 69˚21'01.28"S) and is located at the mouth of Gulf of Kuchchh, a funnel shaped, east west oriented, seismically active, unique macrotidal environment with a tidal amplification of 3 m at the mouth to 7 m at the head [15]. The coastal areas of Gulf of Kuchchh is developed by a variety of land forms such as tidal mud flats, raised beaches, sealed river mouth, spits, ridge tunnel system, stabilized and non stabilized dunal area, lagoons and alluvial plain [12]. Location map and satellite imagery of the study area is given in Figure 2. The study area comes under the eastern part of Rukmavati River, which is flowing from the hinderland. Local geology of the area being predominantly basalt with Cretaceous sedimentary rocks; sandstones dominate in the study area [16]. The Gulf was sub-aerially exposed prior to Holocene, because the known sea level was 65 m prior to 10 Ka BP in this region [17]. Coastal beaches of Mandvi are characterized by progradation and coastal shifting, with alluvial plain extending for several kilometers parallel to the coast. The area under investigation shows the subsurface depositional pattern, which may be resulted due to tidal activities and these sediments are derived from sea to land during high tide activity.
3. Methodology
A total of four GPR profiles from sea to land were mapped in the study area near to Rukmavati River using a GPR [Subsurface Interface Radar (SIR) 3000 system developed by Geophysical Survey System, Inc. (GSSI) synchronized with GPS] mounted with 200 MHz as well as 900 MHz antenna in monostatic mode. By cross examination, it was found that all the profiles are of repetitive nature. The lithological boundaries and sedimentary structures are commonly become visible in radar profiles. Figure 2 shows the satellite image of the study area and lines parallel and perpendicular to the coast are the GPR runs taken for subsurface imaging. High resolution GPR profiling, along with 40 - 50 sediment cores, X-ray diffraction and granularity analysis by Malvern Mastersizer 2000 particle size analyzer have been carried out in the present study. The topographic profile with GPR section and trench photographs is shown in Figure 3. In this Figure the top row is topographic profile, middle row demonstrating the GPR radargram of the section with trench marks (unit A and unit B) and bottom row depicting the two trench photographs of unit A and unit B.

Figure 2. Figure shows location map of the study area from where GPR studies have been carried out. The satellite imagery of the study area is given in the lower part.

Figure 3. shows the vertical and horizontal variations of graphic mean, skewness, standard deviation and kurtosis; from top to bottom the mean value decreases; towards the land sorting values decreases and kurtosis values increases.
The ages of sediments were calculated using OSL dating, which uses quartz separated from the sediments to estimate total radiation exposure seen by it since deposition. This is estimated via optically stimulated luminescence. The radiation exposure arises from environmental radioactivity. The environmental dose rate (in Gy/ka) is due to the decay of U, Th and K in ambient stratum is computed via their elemental concentration.
4. Results
4.1. Grain Size Analysis Data
In accordance with the grain size analysis, sediments analyzed are ranging from very coarse silt to very fine sand. In both units the mean grain size decreases from top to bottom (Figure 3) and the phi value ranges from 4.236 to 3.5 with an average mean of 3.86; towards the land the phi value increases. The standard deviation values range between 0.579 and 0.773 with an average value of 0.676. The particle dispersion is in the range of moderately sorted to moderately well sorted and the samples show variation in sorting. Skewness values range between −0.129 and 0.346, with an average value of 0.1085. Symmetry of samples varies from very fine skewed to coarse skewed nature. Top samples of both units are finely skewed with negative skewness. The middle and bottom samples of unit A and bottom sample of unit B are of positive skewness. Kurtosis values range between 0.866 and 4.23 with an average of 2.548. The samples fall under mesokurtic to leptokurtic nature of distributions. The kurtosis values of the bottom layers of unit A and Unit B is less as compared to that of the middle and top samples.
4.2. Linear Discriminate Functions (LDF)
Sahu [18] introduced the linear discriminate functions for environmental interpretation and the method uses all the grain size parameters in the form of a single linear equation, in which Y1 (Aeolian: beach), Y2 (fluvial: turbidity), Y3 (shallow marine: fluvial) and Y4 (beach: shallow marine) values were analyzed. We are using the following discriminate functions in this work.
1) For the discrimination between Aeolian processes and inter tidal zone environments
Y1 = −3.5688 Mz + 3.7016 σI2 − 2.0766 SK + 3.1135 KG
where Y is the discriminate function, Mz is mean grain size, σI is graphic standard deviation (sorting), SK is skewness and KG is graphic kurtosis.
2) For the discrimination between fluvial and turbidity environments
Y2 = 0.7215 Mz − 0.4030 σI2 + 6.7322 SK + 5.2927 KG
3)For the discrimination between shallow marine and fluvial environments
Y3 = 0.2852 Mz − 8.7604 σI2 − 4.8932 SK + 0.0482 KG
4) For the discrimination between beach and shallow agitated marine environments (subtidal)
Y4 = 15.6534 Mz + 65.7091 σI2 + 18.1071 SK+ 18.5043 KG
With reference to the values obtained from Sahu’s linear discriminate functions (Table 1) plotted in Figure 3, majority of the samples are formed by beach and fluvial activities, except the top sample of unit B which is formed by Aeolian activities, aided by turbidity currents (Figure 4). Y3 values indicate that the sediments are deposited in shallow marine environments.
4.3. XRD Results
Samples for XRD studies were gently ground to fine powder and oriented slides were made for mineral identification. A Seimens X-ray diffractometer with CuKα radiation, graphite secondary monochromator, a step size of 0.02 2θ, and a counting time of 2 s/steps is used. XRD studies of the samples collected from the study area reveal a typical mixed mineralogy of both beach and fluvial environments. The major minerals present in the area are K feldspar, quartz, dolomite, rutile, sillimanite, spinel, prehnite-pumpellite, vaterite, haematite, montmorillonite and tourmaline among which common beach minerals are quartz, feldspar, rutile, tourmaline and sillimanite. Significantly chlorite and illite are absent in all the samples. Examples of diffractograms are given in Figure 5. Most common minerals among these are K feldspar and quartz. Carbonate minerals such as dolomite and vaterite, a temperature polymorph of CaCO3 are present in both units; montmorillonite is the present only in the bottom layer of Unit A. Heavy minerals such as rutile, sillimanite and haematite are also present in the area in minor amounts. Spinel is present in all the samples, except

Table 1. Showing LDF values (after Sahu [18]), indicating the deposition of samples in shallow marine environment, by the combined action of beach and fluvial processes.
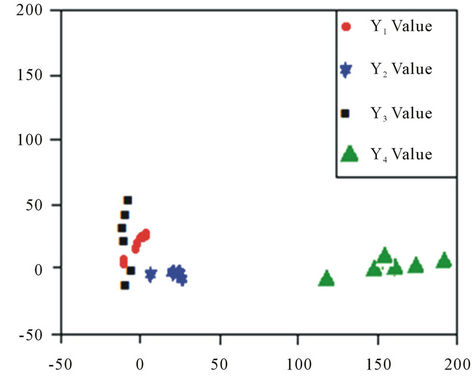
Figure 4. Showing the relationship between Y1, Y2, Y3 and Y4 the values of the samples. Most of the samples come under beach and fluvial environment.
the bottom sample of unit A.
4.4. GPR Data Analysis
Based on the high frequency GPR reflections, two radar facies have been recognized. In Figure 6 the 45 m long profile is starting from the berm line to the backshore field. Low amplitude uniform reflections (layer 1) can be seen up to a minimum depth of about 1.2 m and a maximum depth of about 1.8 m. The parallel and tangential layer (layer 2) below the fine grained sands is occupied by approximately 1 m thick very fine grained silt, which is characterized by high amplitude reflections. Layer 2 is characterized by 3 distinct cross beds which may be deposited over a long period of time. Low frequency reflections dipping in different directions in different angles, in the layer 3 may be attributed to attenuation by the layer 2 sediments. Between 25 to 35 m horizontal distance, very gently sloping, seaward dipping, concave downward with relatively higher landward dipping reflections are interpreted as beach ridge reflections [19,20]. This is ground soothed by the field investigations. An erosional surface is visible between the fine sand and silt layer which is well marked in Figure 7 and is characterized by the low amplitude reflectors with tangential oblique configurations.
4.5. OSL Dating Results
Optically-stimulated luminescence (OSL) dating of quartz mineral separated from sediments provided depositional ages of fine grained sand and coarse silt layers (layer 1 and layer 2 of Figure 6). The age of sediments of layer 1 in Unit A being calculated by OSL dating as ~20 ± 1 years before present and that of unit B as ~31 ± 4 years before present. This indicates an increase in age of sediments towards the land. The optical ages of sands, immediately overlying the silt layer, being calculated as ~30 ± 1 and ~76 ± 4 years before present for unit A and unit B respectively. The former is at a depth of 1.2 m and the latter is at depth of 2.2 m. Even if both the samples lay on the top layer of coarse silt, the age of sediment in unit A is very less as compared to that of unit B. The ages of sediments of top and bottom layers of coarse silt in unit A are ~30 ± 1 and ~90 ± 4 respectively and are suggesting the recurrence interval of silt deposition.
5. Discussion and Conclusions
5.1. Grain Size Analysis
Textural attributes of sediments such as mean, standard deviation, skewness and kurtosis are far and wide used to reconstruct the depositional environments of sediments [21]. Many of the sedimentologists have correlated the grain size parameters and the trasportational-depositional mechanisms by different useful studies [22-26].
Mean size of sediments are influenced by the source of supply, transporting medium and the energy conditions of depositing environment [27]. Mean size indicates that the sediments were deposited in a moderately low energy environment. The ridges in the area shows decrease in grain size across the intertidal zone and are moderately sorted [12]. Standard deviation measures the sorting of sediments and indicates the fluctuations in kinetic energy or velocity conditions of depositing agent [18]. Variation in sorting reflects the continuous addition of fine and course materials in various proportions. Top samples of both units are finely skewed with negative skewness indicating excessive riverine input. The middle and bottom samples of unit A and bottom sample of unit B are of positive skewness adverting unidirectional transport or deposition of sediments in a low energy sheltered environment [27]. Negative skewness generally indicates proximity to a river mouth, where winnowing may have dominated over deposition whereas the positive skewness indicates sands of lagoonal area, dominated by deposition [25]. Variation in Kurtosis is a reflection of flow characteristics of depositing medium [28,29]. The extreme kurtosis values of sediments signify that a part of the sediments were underwent sorting in high energy environment [30]. The kurtosis values of the bottom layers of unit A and Unit B is less as compared to that of the middle and top samples, reflecting the maturity of bottom sediments. The textural group assigned for the bottom and top samples are muddy sand and sandy mud respectively. The basinal muds of gypsiferous shale followed upwards by silts and finally by fine grained sands of Dhosa sandstone member at the top of Chari formation in the kuchchh mainland was studied by Fursich and Wurzburg [31].
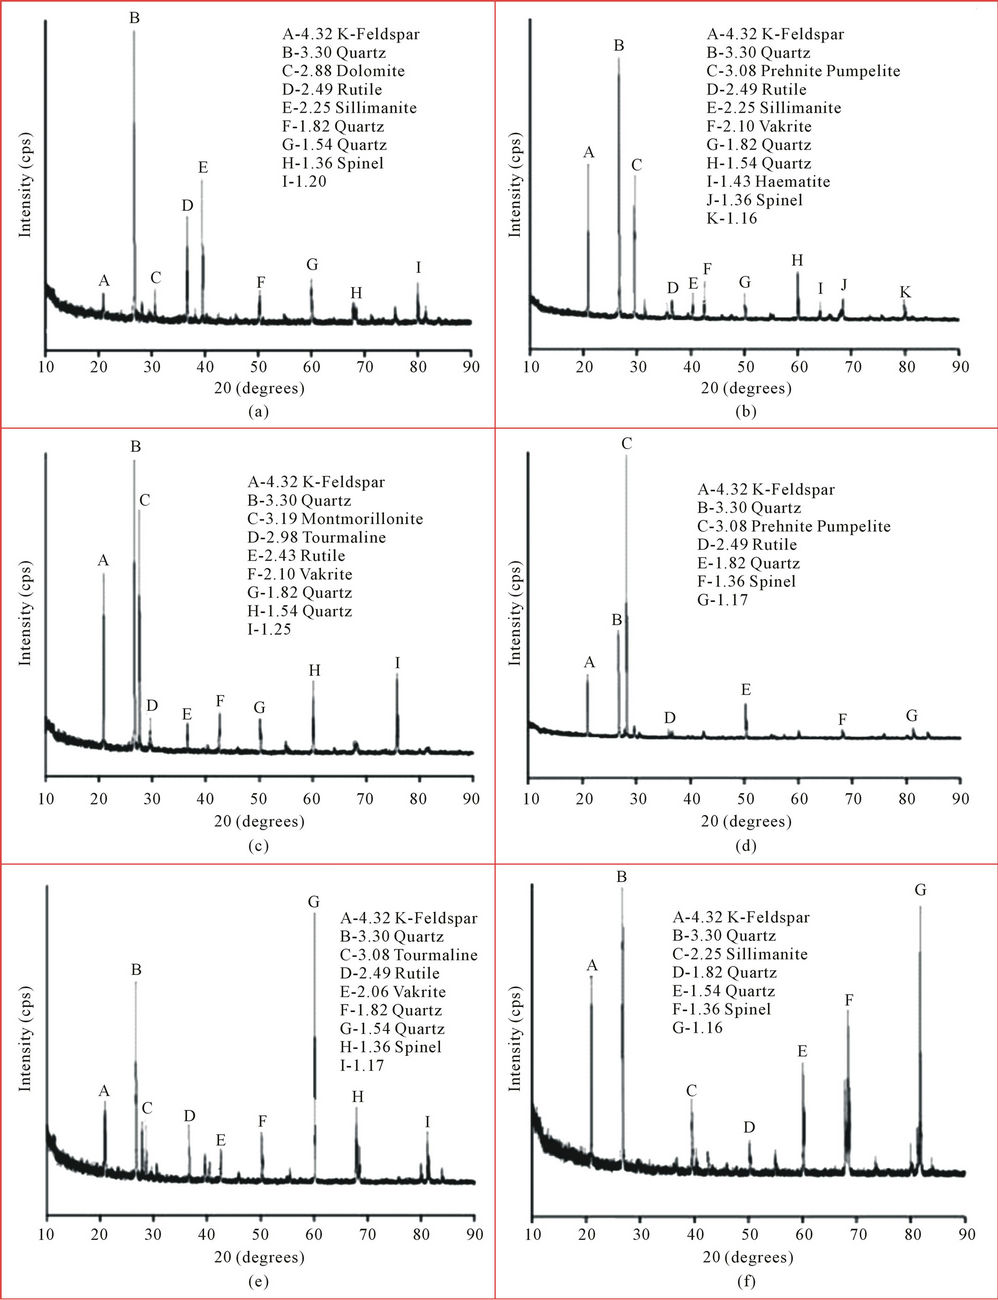
Figure 5. X-ray diffractograms of sediment samples from pits. (a), (b) and (c) represent the diffractograms of samples collected from unit A and (d), (e) and (f) represent those of samples collected from unit B.
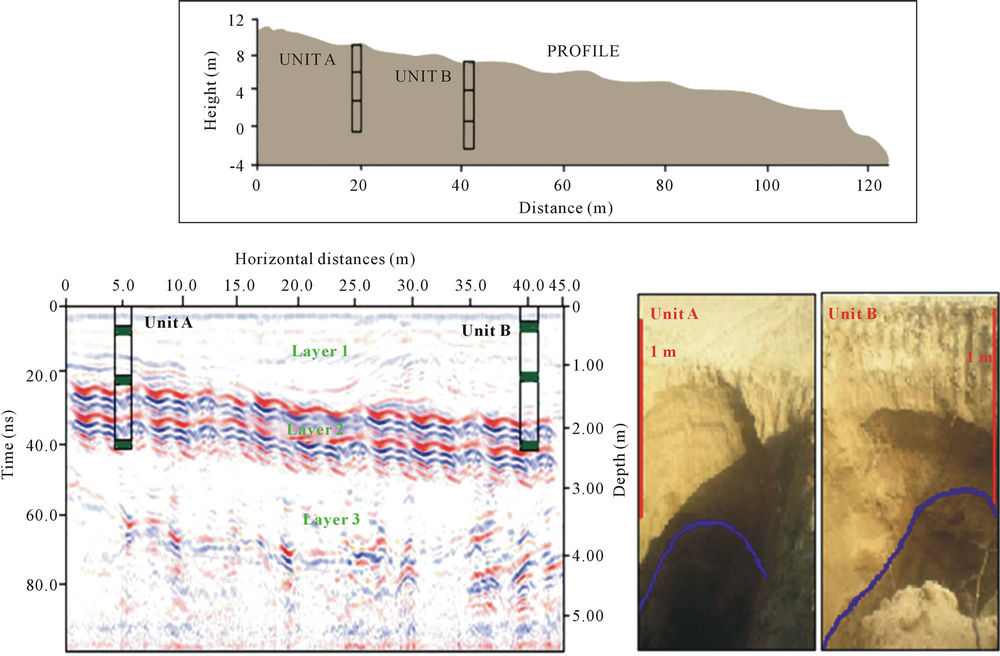
Figure 6. The figure shows processed GPR data collected from the area. The profile shows three distinct stratigraphic layers of sediments among which layer 1 and layer 3 are predominated by sand sized particles and layer 3 is predominated by coarse silt. The photographs of the pits are also given in which the upper layer boundaries of very fine sand and coarse silt are marked.
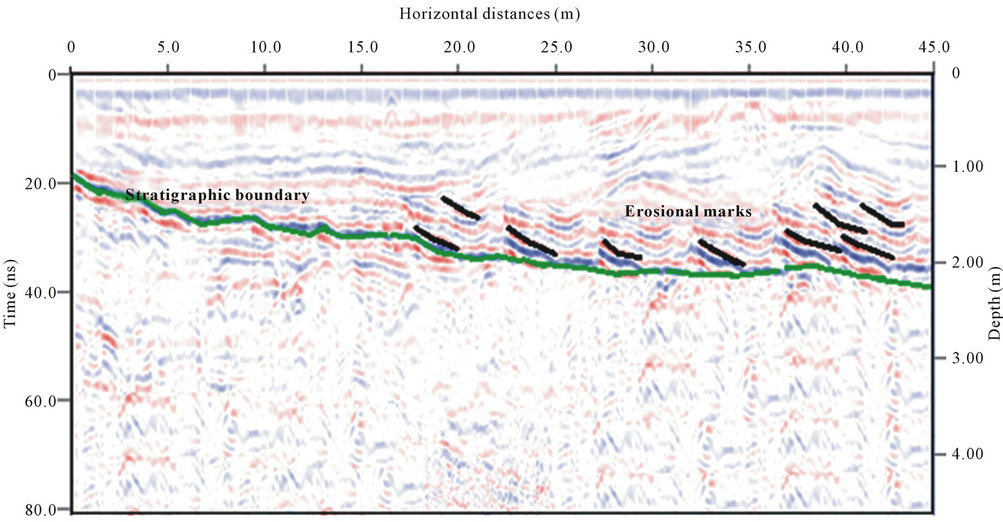
Figure 7. The figure shows processed GPR profile in which erosional dipping layers can be seen, immediately above the boundary between layer 1 and layer 2, indicating a wash over facies.
5.2. XRD Analysis
Despite of the existence of turbid water in the entire Gulf, the deficit of clay minerals in the sediment samples collected from the study area is intriguing. Even if most of the sediments deposited in the Gulf region are transported from the Indus delta, the current study area is dominated by sediments from the hinterland which is evidenced by the prevalence of other minerals out of clay minerals. Sediments might have been drawn by the erosion older beach ridge complex near the mouth of the river. The sandstone packages nearby the study area, suggesting periods of increased rainfall reflect the increased terrigenous input by rivers and heavily rooted nonmarine sediments. Smectite illite, chlorite and Kaolinite are the major constituents of Indus delta, where the sediments are derived from the glacial Himalayas and semi arid to arid soils [32]. The historical Rukmavati River is draining into the sea through Mandvi and brings sediments from arid soil. The deficiency of clay minerals in the sediment samples indicates that the water in the study area is not as turbid as compared to the nearby areas. The absence of clay minerals in Unit B and the upper and middle layers of Unit A indicate that the deposition has mainly done by beach activity, whereas the presence of montmorillonite in the bottom layer of Unit A reveals the deposition by tidal events as the clay minerals are potential to be carried in suspension for considerable distance in open Ocean. Less distribution of clay minerals in the study area as compared to that at the northern Gulf may be attributed to the high velocity tidal stream at the Gulf mouth acting as a dynamic barrier inhibiting the sediment transport across the mouth [9]. Rukmavati River drains the sediments derived from the Tertiary rocks of coastal plain and debouches to the beaches; the eastward littoral drift and onshore monsoon winds redistribute these sediments [33]. Each individual clay mineral being produced from specific geology and climate of any given region is considered to be source specific [34,35]. The source rock of montmorillonite in the present study area is basalt in humid tropical climates [36,37] and is the predominant clay mineral in the sediments of continental shelf, south of Gulf of Kuchchh [38]. Feldspars might have derived either from the basalts and dolerites or from granophyre felsites of the hinterland; potash might be introduced hydrothermally. Trace amounts of dolomite and vaterite, which might have eroded from the Quaternary sediments of the catchment area, are found in the bottom sediments below 3 m depth indicating the deposition of carbonate muds.
5.3. GPR Data Interpretation
GPR surveys on the study area reveal the landward accretion of two different sedimentary units. Layers 1 and 3 are characterized by very fine sands and layer 3 in Figure 6 is characterized by coarse silt sands. The distribution of these fine grained sediments on continental shelf is controlled by the depositional processes, especially the current circulation patterns and their settling in response to the salinity and energy conditions [32]. A beach ridge is identified by the low amplitude, concave downward reflections in between 25 to 35 m horizontal distances (Figure 6). Tides, currents, waves and onshore winds play an important role in shaping the coastal sediment bodies [33]. During exceptional high tides aided by storms, more sediment can be eroded from the subtidal and intertidal areas and deposited landward in the form of wash over fans [39-41]. The high proportion of silt content in the area between Mandvi and Modwa spit is due to the exposure of palaeo mud in the runnels of inter tidal zones [12].
A deposition bedding plane is visible between layer 1 and layer 2 in sediments is a product of changes in sediment composition and changes in shape, size and orientation of packing grains [20]. Dipping erosional layers seen immediately above the layer 2 sediments are interpreted as wash over facies. Layer 2 is characterized by two distinct cross beds of sediments with high amplitude reflections. The cross bed sets have been successfully recognized within GPR by Corbeanu et al. [42]. Discontinuous reflections dipping in different directions at different angles in layer 3 (Figure 6) in the radar facies indicate that the deposition was aided by tidal currents. These types of deposits were also reported by Van Heteran et al. [43], Schink et al. [44], Coastas et al. [45] and Neal et al. [46].
5.4. OSL Dating Analysis
The applications of luminescence dating for the dating of sediments are well-established by several scientists [47, 48]. Luminescence dating has been applied previously on coastal deposits by Nigam and Chaturvedi [14]. By cross examination, it can be observed in both units that the age of sediments increases from top to bottom, indicating the sequential deposition of sediments; fine sand layer is younger as compared to the coarse silt layer. The considerable difference in the ages calculated for the samples taken from the coarse silt layer in unit A and unit B indicate the time interval between depositions of sediments towards landward direction. The alternating humid and semiarid conditions in the study area were studied by Fursich et al. [49] on behalf of the increased terrigenous input by rivers from the sandstone packages during heavy rainy season and the widespread brackish water faunas during the phase of increased fresh water in the near shore areas; semi arid conditions are indicated by red beds and calishe hoizons [50]. The argillaceous and silty substrates of Middle and Bathonian ages were studied previously by Fursich et al. 2005. In the present study, GPR reflections along with grain size studies, XRD analysis and field observations portend the dominant tidal deposition in the region. The radar profile and OSL dates manifest the prograding nature of mandvi beach with its aggradation mainly due to tidal currents.
6. Acknowledgements
Financial support from Department of Science and Technology, Delhi and Indian National Centre for Ocean Information Services, Hyderabad is gratefully acknowledged.
REFERENCES
- G. Evans, “Intertidal Flat Sediments and Their Environment of Deposition in the Wash,” Quarterly Journal of Geologic Sciences London, Vol. 121, 1965, pp. 209-245. doi:10.1144/gsjgs.121.1.0209
- H. E. Reineck, “Tidal Flats,” SEPM Special Publication, Vol. 16, 1972, pp. 146-149.
- R. W. Thompson, “Tidal Flat Sedimentation on the Colorado River Delta, Northwestern Gulf of California,” Geological Society of American Memorandum, Vol. 107, 1968, p. 133.
- C. R. Alexander, C. A. Nittrou, D. J. Demaster, Y. A. Park and S. C. Park, “Macrotidal Mudflats of the Southwestern Korean Coast: A Model for Interpretation of Intertidal Deposits,” Journal of Sedimentary Research, Vol. 61, No. 5, 1991, pp. 805-824.
- A. Chakrabarti, “Beach Structures Produced by Carbonate Pellets,” Sedimentology, Vol. 18, 1972, pp. 129-134. doi:10.1111/j.1365-3091.1972.tb00008.x
- K. K. Mukherjee, S. Das and A. Chakrabarti, “Common Physical Sedimentary Structures in a Beach-Related Open Sea Siliciclastic Tropical Tidal Flat at Chandipur, Orissa and Evaluation of Weather Conditions through Discriminate Analysis,” Senckenbergiana Maritime, Vol. 19, 1987, pp. 261-293.
- A. Bhattacharya, “Surface Sculpture and Layering in the Transitional Zone between Intertidal and Supratidal Flats of the Mesotidal Tropical Coast of Eastern India,” Tidalite Dynamics, Ecology and Evolution of the Tidal Flats, 2000, pp. 7-8.
- G. P. Allen, “Etude des Processus Sedimentaires dans l’estuarine de la Grinode,” Unpublished Ph.D. Thesis, University of Bordeaux, Bordeaux, 1972.
- R. R. Nair, N. H. Hashimi and V. P Rao, “On the Possibility of High Velocity Tidal Streams as Dynamic Barriers to Long Shore Sediment Transport: Evidence from the Continental Shelf of the Gulf of Kuchchh,” Indian Marine geology, Vol. 47, 1982, pp. 77-86.
- O. S. Chauhan, S. Jayakumar, A. A. Menezes, A. S. Rajawat and S. R. Nayak, “Anomalous Inland Influx of the River Indus, Gulf of Kachchh, India,” Marine Geology, Vol. 229, No. 1, 2006, pp. 91-100. doi:10.1016/j.margeo.2005.12.003
- Y. Pradhan, A. S. Rajawat and S. R. Nayak, “Application of IRS-P4 OCM Data to Study the Impact of Tidal Propagation on Sediment Dynamics in the Gulf of Kachchh,” Indian Journal of Marine Sciences, Vol. 34, No. 2, 2004, pp. 157-163.
- S. J. Patel and B. G. Desai, “Animal-Sediment Relationship of the Crustaceans and Polychaetes in the Intertidal Zone Around Mandvi, Gulf of Kachchh, Western India,” Journal of Geological Society of India, Vol. 74, No. 2, 2009, pp. 233-259. doi:10.1007/s12594-009-0125-6
- P. D. Kunte, B. G. Wagle and Y. Sugimori, “Sediment Transport and Depth Variation Study of the Gulf of Kutch Using Remote Sensing,” International Journal of Remote Sensing, Vol. 24, No. 11, 2003, pp. 2253-2263. doi:10.1080/01431160210164316
- R. Nigam and S. K. Chaturvedi, “Do Inverted Depositional Sequences and Allochthonous Foraminifers in Sediments along the Coast of Kachchh, NW India, Indicate Palaeostorm and/or Tsunami Effects?” Geo-Marine Letters, Vol. 26, 2006, pp. 42-50. doi:10.1007/s00367-005-0014-y
- O. S. Chauhan and K. H. Vora, “Reflection Seismic Studies in the Macrotidal Gulf of Kachchh, India: Evidences of Physiographic Evolution,” Continental Shelf Research, Vol. 10, No. 4, 1990, pp. 385-396. doi:10.1016/0278-4343(90)90058-T
- R. Dolan, L. Vincent and B. Heyden, “Crescentic Coastal Landforms,” Z. Geomorpology, Vol. 18, 1974, pp. 1-12.
- S. Onkar, Chauhan and F. Almeida, “Influences of Holocene Sea Level, Regional Tectonics, and Fluvial, Gravity and Slope Currents Induced Sedimentation on the Regional Geomorphology of the Continental Slope off Northwestern India,” Marine Geology, Vol. 112, No. 1-4, 1993, pp. 313-328. doi:10.1016/0025-3227(93)90176-V
- H. M. Jol and D. G. Smith, “Ground Penetrating Radar of Northern Laccustrine Deltas,” Canadian Journal of Earth Science, Vol. 28, 1991, pp. 1939-1947. doi:10.1139/e91-175
- R. L. Gawthorpe, R. E. L. Collier, J. Alexander, M. Leeder and J. S. Bridge, “Ground-Penetrating Radar; Application to Sand Body Geometry and Heterogeneity Studies,” Geological Society of London Special Bulletin, Vol. 73, 1993, pp. 421-432. doi:10.1144/GSL.SP.1993.073.01.24
- V. Ramaswamy, B. N. Nath, P. Vethamony and D. Illangovan, “Sourec and Dispersal of Suspended Sediments in the Macro Tidal Gulf of Kuchchh,” Marine Pollution, Vol. 54, 2007, pp. 708-719. doi:10.1016/j.marpolbul.2007.01.026
- M. S. Krishnan, “Geology of India and Burma,” Higginbotham (P) Limited, Madras, 1968, p. 536.
- R. Nigam, N. H. Hashimi, E. T. Menezes and A. B. Wagh, “Fluctuation in Sea Level off Bombay (India) between 14,500 to 10,000 Years before Present,” Current Science, Vol. 63, 1992, pp. 309-311.
- B. K. Sahu, “Depositional Mechanisms from Size Analysis of Clastic Sediments,” Journal of Sediment Petrology, Vol. 34, No. 1, 1964, pp. 73-83.
- N. P. Psuty, “Beach Ridge Development in Tabasco, Mexico,” Annual Association of American Geographysts, Vol. 55, No. 1, 1965, pp. 112-124.
- J. D. Collinson and D. B. Thompson, “Sedimentary Structures,” 2nd Edition, Unwin Hyman, London, 1989, p. 207.
- E. J. Amaral, “Depositional Environment Saint Peters Sandstone Deduced by Textural Analysis,” Journal of Sediment Petrology, Vol. 47, 1977, pp. 32-52.
- R. L. Folk and W. C. Ward, “Brazos River Bar: A Study in the Significance of Grain Size Parameters,” Journal of Sediment Petrology, Vol. 27, No. 1, 1957, pp. 3-26.
- C. C. Mason and R. L. Folk, “Differentiation of Beach Dune and Aeolian Environments by Size Analysis, Mustang Island, Texas,” Journal of Sediment Petrology, Vol. 28, 1956, pp. 211-226.
- G. M. Friedmann, “Dyanamic Processes and Statistical Parameters Compared for Size Frequency Distribution of Beach and River Sands,” Journal of Sediment Petrology, Vol. 37, No. 2, 1967, pp. 327-354.
- H. S. Valia and B. Cameron, “Skewness as Paleoenvironmental Indicators,” Journal of Sediment Petrology, Vol. 4, 1977, pp. 784-793.
- G. C. Malvarez, G. A. G. Cooper and D. W. T. Jackson, “Relationship between Wave Induced Currents and Sediments Grain Size on a Sandy Tidal Flat,” Journal of Sediment Research, Vol. 71, 2001, pp. 705-712. doi:10.1306/2DC40961-0E47-11D7-8643000102C1865D
- G. Kumar, A. L. Ramanathan and K. Rajkumar, “Textural Characteristics of Surface Sediments of a Tropical Mangrove Ecosystem, Gulf of Kuchchh Gujarat India,” Indian Journal of Marine Sciences, Vol. 39, No. 3, 2010, pp. 415-422.
- A. K. Ray, S. C. Tripathy, S. Patra and V. V. Sarma, “Assessment of Godavary Estuarine Mangrove Ecosystem through Trace Metal Studies,” Environment International, Vol. 32, No. 2, 2006, pp. 219-223. doi:10.1016/j.envint.2005.08.014
- J. Baruah, P. Kotoky and J. N. Sarma, “Textural and Geochemical Study on River Sediments: A Case Study from the Jhanji River Assam,” Journal of Indian Association Sedimentologists, Vol. 16, No. 2, 1997, pp. 195-206.
- G. M. Friedman, “On Sorting Sorting Coefficients and Log Normality of the Grain Size Distribution of Sandstone,” Journal of Geology, Vol. 70, 1962, pp. 737-756
- F. T. Fursich, W. Oschmann, I. B. Singh and A. K. Jaitly, “Hardgrounds, Reworked Concretion Levels and Condensed Horizons in the Jurassic of Western India: Their Significance for Basin Analysis,” Journal of the Geological Society, Vol. 149, 1992, pp. 313-331. doi:10.1144/gsjgs.149.3.0313
- V. P. Rao and B. R. Rao, “Provenance and Distribution of Clay Minerals in the Sediments of the Western Continental Shelf and Slope of India,” Continental Shelf Research, Vol. 15, No. 14, 1995, pp. 1757-1771.
- S. B. Shukla, A. K. Patidar and N. Bhatt, “Application of GPR in the Study of Shallow Subsurface Sedimentary Architecture of Modwa Spit, Gulf of Kachchh,” Journal of Earth System Science, Vol. 117, No. 1, 2008, pp. 33- 40. doi:10.1007/s12040-008-0010-5
- P. E. Biscaye, “Mineralogy and Sedimentation of Recent Deep Sea Clay in the Atlantic Ocean and Adjacent Seas and Oceans,” Bulletin Geological Society of America, Vol. 76, No. 7, 1965, pp. 803-832. doi:10.1130/0016-7606(1965)76[803:MASORD]2.0.CO;2
- C. E. Weaver, “Clays, Muds and Shales,” Elsevier, Amsterdam, 1989, p. 819.
- G. Millot, “Geology of Clays,” Springer-Verlag, New York, 1970, p. 375.
- R. M. Corbeanu, K. Soegaard, R. B. Szerbiak, J. B. Thurmond, G. A. McMechan, D. Wang, S. Snelgrove, C. B. Forster and A. Menitove, “Detailed Internal Architecture of a Fluvial Channel Sandstone Determined from Outcrop, Cores and 3-D Ground-Penetrating Radar: Example from the Middle Cretaceous Ferron Sandstone, East-Central Utah,” AAPG Bulletin, Vol. 85, No. 9, 2001, pp. 1583-1608.
- S. Van Heteren, D. M. FitzGerald, P. A. Mckinlay and I. V. Buynevich, “Radar Facies of Paraglacial Barrier Systems: Coastal New England, USA,” Sedimentology, Vol. 45, No. 1, 1998, pp. 181-200. doi:10.1046/j.1365-3091.1998.00150.x
- C. J. Schenk, D. L. Gautier, G. R. Olhoeft and J. E. Lucius, “Internal Structure of an Aeolian Dune Using Ground Penetrating Radar,” Special Publication of International Association of Sedimentologists, Vol. 16, 1993, pp. 61-69.
- S. Costas, I. Alfjo, F. Rial, H. Lorenzo and M. A. Nombela, “Cyclical Evolution of a Modern Transgressive Sand Barrier in Northwestern Spain Elucidated by GPR and Aerial Photos,” Journal of sedimentary Research, Vol. 76, No. 9, 2006, pp. 1077-1092. doi:10.2110/jsr.2006.094
- A. Neal, J. Richards and K. Pye, “Sedimentology of Coarse Clastic Beach Ridge Deposits, Essex, Southeast England,” Sedimentary Geology, Vol. 162, No. 3, 2003, pp. 167-198.
- M. J. Aitken, “An Introduction to Optical Dating: The Dating of Quaternary Sediments by the Use of PhotonStimulated Luminescence,” Oxford University Press, New York, 1998, p. 280.
- A. K. Singhvi and N. Porat, “Impact of Luminescence Dating on Geomorphological and Palaeoclimate Research in Drylands,” Boreas, Vol. 37, No. 4, 2008, pp. 536-558. doi:10.1111/j.1502-3885.2008.00058.x
- F. T. Fursicha, I. B. Singhb, M. Joachimskic, S. Krummc, M. Schlirf and S. Schlirf, “Palaeoclimate Reconstructions of the Middle Jurassic of Kachchh (Western India): An Integrated Approach Based on Palaeo Ecological, Oxygen Isotopic, and Clay Mineralogical Data,” Palaeogeography, Palaeoclimatology, Palaeoecology, Vol. 217, No. 3-4, 2005, pp. 289-309. doi:10.1016/j.palaeo.2004.11.026
- F. T. Fursich, D. K. Pandey, J. H. Callomon, W. Oschmann and A. K. Jaitly, “Contributions to the Jurassic of Kachchh, Western India: II. Bathonian Stratigraphy and Depositional Environment of the Sadhara Dome, Pachchham Island,” Beringeria, Vol. 12, 2008, pp. 95-125.