Journal of Minerals and Materials Characterization and Engineering
Vol.02 No.05(2014), Article ID:49987,13 pages
10.4236/jmmce.2014.25048
The Effect of Copper Addition on the Mechanical and Wear Properties of Grey Cast Iron
J. O. Agunsoye, S. A. Bello, S. B. Hassan, R. G. Adeyemo, J. M. Odii
Department of Metallurgical and Materials Engineering, University of Lagos, Lagos, Nigeria
Email: jagunsoye@unilag.edu.ng, adekunle_b@yahoo.com, profsbolajihassan@gmail.com, judicodi@yahoo.com
Copyright © 2014 by authors and Scientific Research Publishing Inc.
This work is licensed under the Creative Commons Attribution International License (CC BY).
http://creativecommons.org/licenses/by/4.0/


Received 27 May 2014; revised 8 July 2014; accepted 17 July 2014
ABSTRACT
An alloy of cast iron and copper (Fe-Cu) has been developed using a stir cast process. The compositional, microstructural characterization and wear property of the developed Fe-Cu alloy were carried out with the aids of X-ray diffractometer, scanning electron microscope (SEM) and pin on Disc machine. The mechanical properties such as hardness and impact energy were investigated. Wear linear equations were generated with the aids of MATLAB linear fitting. The results revealed that the presence of copper (99% pure) in the melt of grey cast iron inhibited the formation of cementite. However, the impact energy of the grey cast iron increased with %weight (wt) of copper addition. Hence, the hardness and wear resistance of the developed Fe-Cu alloy were sacrificed. Hence, the developed Fe-Cu alloy is an excellent material which can be used in the vibration damping application especially in the shock absorber.
Keywords:
Wear Resistance, Linear Curve Fitting, Toughness, Enhancement, Development

1. Introduction
Copper and its alloy have been known with their moderate hardness, ductility and high electrical conductivity, machinability and corrosion resistance. Their high surface area to volume ratio has reduced their use from overhead wire. However, they are used as alloy for architectural applications, biofouling resistance, electrical housing wiring, electrodes and heat exchangers. The toxicity of copper on aquatic bacteria and algae has contributed to the use of copper in alloy development for undersea applications. Copper and its alloy are among the most versatile engineering materials. However, copper has found been in use both as parent metal and alloy elements in the development of alloy materials for various engineering applications [1] [2] .
Cast iron is an iron alloy characterized by its relatively high carbon content (usually 2% to 4%). When molten, cast iron solidifies some of the carbon precipitates as graphite, forming tiny, and irregular flakes within the crystal structure of the metal [2] . While the graphite enhances the desirable properties of cast iron, the flakes dis- rupt the crystal structure and precipitate cracks, leading to cast iron’s characteristic brittleness. Nevertheless, it has found applications as an inexpensive and readily available material. Cast irons are widely used today in every sphere of life. It is universally used for the manufacturing of piston rings and cylinder liners. Unique characteristics of cast iron include the combination of good mechanical properties, economical manufacturing processes, excellent friction and wear characteristics.
The excellent wear resistance of grey cast iron during dry sliding in low loading conditions is attributed to the feeding of the contact surface by graphite flakes and formation of a graphite film on the contact surface [3] -[5] . It is generally accepted that a pearlitic structure of the matrix and an ASTM A type graphite flake provides the best wear resistance for grey cast iron in engine cylinder bore applications [6] [7] . Generally, wear resistance has been found to be dependent on matrix microstructure, carbide types and characteristics (size, morphology, distribution, orientation), [8] and the volume fraction, fracture toughness and hardness of the alloys [9] -[11] . It also depends on loading conditions, the features of the tribological environments, the relative movement of the contact surface and the type and size of the abrasive bodies [12] .
In alloy cast iron, the graphite morphology can be divided into three types: flake-like, vermicular-like and spherical-like. The alloying elements can modify the matrix microstructure, graphite morphology and mechanical properties of alloy cast iron. The silicon and some rare earth elements can transform the graphite morphology from flake-like to vermicular-like or spherical-like. Different functional alloy cast irons, such as grey cast iron, spherical cast iron, vermicular cast iron, and ductile cast iron, can be obtained by adding different alloying elements [13] -[17] . The effect of alloying element on the wear characteristic of grey cast iron has also been considered [18] -[21] . In this work, the effects of copper additions on wear and mechanical properties of grey cast iron were studied. The work was also aimed to enhance the toughness of the grey cast iron.
2. Material and Methodology
A grey cast iron classified as NFGrey (8) used was sourced from Nigerian Foundries, Ilupeju Lagos. The compositional analysis carried out on the grey cast iron revealed that it contains 3.32% C, 1.89% Si, 0.33% Mn, 0.12% P, 0.11% S and the remaining 94.24% being the iron (Fe). A melt of grey cast iron without the addition of copper was made. The melt serves as the control batch of the study. Subsequent melts of similar compositions were made with incremental addition of copper as alloying element corresponding to 1 - 4 wt%. The samples were cast in a local foundry at New Garage, Lagos, Nigeria in a 60 Kg capacity crucible furnace. Five cope and drag sand moulds were produced using two wooden patterns each of dimensions 12 × 12 × 205 mm as presented in Plate 1. A green sand mould was prepared from a mixture of dried fresh silica sand, bentonite, water and boiled starch with a cope and drag moulding boxes in accordance with BS 14 standard. The moulds were labelled A, B, C D and E respectively. The melt was poured at 1250˚C ± 5˚C into the improvised mould cavity (see Plates 2 and 3).
The first batch of meltings that corresponds to iron (control sample) without addition of the copper was poured into the mould labelled A. Then, 1 wt% copper was added to the molten grey cast iron in the crucible and thoroughly stirred with dry hard wooden stick. The alloy mixture was poured at 1220˚C into the mould labelled B. This procedure was repeated for additional three times with increasing wt% (2%, 3% and 4%) of copper. The cast iron-copper alloy melt was allowed to cool to room temperature (38˚C) while in the mould. The as cast ingots were carefully removed from the moulds after cooling (see Figures 1-4).
The cast ingot was fettled to remove the sand grain and gating system was cut off with angle grinder. For proper identification, the castings were labelled immediately after it was cut off. The unfettled cast sample is presented in Figure 5.
Representative sample from each grey cast iron-copper cast ingot was shaped to standard coupons.
The composition of the phase present in the alloy matrix was analyzed with the aid of X-ray diffractometer. The prepared sample was subject to microstructural analysis to investigate the morphology and distribution of the phases in the iron matrix. Scanning Electron Microscope model EVOMA 10 LaB6 Analytical VP-SEM at 20 KV was used.

Figure 1. The cope and drag mould.

Figure 2. 60 kg crucible furnace.
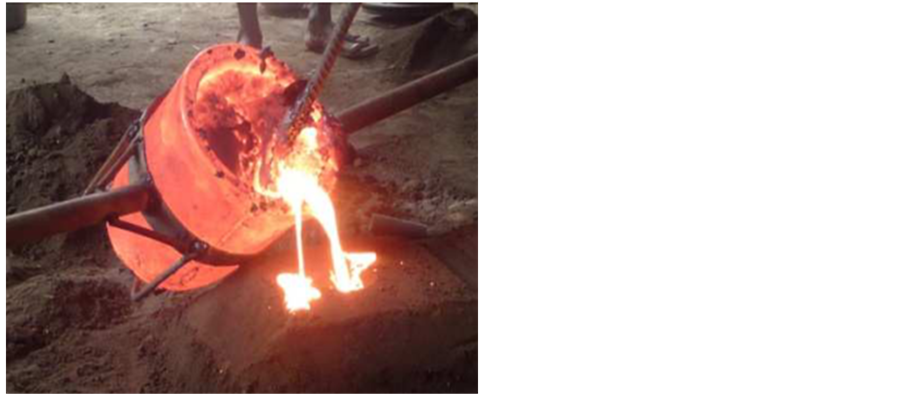
Figure 3. Pouring into mould.
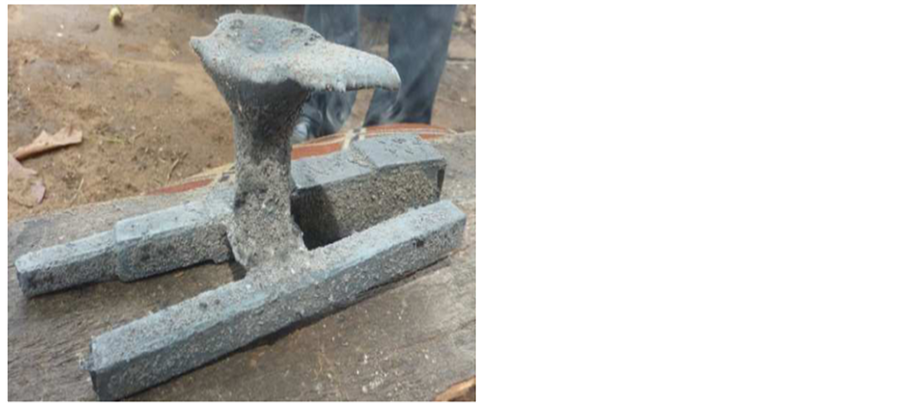
Figure 4. The as-cast grey cast iron-copper alloy.

Figure 5. The fettled sample.
Each sample prepared for hardness test of each grey cast iron-copper alloy was loaded in accordance with the American Society for Testing and Materials (ASTM E10) to determine the hardness values using Rockwell Hardness Tester Machine. The average hardness values were calculated.
The 60 × 10 × 10 mm sample of each cast iron developed was subjected to impact energy test with the aid of Avery-Denison Universal Impact Testing Machine to measure its ability to absorb energy impact in accordance with provision in ASTM D256-93.
The sliding wear resistance of the developed grey cast iron was investigated with the aid of pin on disc machine. The initial weight of the coupon before the test and final weight after each test were measured with the aid of a digital electronic measuring scale with ±0.001 accuracy. After each test, the third body particles deposited on the emery paper was blown off with the aids of air blower. Before the final weight was taken, the surface of the coupon under test was cleaned with the white cotton wool soaked in acetone. The surface of the sample was placed against a 200 mm diameter surface 120 µm mesh emery paper mounted on the pin on disc, rotating at a speed of 2.36 m·s−1 under an applied load of 10 N for 60 s. The same procedure was repeated on the same sample for four times keeping the parameters constant and volume loss was calculated in each case using Equation (1).
 (1)
(1)
The average volume loss was calculated. The process was repeated on the same coupon under increasing applied loads and corresponding volume loss was calculated in each case. The processes were repeated on the coupon under the same applied loads but higher speed (4.72 m∙s−1) of disc rotation. The sliding distance and sliding moments were calculated using Equations (2) and (3) respectively:
 (2)
(2)
 (3)
(3)
The spectrometric analysis was carried out on the coupon of each sample of the developed cast irons with the aids of Hilger Analytical Direct Optical light Emission Polyvac Spectrometer E980C.
3. Results and Discussion
3.1. XRD Profiles
Figure 6 shows the distribution of the phases present in the matrix of the grey cast iron (control sample) as obtained from X-ray diffractometer. Figure 6 revealed the presence of the following compounds in the iron matrix: cementite having the highest peak value (count score), followed by carbon iron silicide and other compounds in that order (see Table 1). The compounds formed by the chemical reaction of metallic components with carbon are as a result of gradual cooling of the melt from the pouring temperature to the ambient temperature.
Figure 7 represents the XRD phase distribution for the grey cast iron 0.21% copper alloy (Fe 0.21% Cu). The maximum reflection of spot (count score) and chemical formula of the intermetallic compounds present in the matrix is presented in Table 2. The new compounds formed such as cementite (Fe3C) and iron silicide (FeSi) are due to the chemical reaction of iron with carbon and silicon in the molten bath of grey cast iron under gradual cooling of the melt.
Figure 8 represents the XRD phase distribution for the grey cast iron-0.53% copper alloy. The peak value or maximum reflection of spot (count score) and chemical formula of the intermetallic compounds present in the matrix is presented in Table 3. The newly formed compound i.e. iron phosphide is attributable to chemical reaction of iron atoms with phosphorus as the percentage composition of copper addition increased.

Table 1. The count score, name and chemical formula of identified compounds in the matrix of the control cast iron sample.
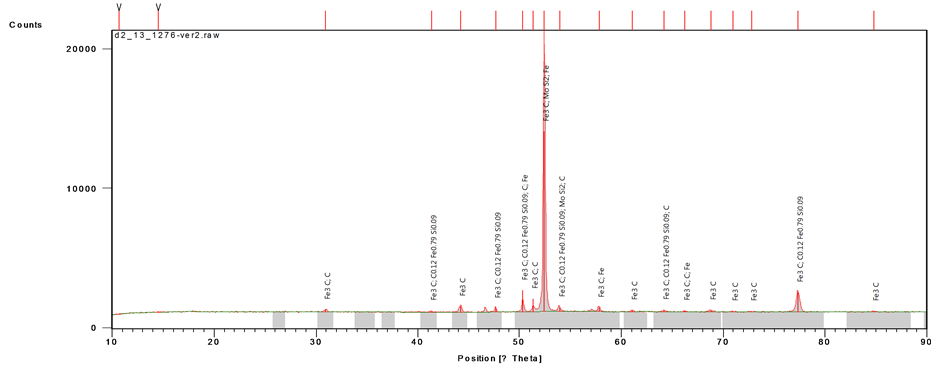
Figure 6. XRD compositional analysis of the control cast iron sample.
Table 2. The count score, name and chemical formula of identified compounds in the matrix of the Fe 0.21 Cu cast iron sample.
Table 3. The count score, name and chemical formula of identified compounds in the matrix of the Fe 0.53 Cu cast iron sample.
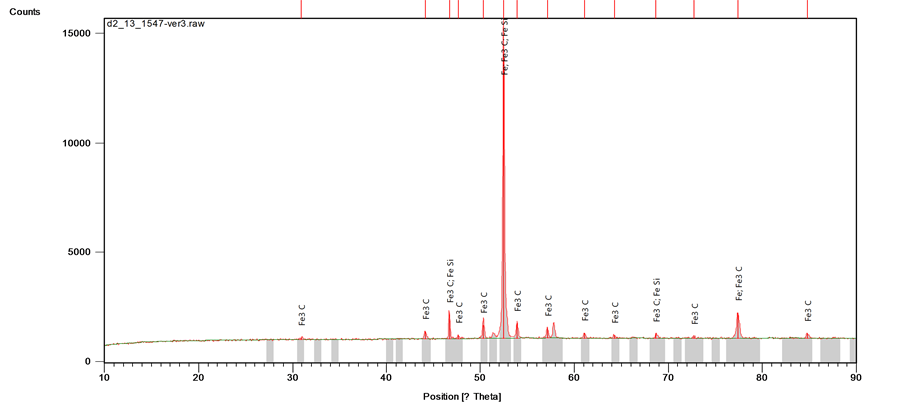
Figure 7. XRD compositional analysis of the Fe 0.21 Cu cast iron sample.
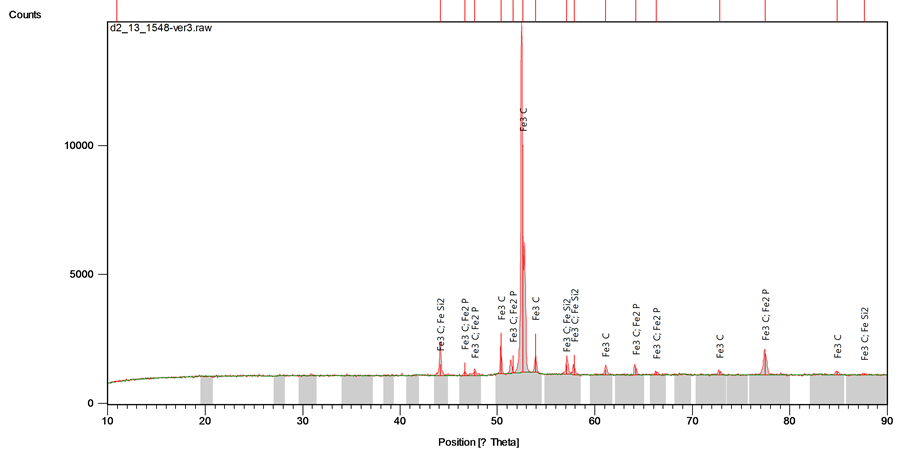
Figure 8. XRD compositional analysis of the Fe 0.53 Cu cast iron sample.
3.2. Microstructural Analysis
Figure 9 shows the SEM micrograph of the grey cast iron (the control) and the corresponding EDS in Figure 10. The high concentration of cementite epitaxy is attributable to high hardness value and wear resistance of the control grey cast iron.
Figure 11 and Figure 12 show the SEM micrographs of grey cast iron-copper alloys (Fe 0.21 Cu; Fe 0.53 Cu) and the corresponding EDS in Figure 13 and Figure 14. Figures revealed that there is reduction in epitaxial shapes. Hence, the concentration of the grain boundary cementites in the ledeburite matrix decreased. This agrees with the count scores in Table 2 and Table 3. The decreased concentration of cementites in the matrix of the alloy is responsible for reduction in the hardness values and wear resistance (see Figure 15, Figure 17 and Figure 18). However, there are enhancement in their impact energy due to higher proportion of the tougher, more ductile and soft ledeburite (see Figure 16).

Figure 9. SEM micrograph of the control sample (×500).
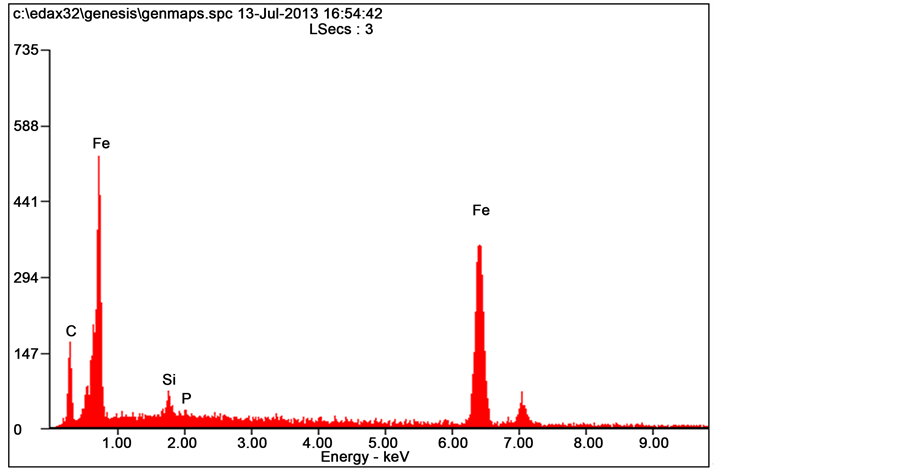
Figure 10. EDS of the control sample.
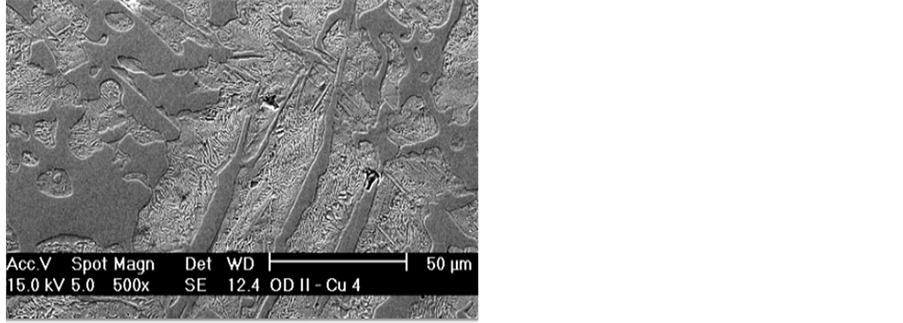
Figure 11. SEM micrograph of the Fe 0.21 Cu sample (×500).
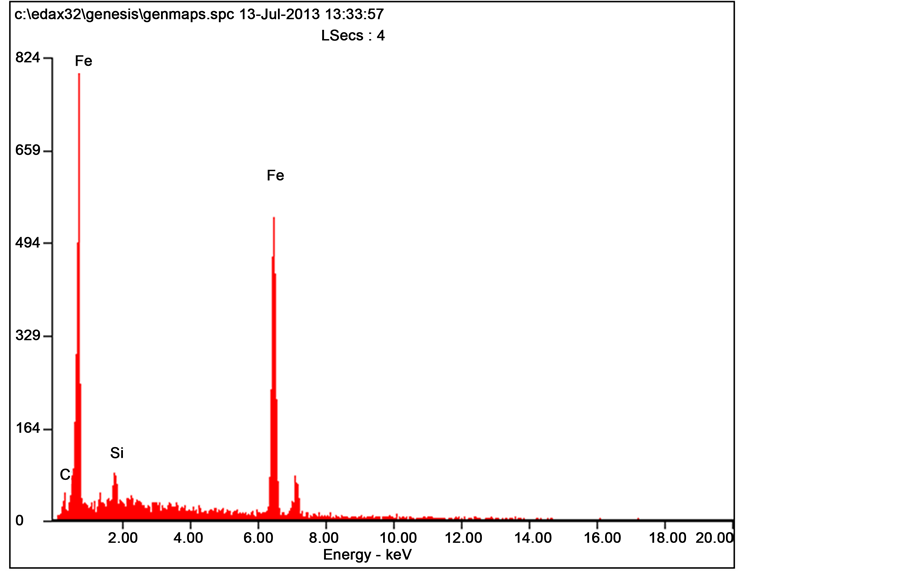
Figure 12. EDS of the Fe 0.21 Cu sample.

Figure 13. SEM micrograph of the Fe 0.53 Cu sample (×500).
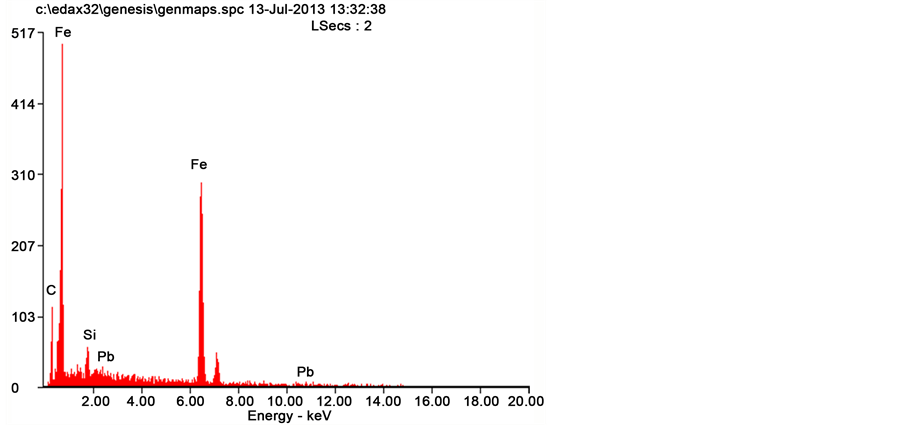
Figure 14. EDS of the Fe 0.53 Cu sample.

Figure 15. Hardness of the developed cast iron with wt% of copper addition.

Figure 16. Impact energy of the developed cast iron with wt% of copper addition.
3.3. Hardness Values
Figure 15 shows the relationship between the average Rockwell hardness values and wt% of copper addition. It was discovered that the hardness values of the developed cast iron decreased as the wt% of copper addition increased. This may be attributed to the formation of more-fine ledeburite as the wt% of copper addition increased (see Figure 9, Figure 11 and Figure 13).
3.4. Impact Energy
Figure 16 shows the relationship between the impact energies and wt% of copper addition. It was observed that the impact energy increased as the wt% of copper additions increased. However, the incorporation of copper in the grey cast iron favoured the formation of alternate lamellar layers of fine ledeburites which are characterized with high toughness and ductility.
3.5. Wear Resistance
Figure 17 and Figure 18 represent the relationship between volume loss of the developed Fe-Cu alloy cast iron and sliding moment. Generally, it was observed that the volume loss increased as the sliding moment increased and wt% copper addition to the grey cast iron increased. However the wear resistance of the developed cast iron decreased with wt% of copper additions (see Figure 12). This may be attributable to decreased hardness values of the cast iron as the wt% of the copper addition increased. However, the developed cast iron-copper alloy is an excellent material which can be used in vibration damping application especially in shock absorbers which require low wear resistance.
The approximate linear equation of each curve in Figure 17 and Figure 18 was obtained with the use of the MATLAB linear curve fitting (see Equations (4)-(13)).
Linear wear equation at 2.36 m·s−1
 (4)
(4)
 (5)
(5)

Figure 17. Wear loss (cm3) with sliding moment (N.m) of the developed Fe-Cu cast iron at 2.36 m∙s−1.
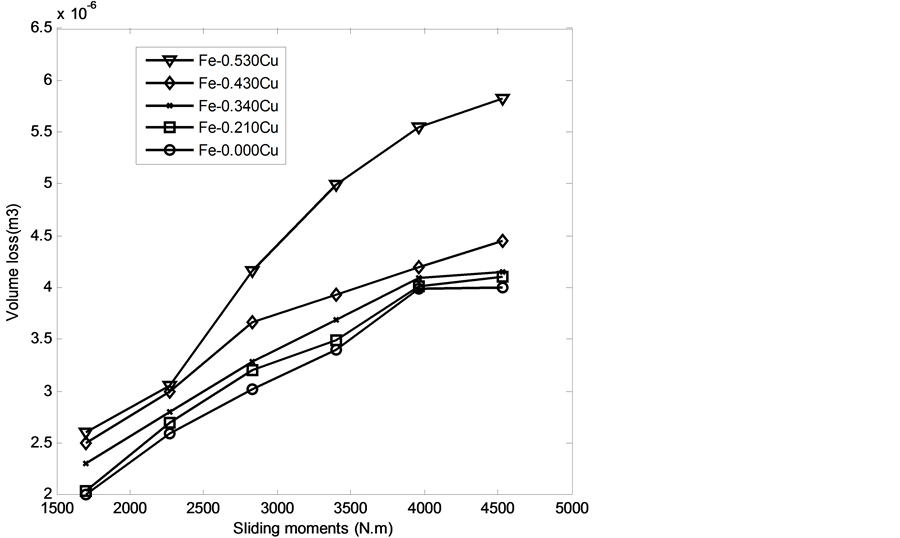
Figure 18. Wear loss (cm3) with sliding moment (N.m) of the developed Fe- Cu cast iron at 4.72 m∙s−1.
 (6)
(6)
 (7)
(7)
 (8)
(8)
Linear wear equation at 4.72 m·s-1
 (9)
(9)
 (10)
(10)
 (11)
(11)
 (12)
(12)
 (13)
(13)
The wear coefficients i.e. the gradient of the wear lines was obtained with the use of the first differential approach and wear resistance was also calculated using Equation (14) (see Table 4).
 (14)
(14)
Figure 19 shows the relationship between wear resistance and copper addition. It was observed that the material offered more resistance to wear as the speed increased. This may be attributed to the reduction in the friction which is as a result of the worn particles at interphase between the alloy sample and emery paper. However, the nature of interphase between two sliding bodies in contact is an important parameter in investigating the wear behaviour of the materials.
The improved wear behaviour of the cast iron-copper alloy as the speed increase may also be attributed to high bearing capacity of the tough copper addition as well as better interfacial bonding between the parent metal and alloy elements which prevent the possibility of pull (Agunsoye et al., 2013; Basavarajappa et al., 2009).
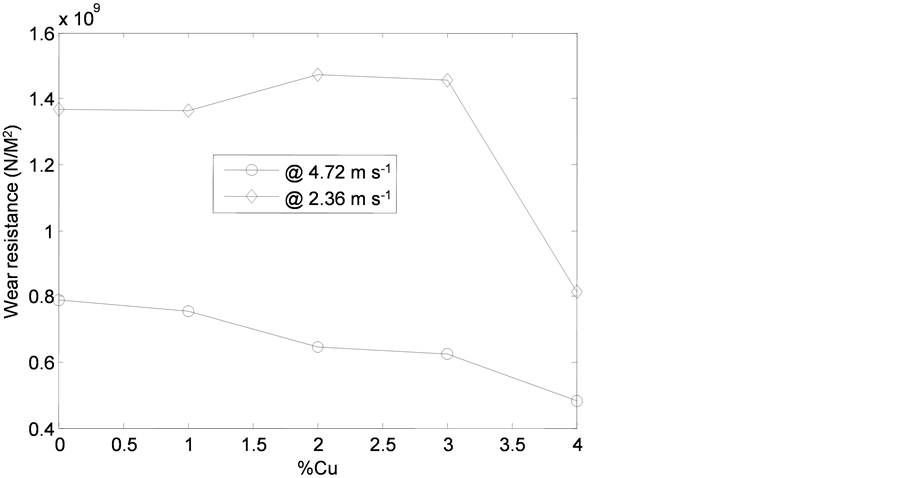
Figure 19. Wear resistance of the developed cast iron-Cu alloy with % copper additions.
Table 4. Wear coefficients and resistances of the cast iron-copper alloy.
3.6. Spectrometric Compositional Analysis
The elemental composition analysis of the control cast iron and the developed cast irons as obtained from the spectrometer was presented on Table 5.
4. Conclusions
From results and discussion, the following conclusions can be drawn:
The incorporation of copper in NFGrey (8) enhanced the toughness of the NFG (8) cast iron. Hence, the hardness and wear resistance are sacrificed.
The developed cast iron-copper alloy offered more resistance to wear as the speed increased.
Table 5. Elemental compositional analysis of the control and the developed cast irons.
The presence of copper particulates in the melt of NFGrey (8) cast iron inhibited the formation of cementite. However, the proportion of cementite in the ledeburite matrix decreased as the copper particulates addition increased.
The wear resistance of the developed cast iron-copper alloy decreased with increase in wt% of copper particulate addition.
Acknowledgements
The authors wish to acknowledge the valuable contribution of Engr Ogundare of the Engineering Material Development Institute, Akure Ondo Sate Nigeria and Raheem of Physics Department, University of Lagos, Akoka Lagos for their assistance in carrying out some tests.
References
- Chen, S.-Z., Lin, J.-H.C. and Ju, C.-P. (2003) Effect of Aluminum Content on Tribological Behavior of a Cu-Fe-C Based Friction Material Sliding against FC30 Cast Iron. Materials Transactions, 44, 787-793. http://dx.doi.org/10.2320/matertrans.44.787
- Gourahari, B. and Soumya, R.S. (2012) Effect of Copper on the Properties of Austempered Ductile Iron Castings. A Thesis for Bachelor of Technology Submitted to Department of Metallurgical and Materials Engineering, National Institute of Technology, Roukella.
- Takeuchi, E. (1968) The Mechanisms of Wear of Cast Iron in Dry Sliding. Wear, 11, 201-211. http://dx.doi.org/10.1016/0043-1648(68)90558-9
- Montgomery, R.S. (1969) Run-In and Glaze Formation on Grey Cast Iron Surfaces. Wear, 14, 99-105. http://dx.doi.org/10.1016/0043-1648(69)90340-8
- Sugishita, J. and Fujiyoshi, S. (1981) The Effect of Cast Iron Graphites on Friction and Wear Performance I: Graphite Film Formation on Grey Cast Iron Surfaces. Wear, 66, 209-221. http://dx.doi.org/10.1016/0043-1648(81)90115-0
- Davis, J.R. (1998) Metal Hand Book. Desk Edition, ASM International, Chargin Falls, Ohio, 1474-1600.
- Leech, P. and Borland, D. (1983) The Unlubricated Wear of Flake Graphite Cast Iron. Wear, 85, 257-266. http://dx.doi.org/10.1016/0043-1648(83)90068-6
- Dogan, O.N. and Hawk, J.A. (1995) Effect of Carbide Orientation on Abrasion of High Cr White Cast Iron. Wear, 189, 136-142. http://dx.doi.org/10.1016/0043-1648(95)06682-9
- Ghar, K.H.Z. (1998) Wear of Hard Particles. Tribology International, 31, 587-596. http://dx.doi.org/10.1016/S0301-679X(98)00079-6
- Berns, H. (2003) Comparison of Wear Resistant MMC and White Cast Iron. Wear, 254, 47-54. http://dx.doi.org/10.1016/S0043-1648(02)00300-9
- Cetinkaya, C. (2006) An Investigation of the Wear Behaviors of White Cast Irons under Different Compositions. Materials & Design, 27, 437-445. http://dx.doi.org/10.1016/j.matdes.2004.11.021
- Agunsoye, J.O., Talabi, S.I., Awe, O. and Onwuegbuzie, A.T. (2013) Effect of Silicon Additions on the Wear Properties of Grey Cast Iron. Journal of Minerals and Materials Characterization and Engineering, 1, 61-67. http://dx.doi.org/10.4236/jmmce.2013.12012
- Vadiraj, A. and Balachandran, G. (2010) Wear Behavior of Alloyed Hypereutectic Gray Cast Iron. Tribology International, 43, 647-653. http://dx.doi.org/10.1016/j.triboint.2009.10.004
- Abedi, H.R., Fareghi, A., Saghafian, H. and Kheirandish, S.H. (2010) Sliding Wear Behavior of a Ferritic-Pearlitic Ductile Cast Iron with Different Nodule Count. Wear, 268, 622-628.
- Xu, W., Ferry, M. and Wang, Y. (2005) Influence of Alloying Elements on As-Cast Microstructure and Strength of Gray Iron. Materials Science and Engineering: A, 390, 326-333. http://dx.doi.org/10.1016/j.msea.2004.08.030
- Scandian, C., Boher, C., de Mello, J.D.B. and Rézaï-Aria, F. (2009) Effect of Molybdenum and Chromium Contents in Sliding Wear of High-Chromium White Cast Iron: The Relationship between Microstructure and Wear. Wear, 267, 401-408.
- Agunsoye, J.O., Ochulor, E.F., Talabi, S.I. and Olatunji, S. (2012) Effect of Manganese Additions and Wear Parameter on the Tribological Behaviour of NFGrey (8) Cast Iron. Tribology in Industry, 34, 239-246.
- Atanda, P., Oluwadare, G. and Oluwole, O. (2011) Effect of Silicon Content and Shake-Out Time on Hardness and Grain Size Properties of GL 250 Cast Iron. Journal of Minerals & Materials Characterization & Engineering, 10, 257- 266.
- Bedolla, A. and Rainforth, W. (2001) The Wear Behaviour of High-Chromium White Cast Irons as a Function of Silicon and Mischmetal Content. Wear, 250, 449-461. http://dx.doi.org/10.1016/S0043-1648(01)00633-0
- Odii John, M. (2013) The Effect of Copper Addition on The Mechanical and Wear Properties of NFGrey (8) Cast Iron. MSc Thesis Submitted to Department of Metallurgical and Materials Engineering, University of Lagos, Akoka, Lagos (Unplished).
- Riahi, A. and Alpas, A. (2003) Wear Map for Grey Cast Iron. Wear, 255, 401-409.