Journal of Minerals and Materials Characterization and Engineering
Vol.1 No.4(2013), Article ID:35102,16 pages DOI:10.4236/jmmce.2013.14028
Quantification of Phases in Lahore (Pakistan) Airborne Particulates by Matrix-Flushing Method
1Department of Physics, GC University, Lahore, Pakistan
2Centre for High Energy Physics, University of the Punjab, New Campus, Lahore, Pakistan
3Centre for Solid State Physics, University of the Punjab, New Campus, Lahore, Pakistan
Email: *khussain1947@gmail.com
Copyright © 2013 Naveed Ahmad et al. This is an open access article distributed under the Creative Commons Attribution License, which permits unrestricted use, distribution, and reproduction in any medium, provided the original work is properly cited.
Received April 6, 2013; revised May 24, 2013; accepted June 9, 2013
Keywords: Airborne Particulates; GFC Filters; Mass Concentration; Matrix-Flushing Method; Mass Spectrometry
ABSTRACT
The mass concentrations of eighteen airborne samples collected from Lahore (Pakistan) are found in the range from 595 to 3027 μg/m3 with average value of 1130 μg/m3. Most of these values are normal and as reported in the literature for other parts of the world. The major phases identified in the samples by the X-ray powder diffraction technique are Albite (Anorthite), Calcite, Clinochlore (Chlorite), Gypsum, Illite, Quartz and Talc which have also been reported by other researchers to be present in the airborne particulates of other world locations. The average weight percentages of the phases (minerals) in the samples are respectively 15.5, 10.6, 23.7, 2.4, 19.1, 20.2, and 8.5. Some of the elements (e.g., boron, cadmium, lithium, manganese, titanium, and zinc) quantified in two samples determined using a spark-source mass spectrometer appear also to derive their origin from man-made activities. However no compound synthesized in the atmosphere is detected by the X-ray diffraction method.
1. Introduction
This chemical characterization studies of airborne particulates using the X-ray Powder Diffraction (XRD) method have been carried out by many researchers for the last several years. Initially identification of minerals and chemical compounds formed in the atmosphere was done by some workers and the main purpose of such studies was to assess the role of airborne particulates of those phases in the atmospheric microphysical processes. It is now established that hydrophobic phases may promote ice nucleation and hygroscopic phases cause droplet condensation in natural atmospheric clouds [1,2]. A brief review of some studies carried out for qualitative and/or quantitative analysis of airborne particulates and most relevant to the present work is presented in the following paragraphs. To start with a XRD qualitative analysis of samples of different localities of the world is presented. Then the XRD quantitative analysis using different methods is briefly outlined.
The phases identified in SPM/airborne samples of different world locations are given in Table 1. In almost all these studies (and also in [3-14] the minerals/phases detected in the air were found to have their origin in the soils of the areas and in some the nearby industry and other pollution generating activities.
Quantitative analysis of the airborne particulates by the Matrix-flushing method has also been carried many times by researchers in the past several years after the introduction of the Chung method [15-17]. Some researchers did the quantitative analysis by using either the full-pattern (Rietveld) method or RIR method. See for example [18-33]. Such studies are very useful for assessing the effective role of the identified phases as ice nuclei or condensation nuclei in natural clouds. Findings of Roberts and Hallett [1] based on experimentation showed that only a few minerals are capable of ice nucleation in clouds. Hussain et al. [2] calculated the lattice mismatch of various minerals identified in suspended particulates with ice and found that Kaolinite airborne particles could be the best nucleant of ice in natural clouds and Quartz airborne particles are the worst nucleant. The suspended particulates also promote condensation of droplets when they have hygroscopic content.
2. Materials and Methods
There are several methods of quantitative analysis of
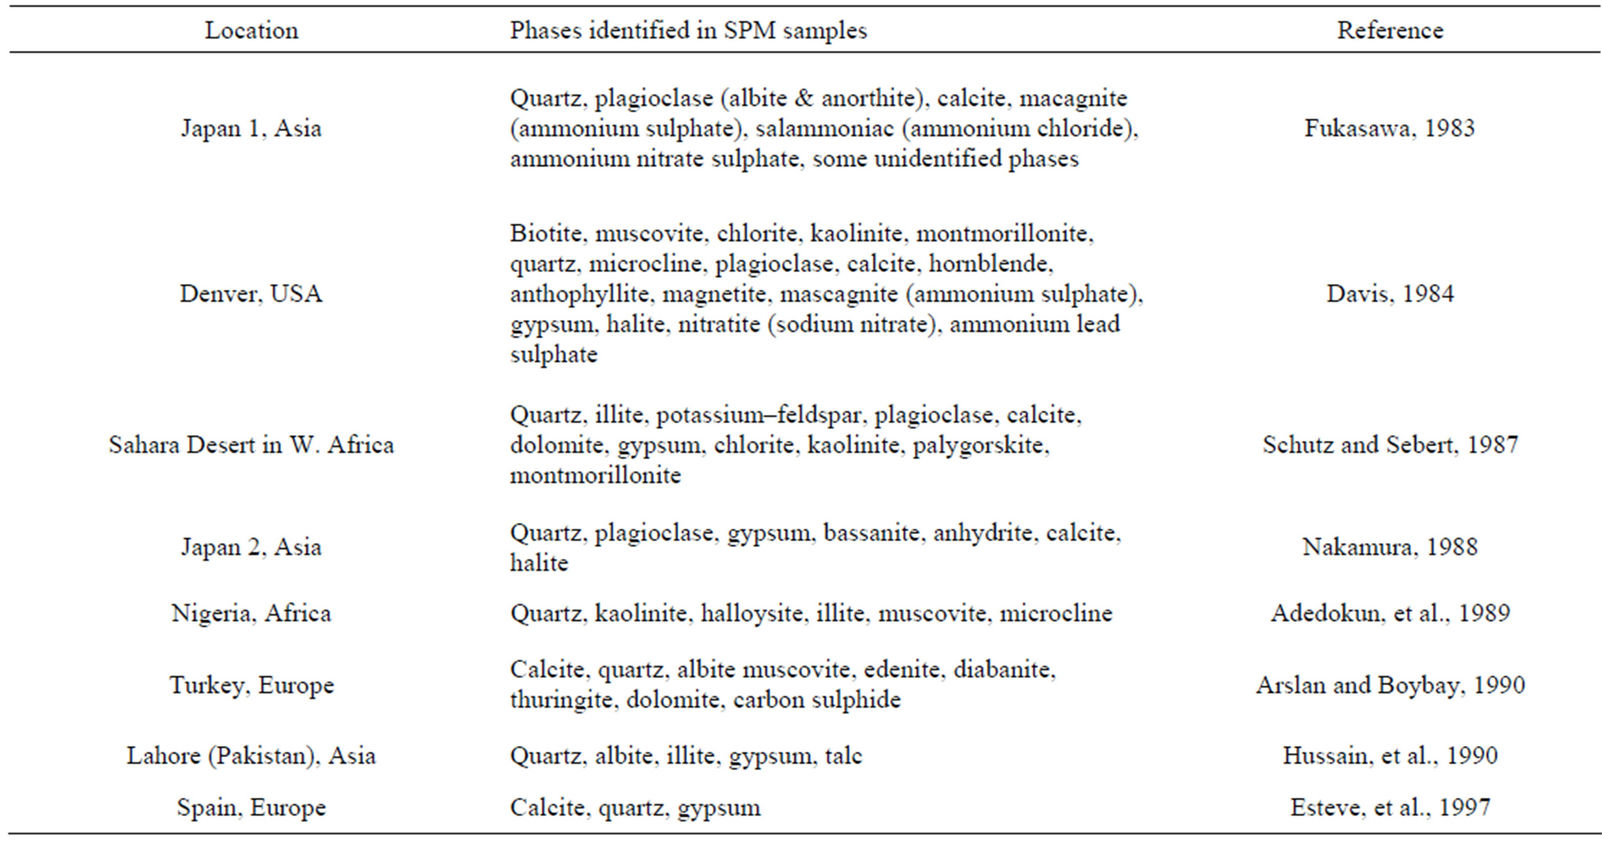
Table 1. Phases identified in SPM/airborne samples of different world locations.
phases in a mixture, namely, the Internal Standard Method, the Direct Comparison Method, and External Standard Method [34], the Matrix-Flushing Method is faster to apply and its results are as accurate as the other three methods [15-17]. This latter method was applied in the present study and it is described briefly here.
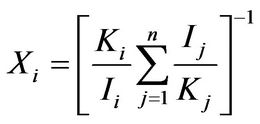
The quantitative analysis by any method of X-ray diffraction is based on the fact that the intensity of the diffraction pattern of a particular phase in a mixture of different phases depends on the concentration of that phase in the mixture. The relation between the intensity and concentration is not generally linear, because the diffracted intensity depends on the absorption coefficient of the mixture and this itself varies with the concentration. The expression for the intensity diffracted by a single phase powder specimen is
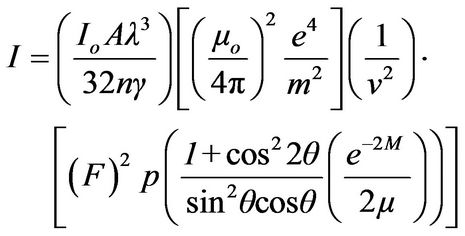 (1)
(1)
To find the relation between diffracted intensity and concentration of a phase α in a mixture of two phases α and β, the above expression can be modified to another expression, known as the basic intensity equation,
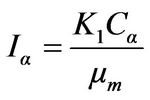 (2)
(2)
In this expression Iα is intensity of the selected line of α phase, μm is linear absorption coefficient of the mixture, Cα is volume fraction of α in the mixture, and Ki is a constant of unknown value.
Ki will be cancelled out if we measure the ratio of Iα to the intensity of some standard line. The concentration can then be found from this ratio.
In the matrix-flushing method, a fundamental “matrixflushing” concept is introduced. The calibration curve procedure as required particularly in the internal standard method is shunted. The internal standard method is much more time-consuming and costly. For the method to implement, one needs to get high purity phases as identified in the mixture along with a standard material like corundum or quartz. XRD data for high intensity peaks of the synthetic mixtures prepared in known proportions of those phases and the standard material are acquired and a calibration curve is plotted from the data. On the other hand the matrix-flushing method is much simpler and easier to apply; the matrix effect is totally eliminated and all components crystalline or amorphous can be determined. This concept provides an exact relationship between intensity and concentration free from matrix effect. If Xi and Ii are respectively the weight fraction and intensity of a component “i” in a mixture of “n” components, the basic intensity Equation (2) can be reduced as:
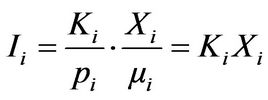 (3)
(3)
For the quantitative analysis of a mixture of “n” components, the above equation becomes a matrix equation, KX = 1, which has a unique solution if the rank of K matrix is equal to the rank of the (K, I) matrix. Thus
 (4)
(4)
The equation gives the percentage composition of a component “i”, when all the components are crystalline. In the equation, Ki is relative intensity ratio given by
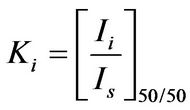 (5)
(5)
This ratio can be calculated by mixing the component “i” with a standard material “s” in a ratio of 50:50 by weight. The International Commission for Diffraction Data (ICDD) recommends Corundum (α-Al2O3) as the standard material for reference intensities because of its purity and stability. It is convenient to choose the same Corundum as a flushing agent for the same good reasons. Equations (4) and (5) are used to quantify phases in a mixture of phases.
In the present study, however, high purity Sylvite (KCl) was used to determine Ki values for the identified phases instead of Corundum because most of the minerals identified in the SPM samples have their maximum intensity diffraction peaks lying close to the sylvite maximum intensity peak. This is important because the various factors in Equation (1), particularly the Lorentz-Polarization factor and the absorption factor, at a constant temperature, have almost similar effects on the diffracted intensities. Figure 1 gives a comparison of the maximum intensity peaks of minerals with Corundum and Sylvite. The figure shows clearly that 2θ-value of maximum intensity peak for Sylvite is closer to those for Albite, Calcite, Chlorite (Cliochlore), Gypsum, Illite, Quartz and Talc whereas 2θ value of Corundum is larger than the 2θ values of all the mineral phases. Clearly the effect of the various factors which depend on 2θ values would be much less on peak intensity and hence the weight percentages of phases quantified in the mixture. For quantification of mineral phases, high purity reagent grade KCl (Sylvite) (99.8% pure: SIGMA-ALDRICH, Germany) was used in the present study. Its XRD pattern was obtained with the diffractometer conditions given in Table 2 before using it to develop Ki ratios with the minerals phases identified in aerosol samples. The observed KCl reflections resembled the NBS standard ICDD PDF card 4-587. Also the XRD pattern background was low and did not show any minor phases. The mineral phases identified in airborne particulates (namely, polycrystalline Albite of Katlang-Mardan, single crystal Calcite of Dandot, polycrystalline Chlorite of California, polycrystalline Gypsum of Khewra, Illite of Morris-Illinois, single crystal Quartz of Swat, and polycrystalline Talc of Swat) were arranged from Institute of Geology, University of the Punjab, Lahore. XRD data of the minerals phases were identified and found to closely match with data given in ICDD PDF Cards 9-457 (Albite), 5-586 (Calcite), 7-185 (Chlorite), 6-46 (Gypsum), 26-911 (Illite), 5- 490 (Quartz) and 19-770 (Talc). Homogeneous mixture of each mineral phase was prepared with Sylvite in the 50/50 weight ratio and was run under the same diffractometer conditions for obtaining Ki values (Table 2). The Ki ratios plotted in Figure 2 were used for quantification of minerals in the samples.
3. Results and Discussion
In this section qualitative and quantitative phase analysis of all aerosol samples and complete elemental analysis of samples collected from industrial/commercial sites are described.
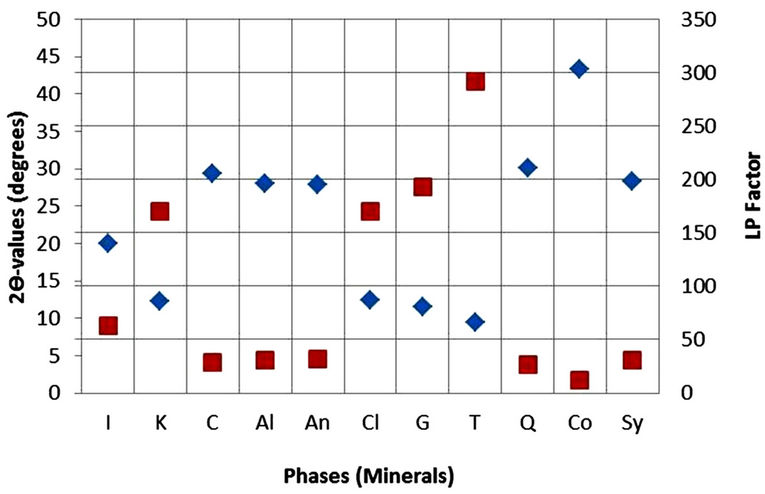
Figure 1. 2θ and LP values plotted against identified phases and corundum and sylvite.
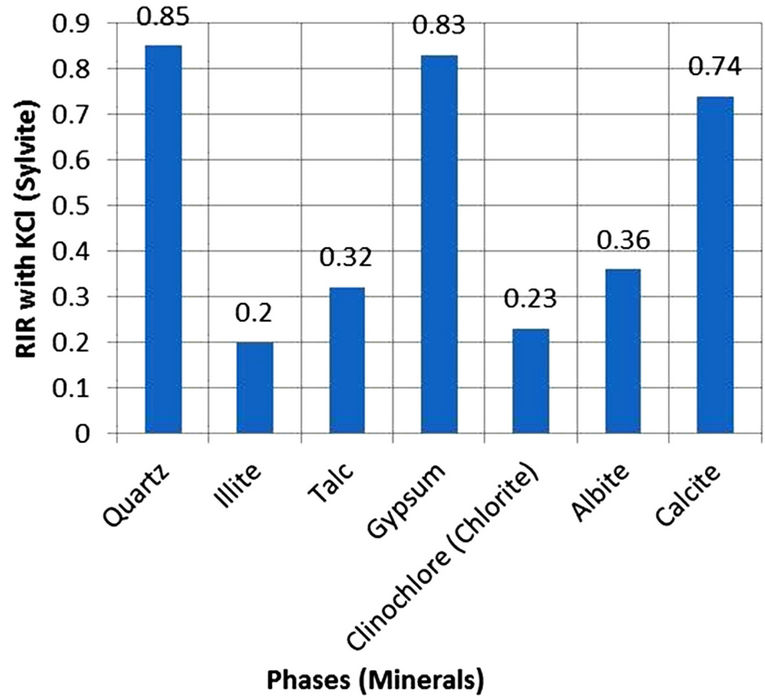
Figure 2. RIR values of minerals against Sylvite.
3.1. Qualitative Analysis
Twenty airborne particulate samples were collected for various locations in Lahore and Chichawatni, seventeen from Lahore and three from Chichawatni. In order to collect samples, the city of Lahore was divided into eight regions; 6 in the city and 2 in the suburbs. Out of 17 sites selected for sampling 4 sites were located in the semiurban parts of the city. Sites were selected taking into consideration residential, commercial and industrial areas of the city. However samples were collected from one city sites of Chichawatni. All the samples were collected on GFC filters (having 47 mm diameter and 0.7 µm pore size) after Battaglia [35] and Rowe et al. [36] provided phase/elemental analyses are to be carried out. The samples were collected using a low volume sampler (Rothroe & Ruislip Mitchell Ltd., Middlesex, UK) and sampling was done at a maximum flow rate of 40 liter/min. All the samples were collected continuously for eight hours duration and collected at a height of about 7.5 m from the ground. Table 3 records sample numbers, sampling sites and mass concentration of samples which is around 1000 µg/m3 for almost all samples except sample LHR-16 with exceptionally high concentration of 3027 µg/m3. Figure 3 shows variation of mass concentration of samples plotted against sample numbers.
In order to acquire XRD data for the airborne particulates, the Rigaku X-ray Powder Diffractometer (Model D-Max/II-A) was employed after its calibration using 5 N purity Si powder. The lattice parameter obtained from the XRD data of Si powder was found to have an accuracy of measurement better than ±0.0005 Å. This accuracy corresponds to the accuracy of measurement in the Bragg angle better than 0.02˚ (2θ). In order to acquire XRD data all the samples were then loaded one by one on to the diffractometer goniometer. The difractometer was run in the step-scan mode under the same conditions (Table 2) for obtaining data for Si and all airborne particulates. In order to minimize the background effects of the amorphous contents, if any, present in the SPM samples, a window to pass the diffracted beam to the detector was adjusted by the pulse height analyzer of the diffractometer system. So, minimizing the background of the XRD patterns in this well known procedure has shown little affect on the peak intensities.
Qualitative phase analysis of all the samples was carried out by the well-known Hanawalt method [37]. The analysis shows that the soil minerals such as Albite (Anorthite), Calcite, Chlorite (Clinochlore), Gypsum, Quartz, and Talc are contained in almost all samples. The major minerals detected in all airborne particulates with their chemical formulas and characteristic peaks are given in Table 4. The XRD data of the samples and the results of the qualitative analysis are given in Table 5. XRD patterns of some selected samples are reproduced with
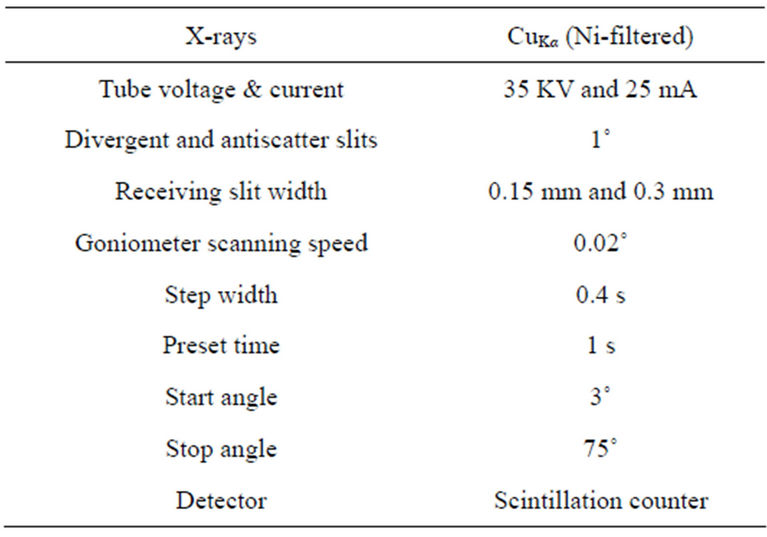
Table 2. Diffractometer conditions for acquiring XRD data.
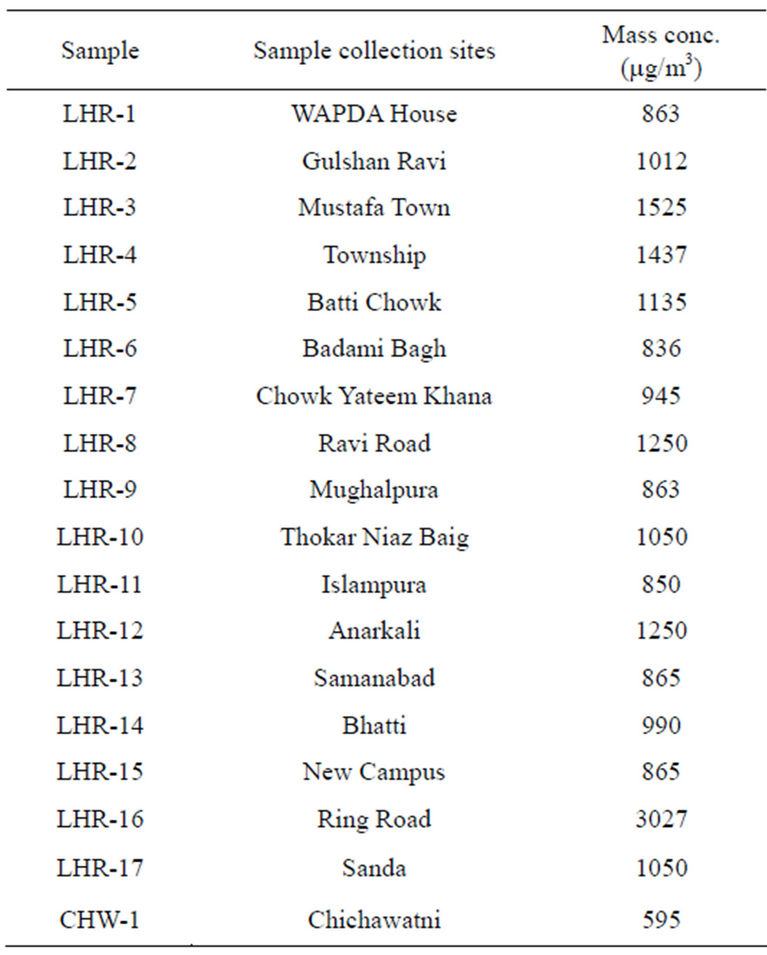
Table 3. Sampling sites and mass concentration of airborne samples.
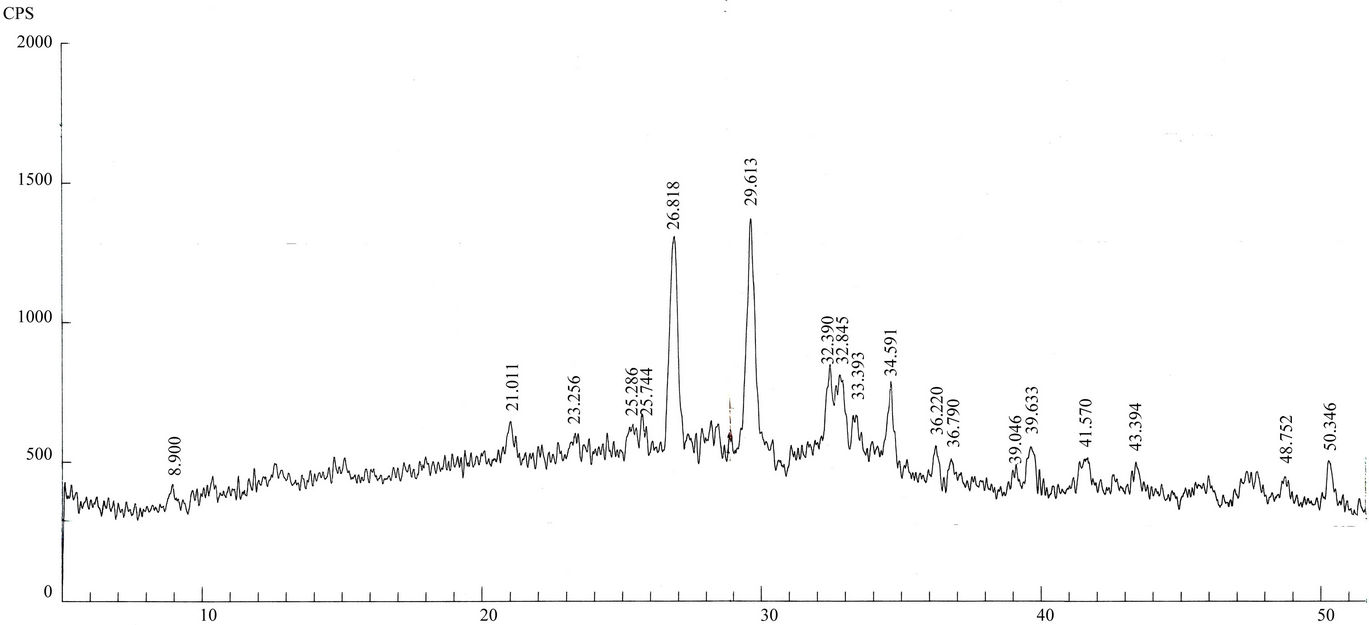
maximum intensity peaks in Figures 4(a)-(h). The detected minerals are the soil minerals introduced into the air through wind erosion. A preliminary study of the Lahore aerosols and the soil samples collected from close to the sampling sites had showed that the above mentioned minerals were present in almost all the samples [2]. The other worldwide studies reviewed in this paper also show presence of these and more soil minerals in the airborne particulates. The present results were also compared with the analyses of aerosols (SPM) reported in earlier studies. For example, the results reported for Nigerian [38], Denver [23], Japan [39,26] and Turkish [40] aerosols have
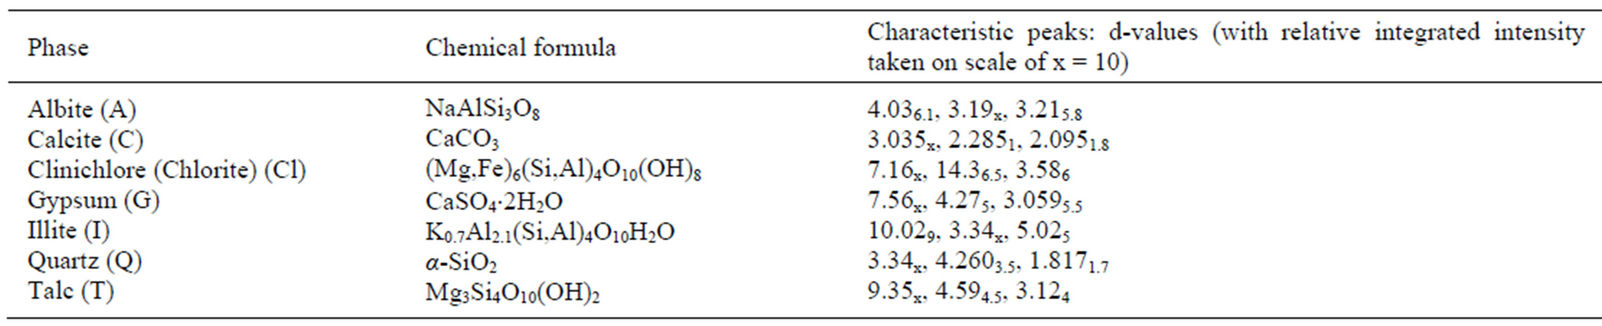
Table 4. Phases (minerals) detected in airborne samples along with chemical formulas and characteristic peaks.
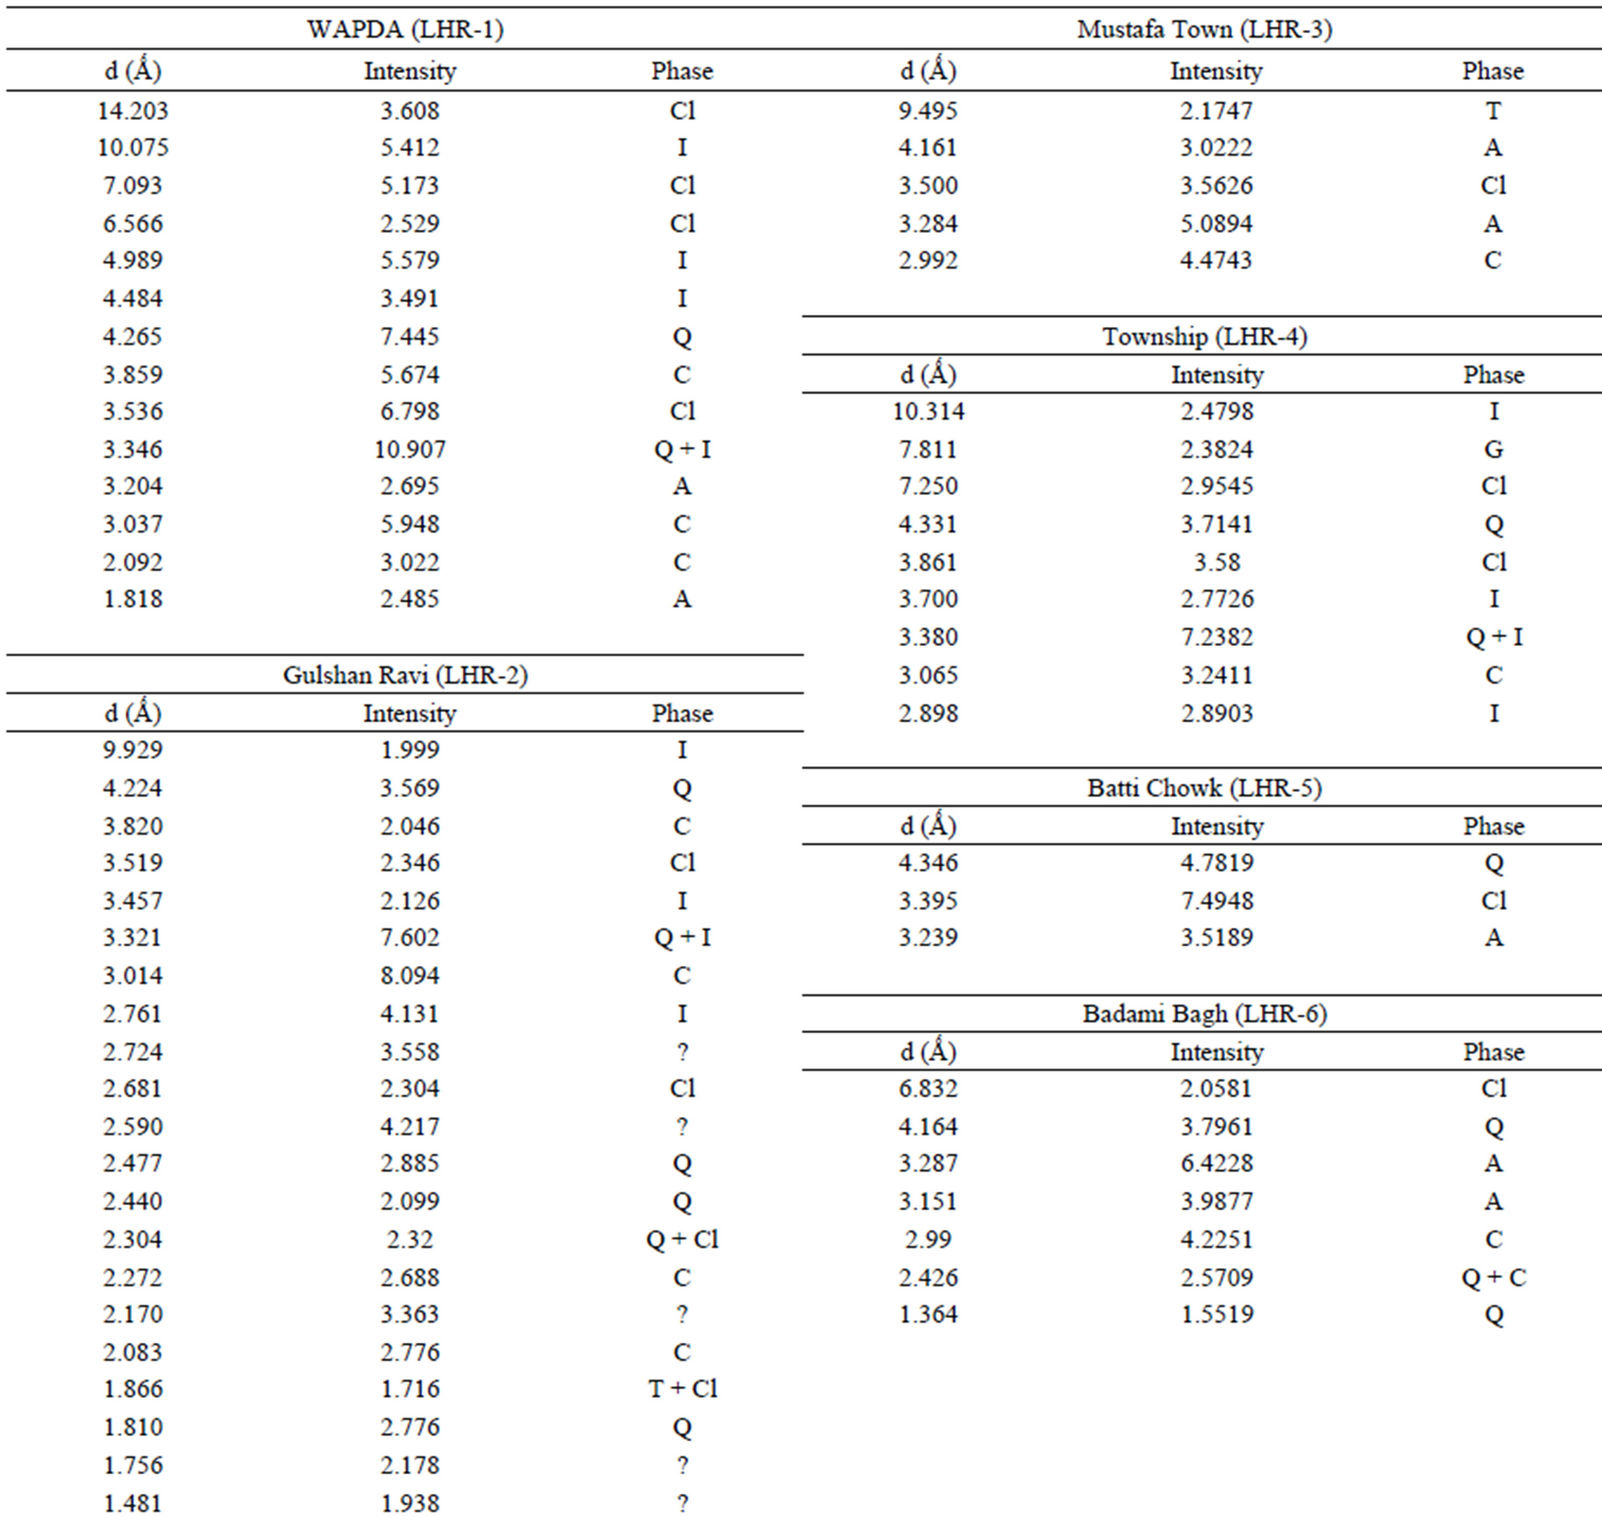
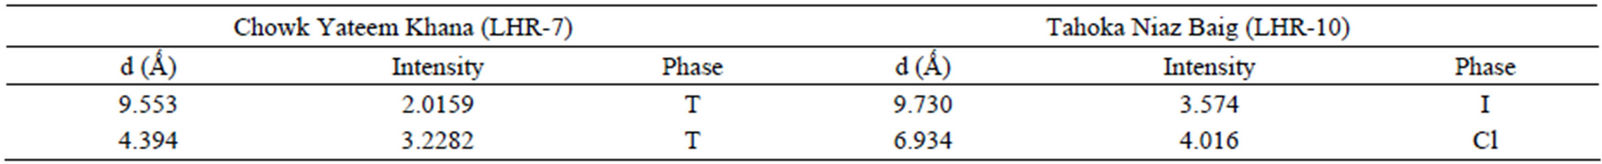
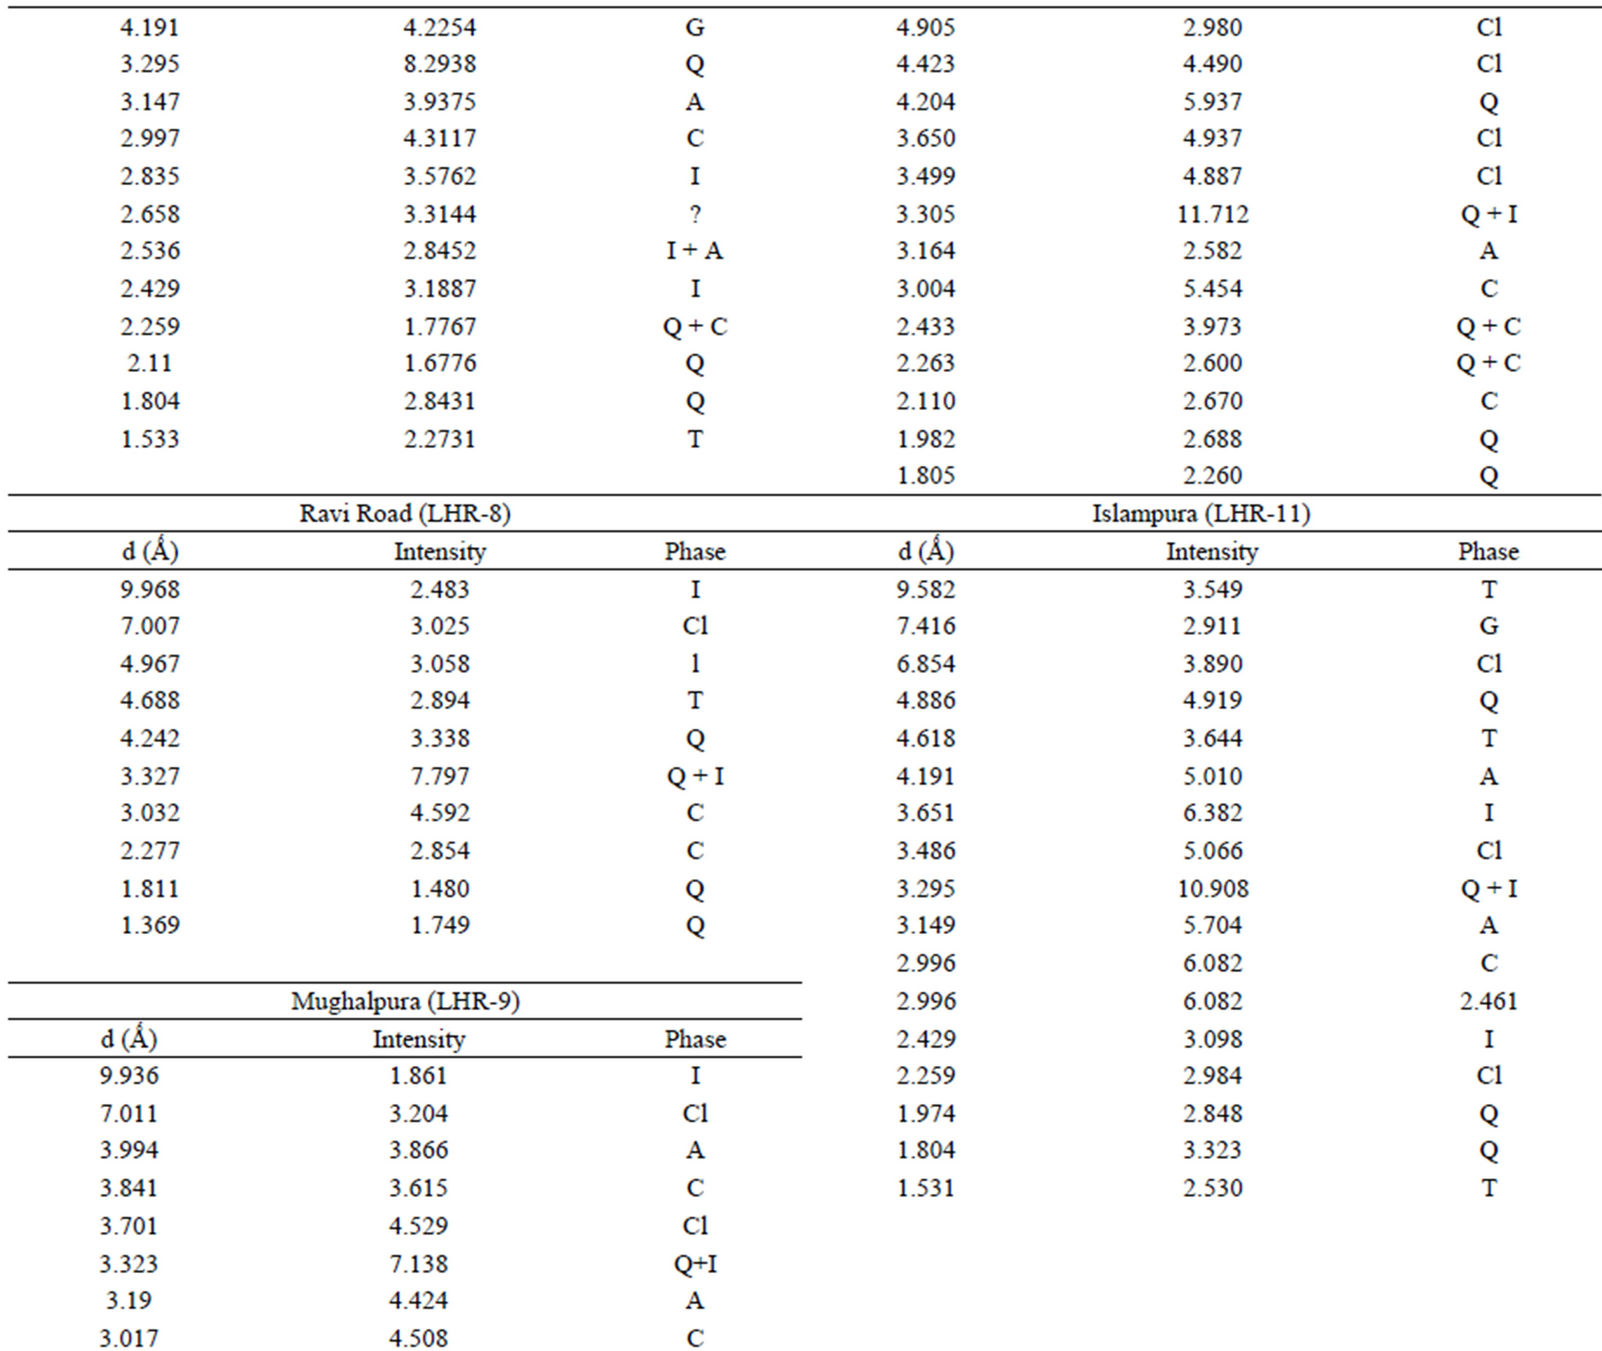
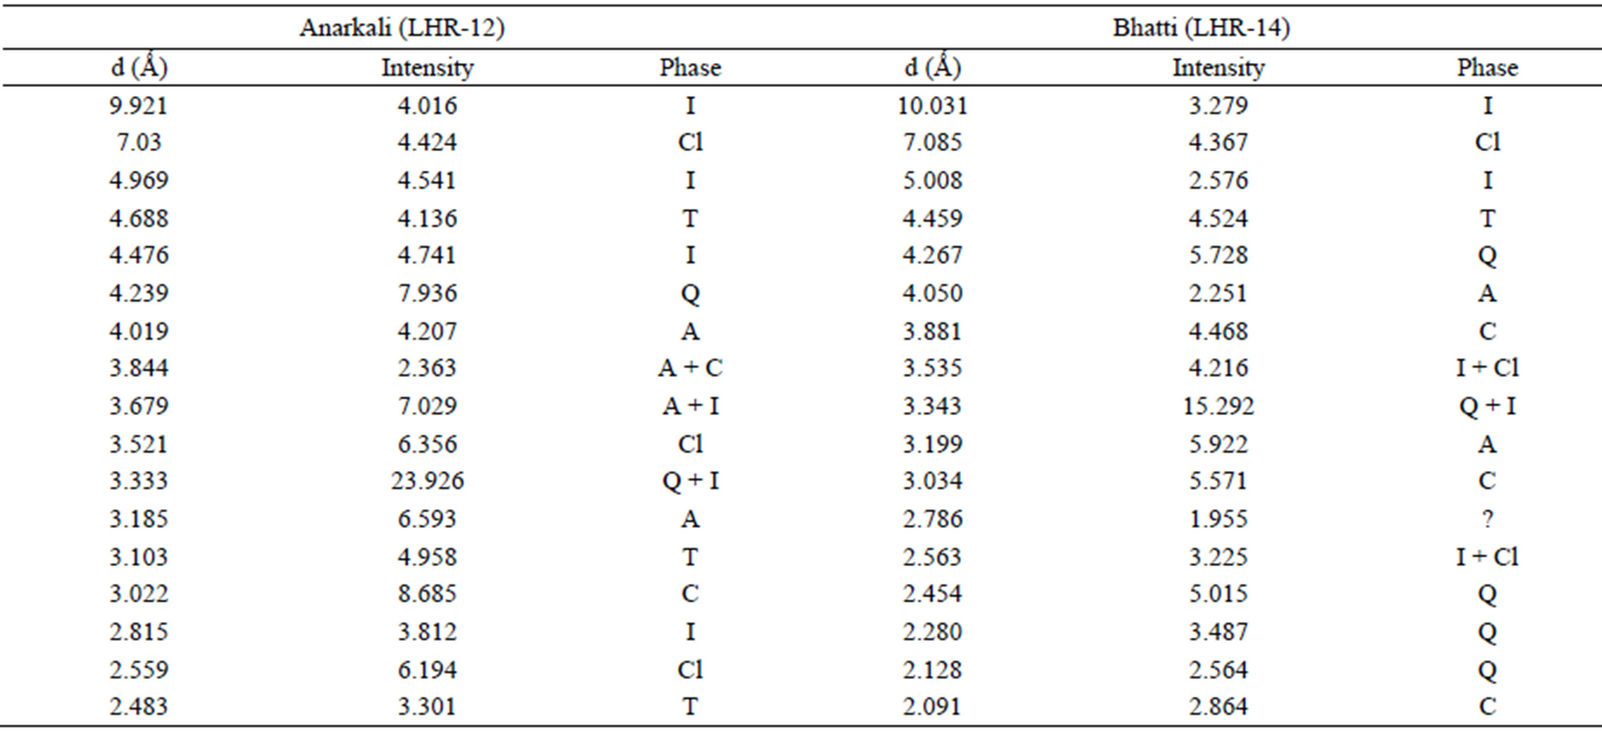
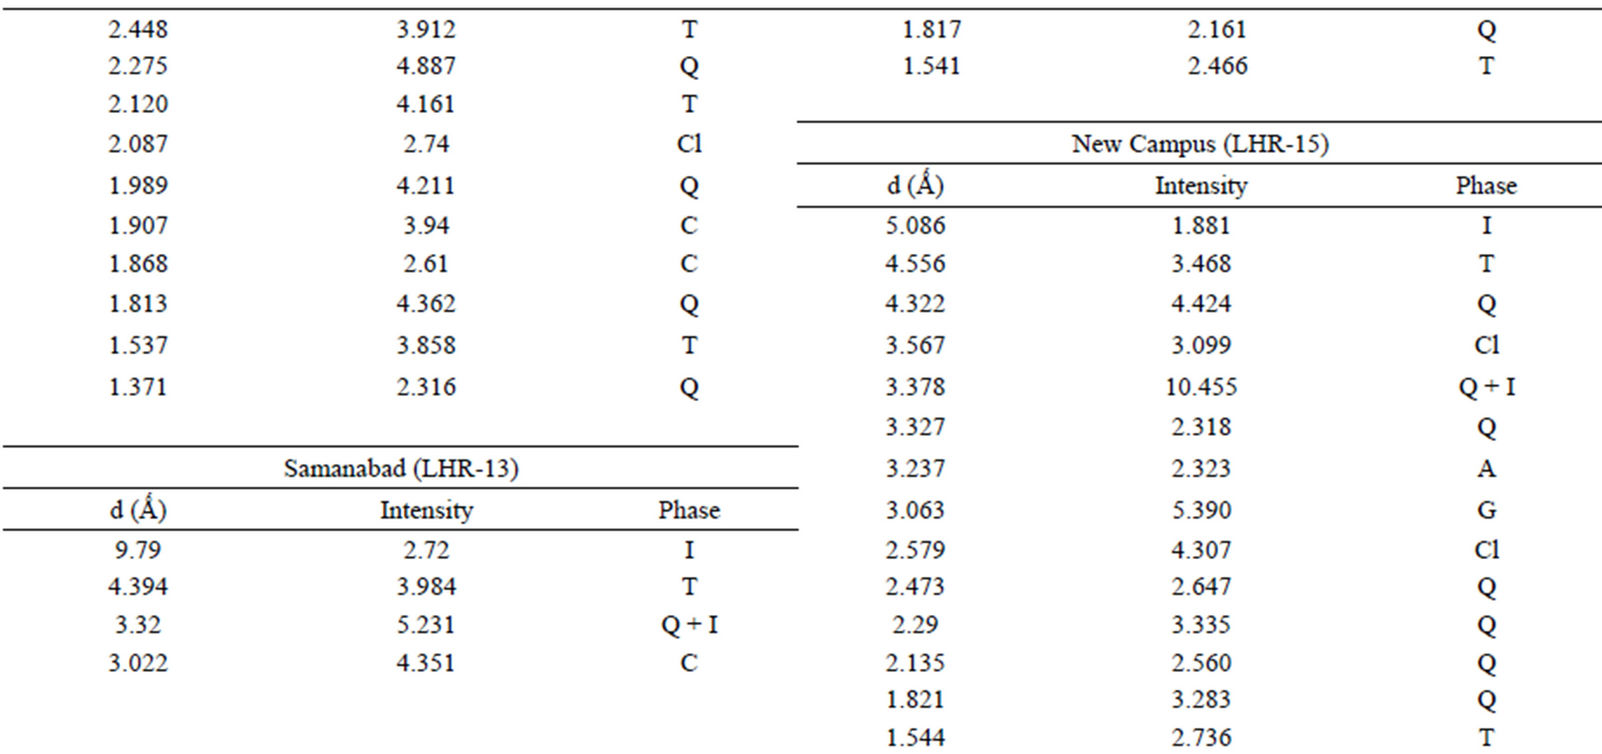
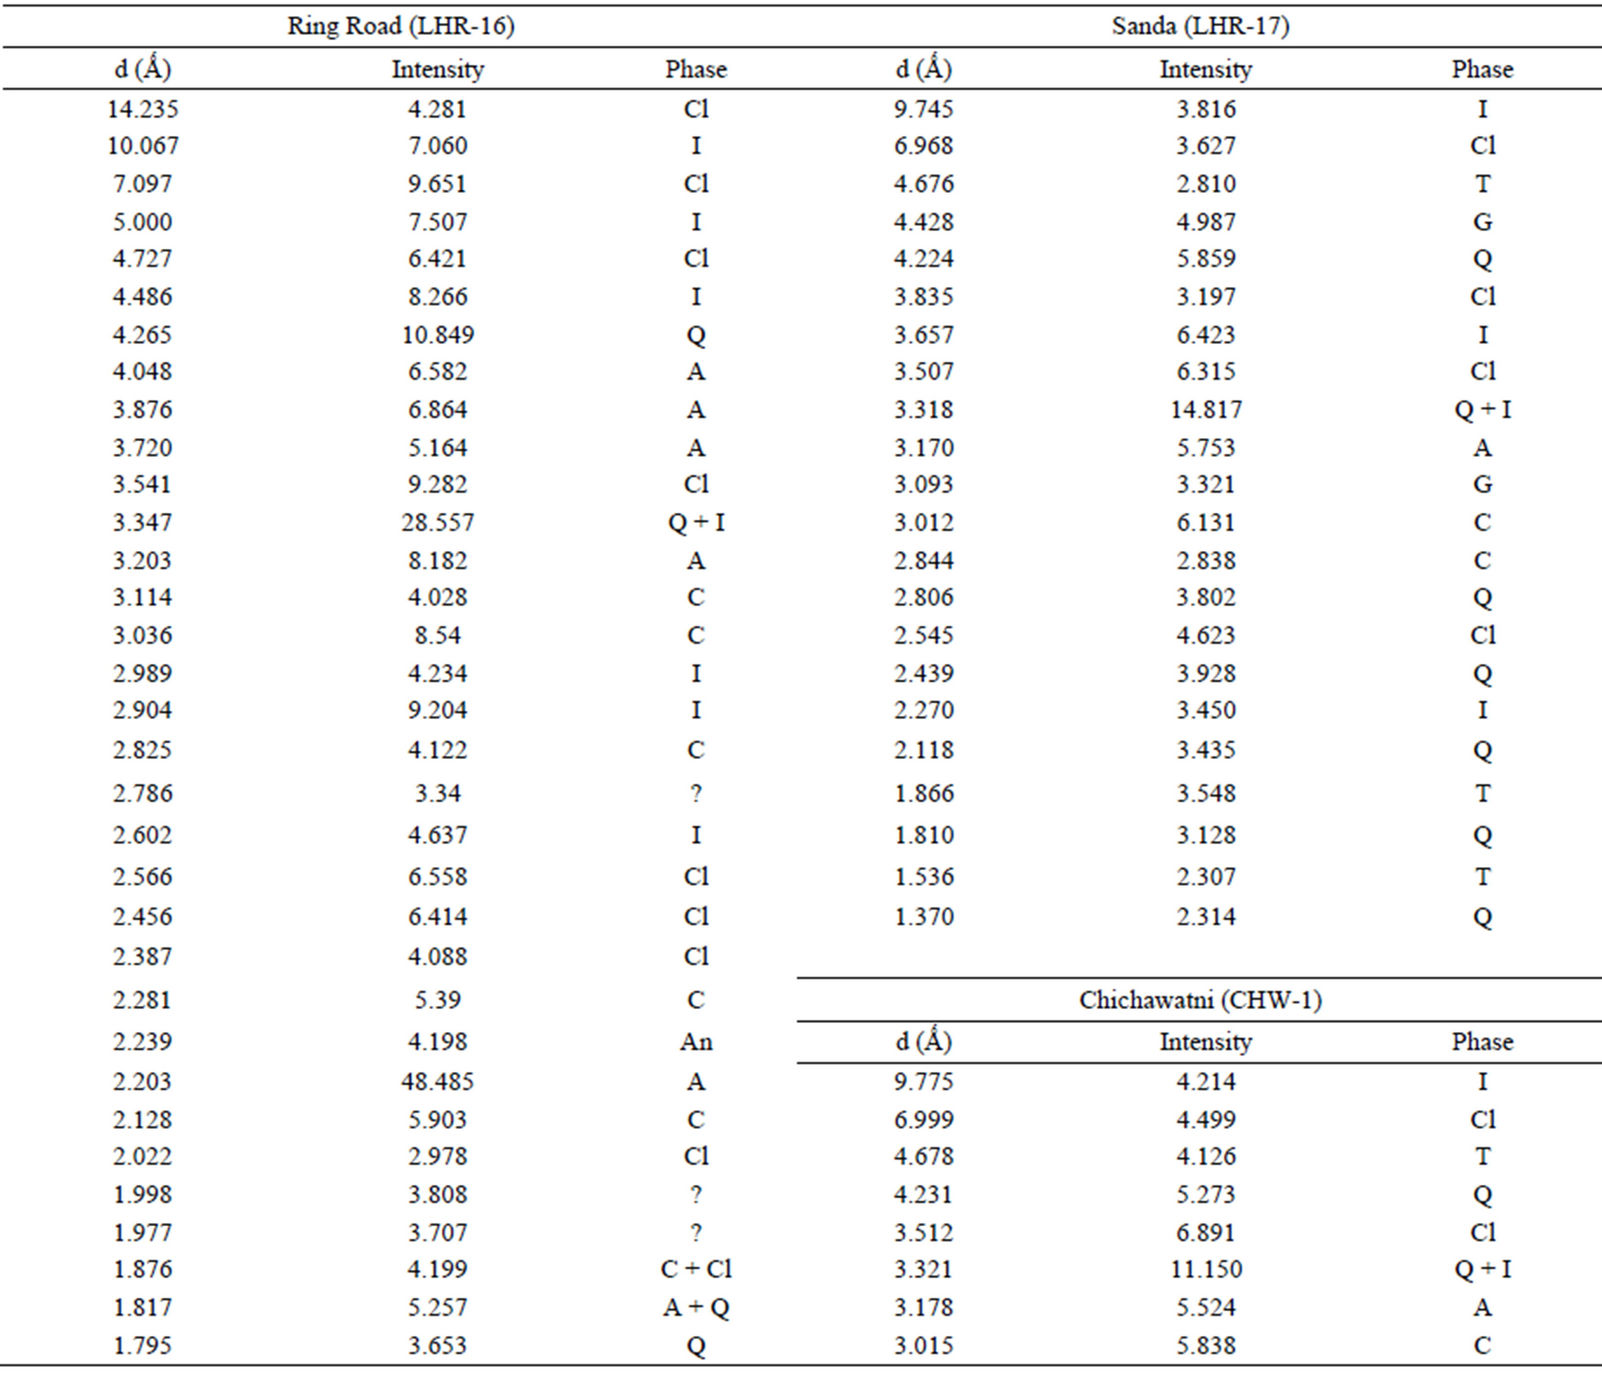
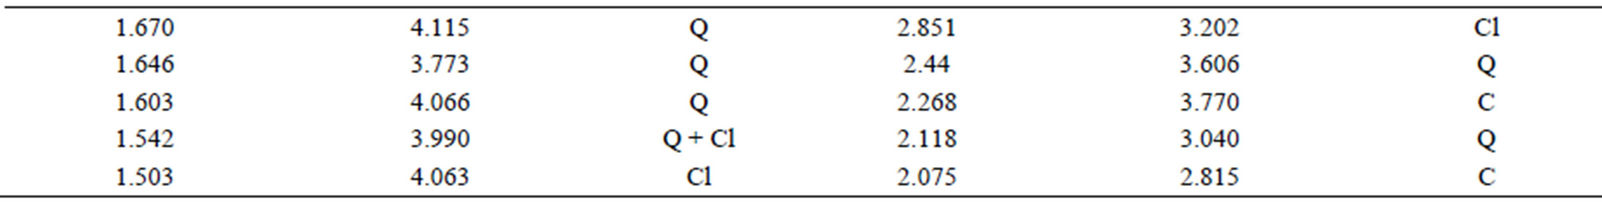
Table 5. XRD data of samples and the phases identified.Continued
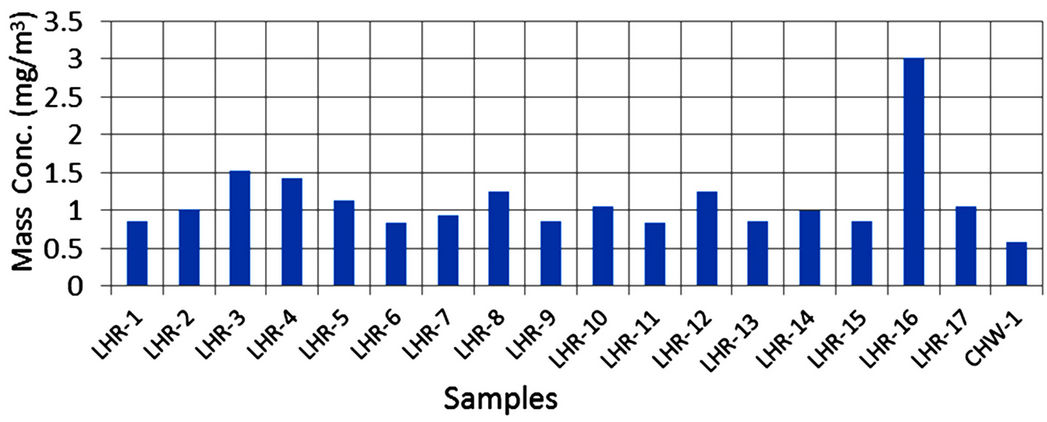
Figure 3. Mass concentrations of airborne samples.
 (a)
(a)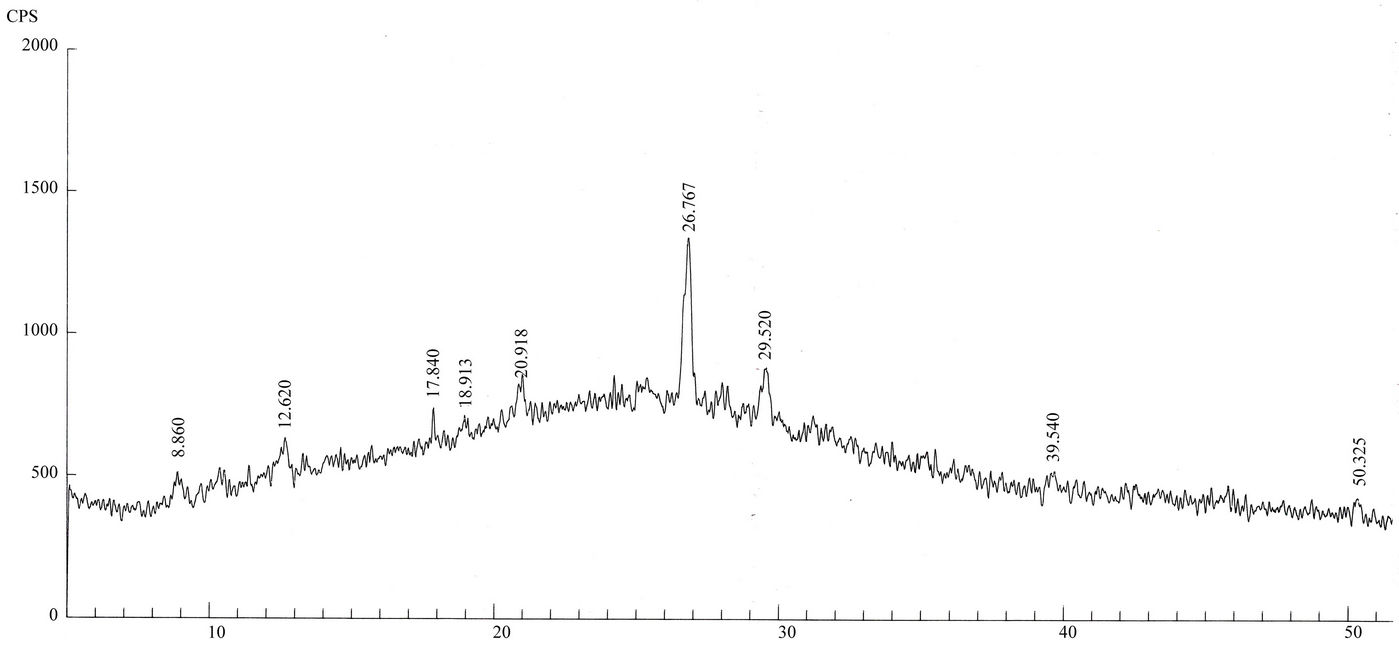 (b)
(b)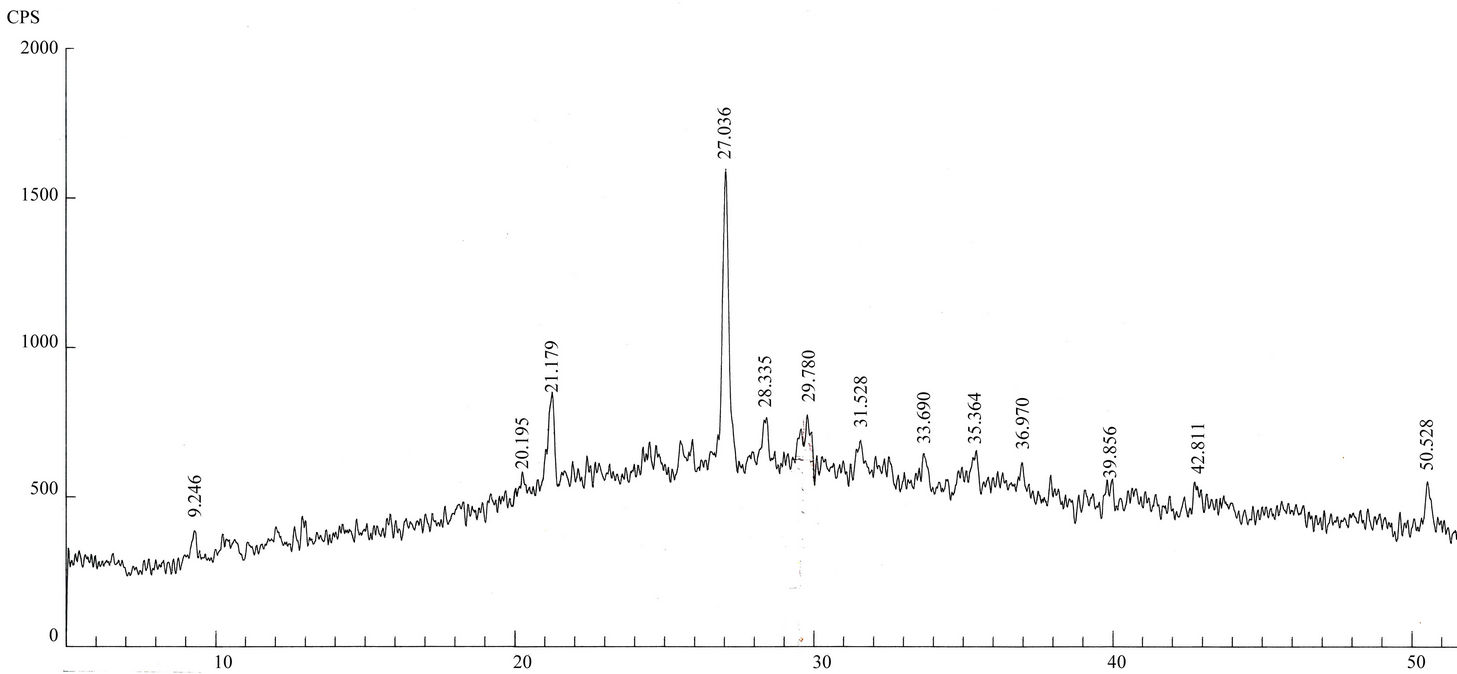 (c)
(c)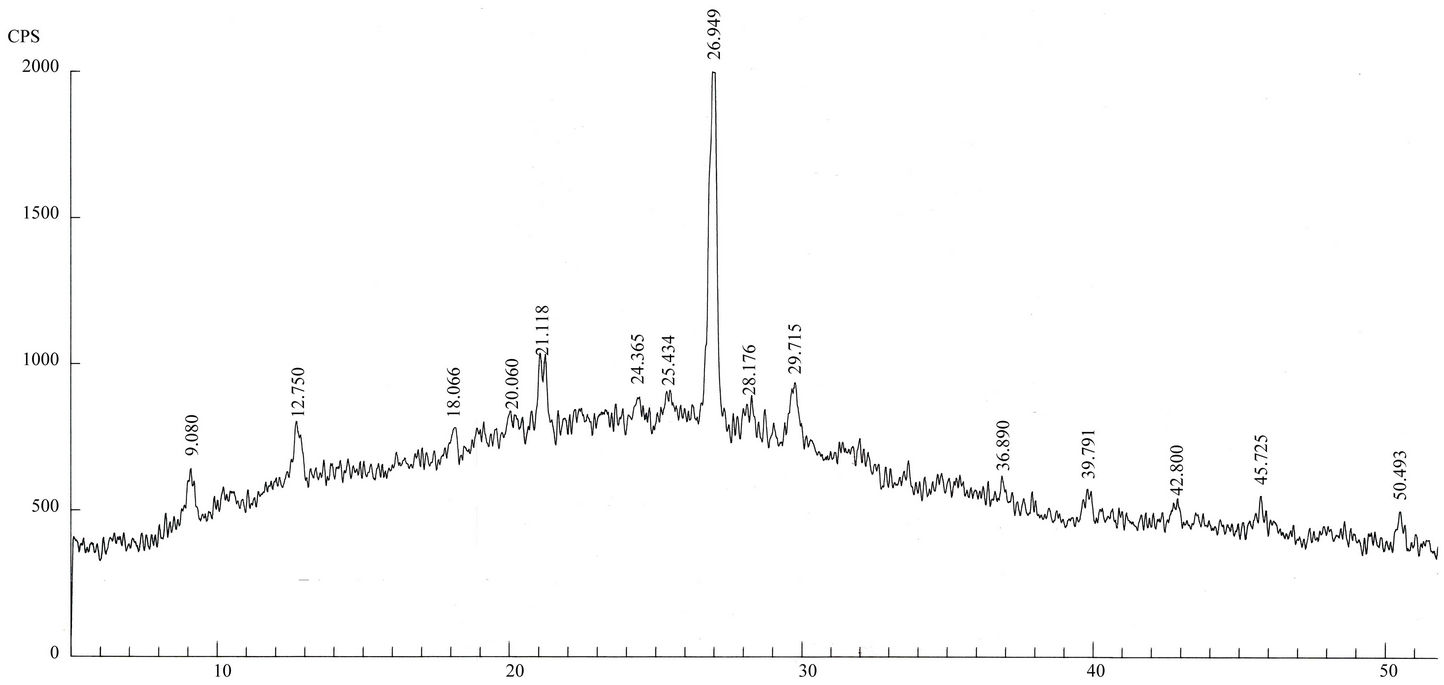 (d)
(d)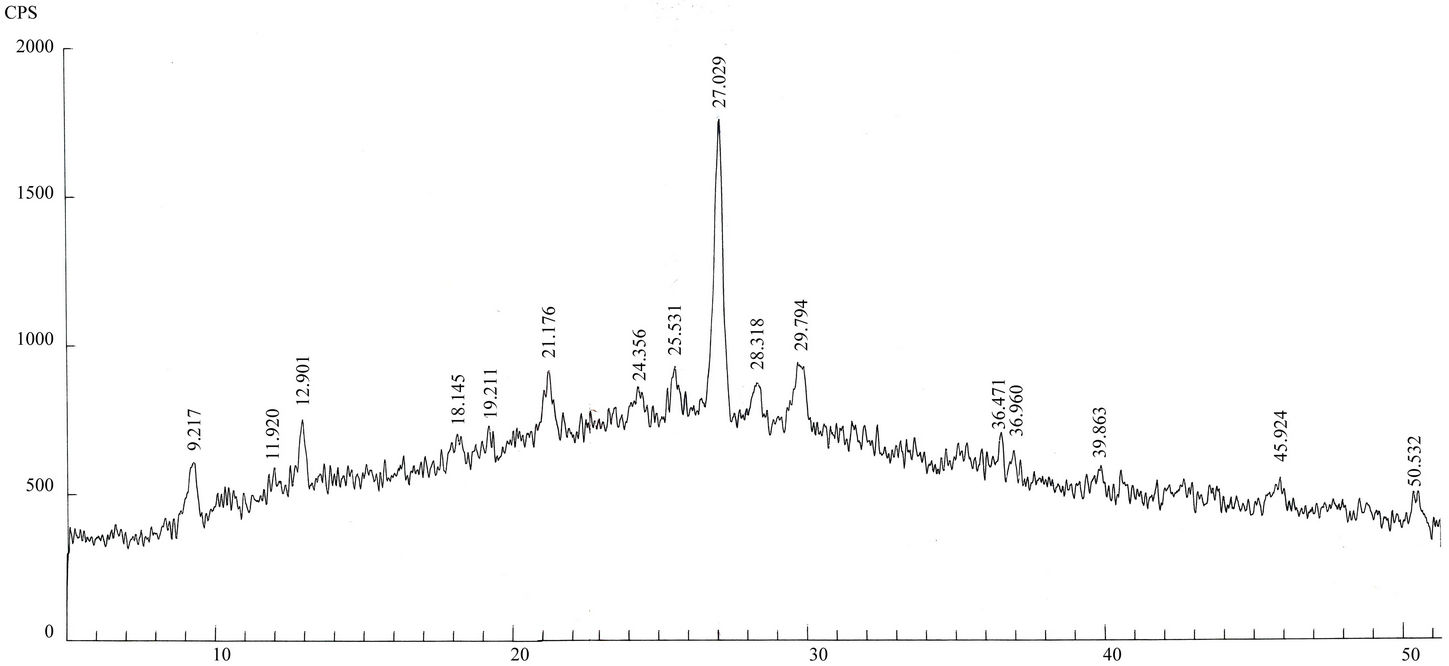 (e)
(e)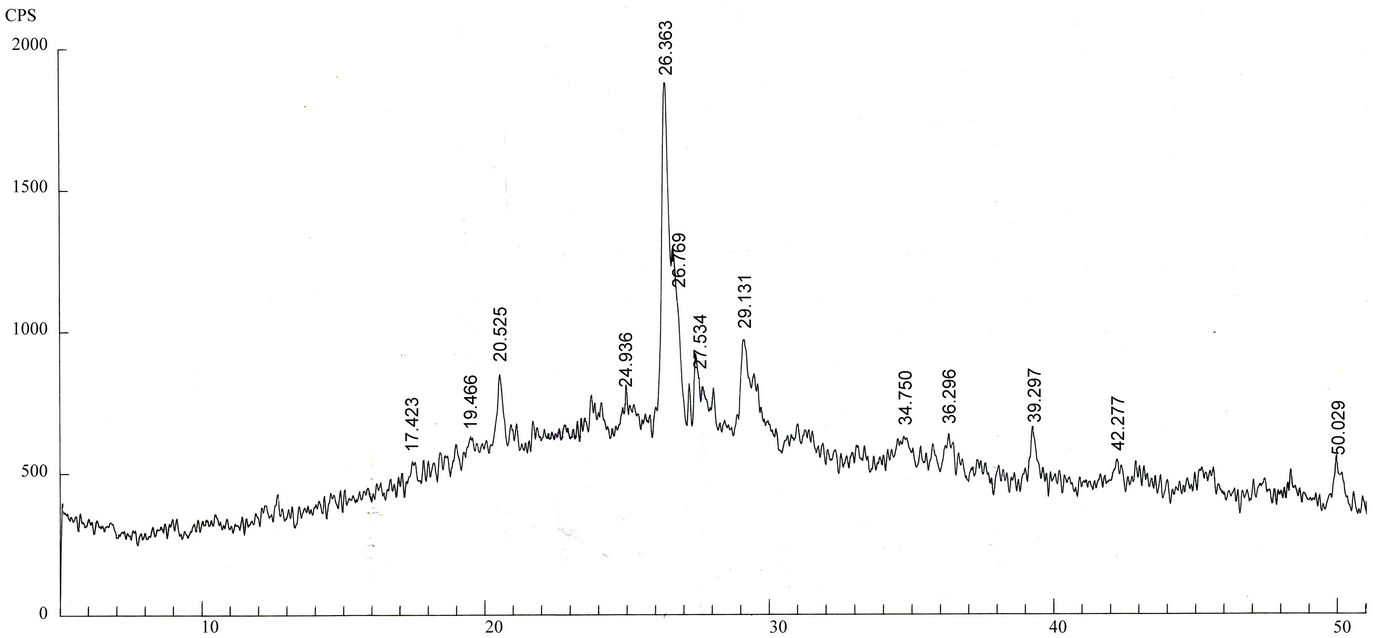 (f)
(f)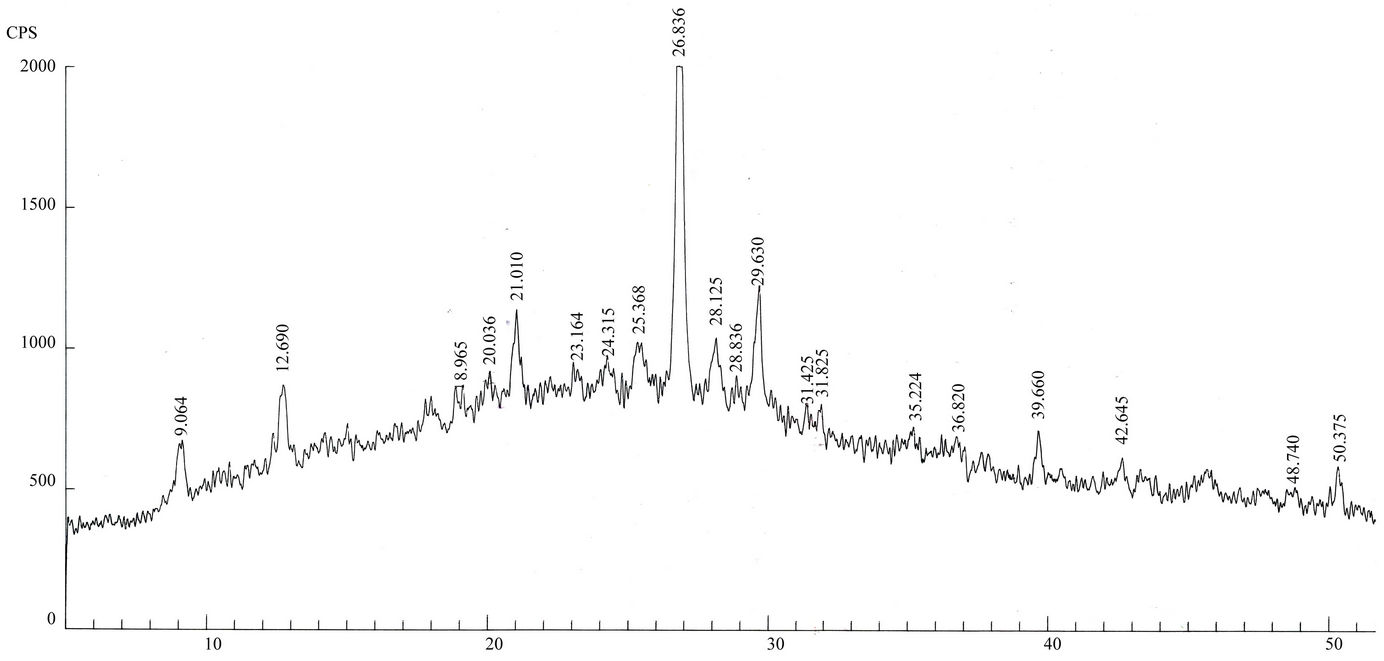 (g)
(g)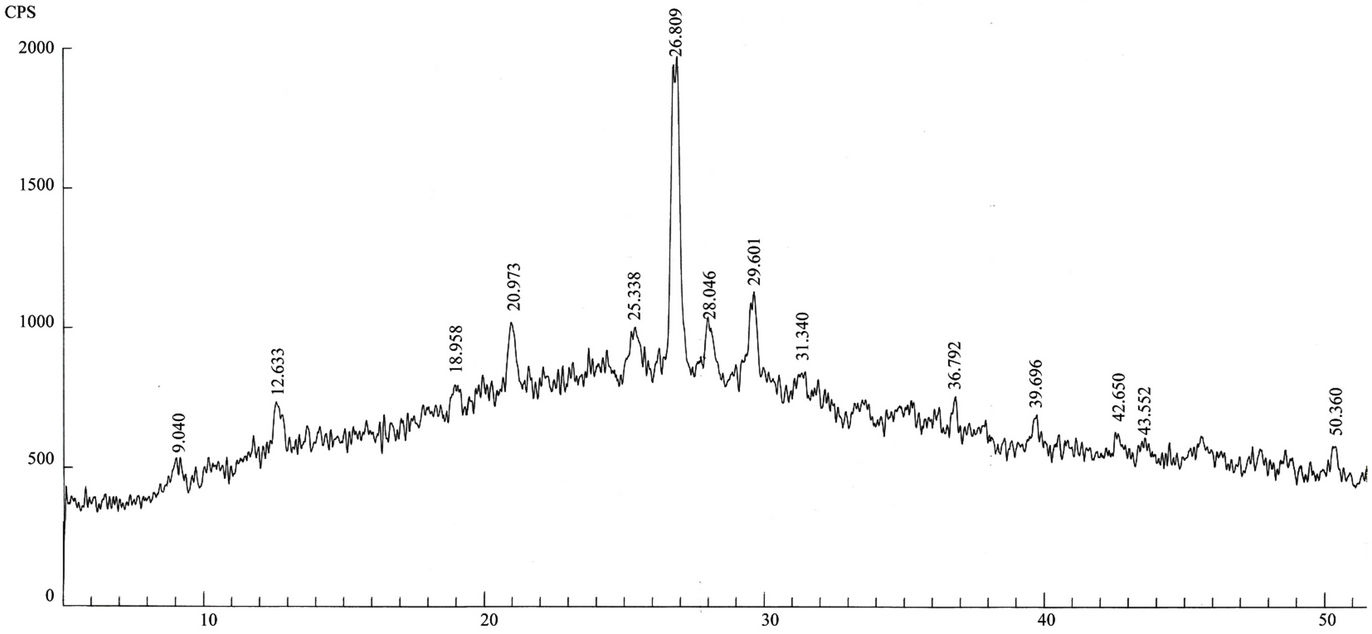 (h)
(h)
Figure 4. (a)-(h): XRD patterns of Lahore airborne samples (LHR-2, LHR-3, LHR-7, LHR-10, LHR-11, LHR-15, LHR-17, CHW-1).
showed presence of several other compounds/phases as compared to the present results. Presence of ammonium chloride and ammonium nitrate sulphate in aerosol samples collected in Japan was due to their likely formation in the air due to photosynthesis of fuel gases such as NOx and SO2 and Chlorine. Here in Lahore vehicular traffic has increased tremendously over the last decade but the compounds mentioned above were not indicated. It is possible that either these compounds did not grow via photosynthesis, possibly because conditions were not favorable for their formation or if they grew; their amount was below the detection limit of the diffractometer. In order to detect any anthropogenic constituents of the aerosols, Spark-source mass spectrometer was employed which is capable of detecting elements even in traces as low as ppb level. An aerosol sample collected from an industrial site in Lahore and another from Chichawatni were analyzed for complete elemental analysis and hence for assessing the anthropogenic sources of elements in the air. These results are described later in Section 3.3.
3.2. Quantitative Phase Analysis
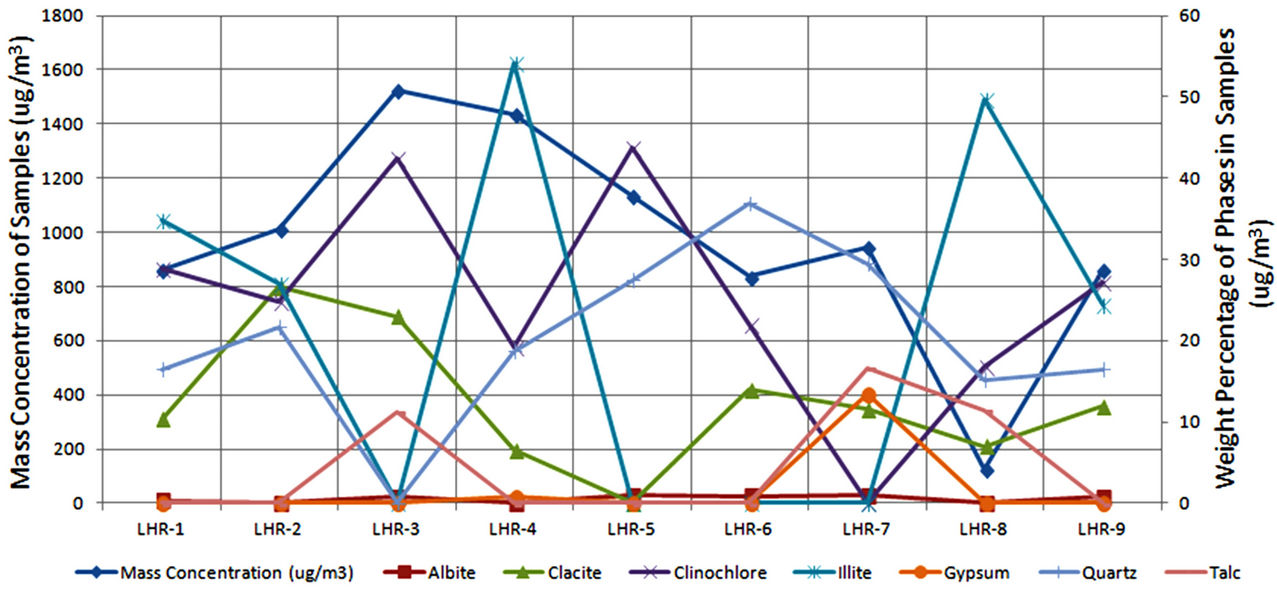
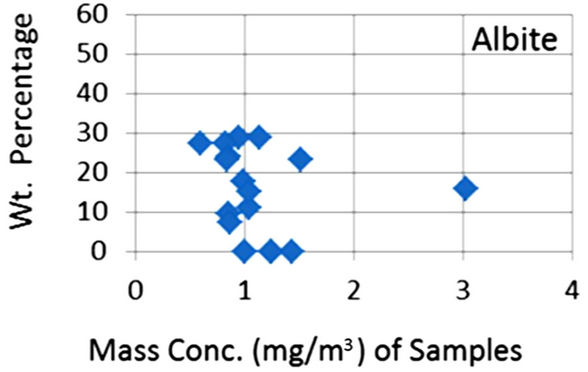
In order to quantify the major phases, namely, Albite, Calcite, Clinochlore (Cholrite), Illite, Gypsum, Quartz, and Talc in the samples, intensities of largest peaks of these phases and their RIR values (Figure 2) were used in Equation (4). Since largest peaks of Illite and Quartz overlap at d = 3.334 Å, the first characteristic peak of Quartz with d = 4.26 Å was used after its intensity normalized to the largest peak. It may have introduced some error in quantification of Quartz, but that effect can be ignored because the error in the quantification of phases by any quantitative analysis is not better than ±10%. The weight percentages of phases have been shown in Table 6 and plotted in Figures 5(a) and (b) together with mass concentrations of samples so as to explore their variation trends. Also weight percentages of phases are plotted against mass concentrations of samples in Figures 6(a)- (g), but no correlation is observed between them. The average weight percentages (and standard deviations) of Albite, Calcite, Clinochlore (Chlorite), Gypsum, Illite,
 (a)
(a)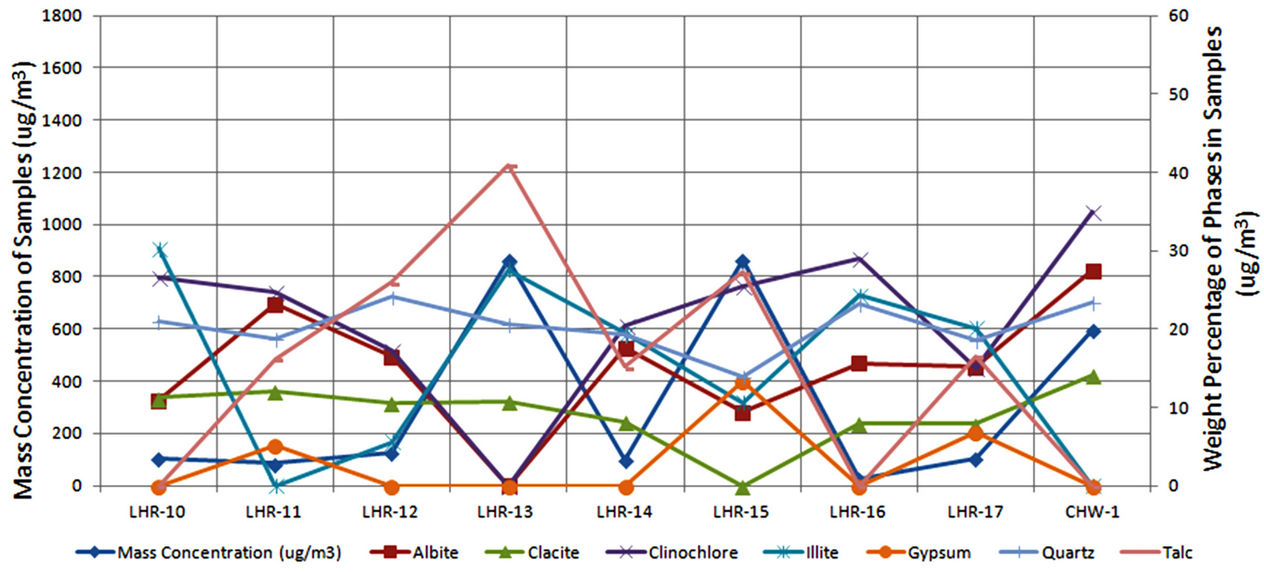 (b)
(b)
Figure 5. Mass concentrations of samples and weight percentages of identified phases.
 (a)
(a)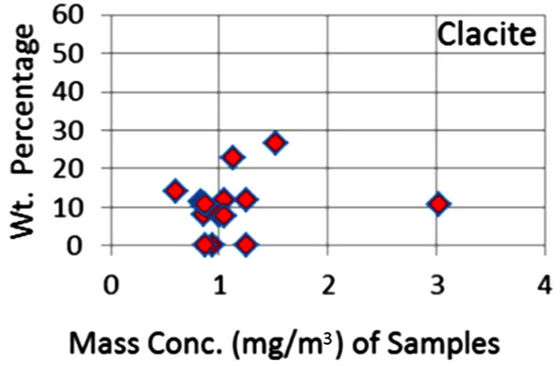 (b)
(b)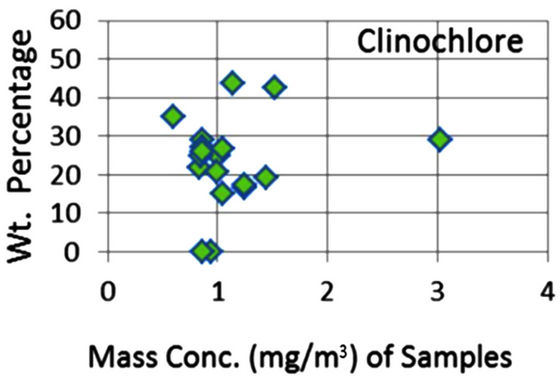 (c)
(c)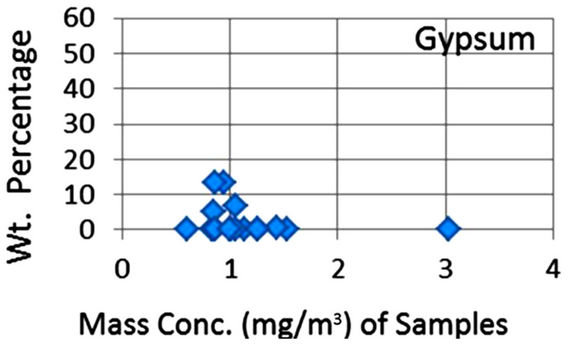 (d)
(d)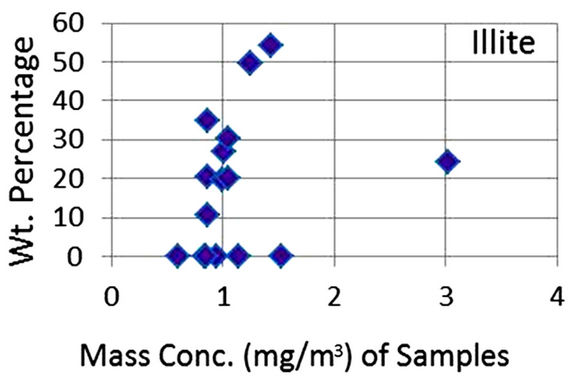 (e)
(e)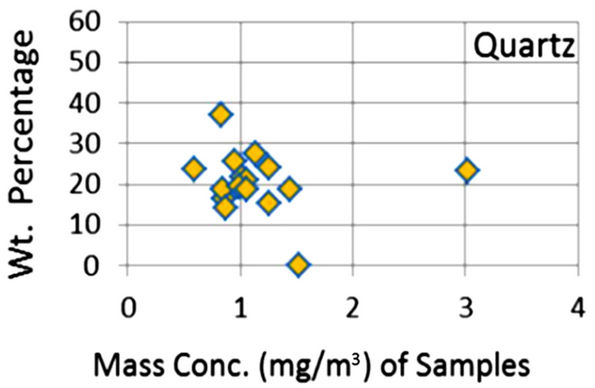 (f)
(f)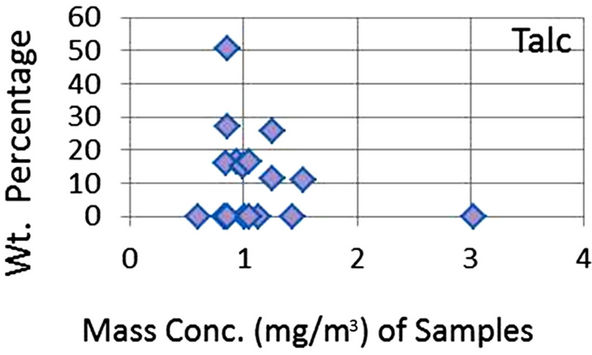 (g)
(g)
Figure 6. (a)-(g): Weight percentage of phases against mass concentration of airborne samples; Albite, Calcite, Clinochlore, Gypsum, Illite, Quartz, Talc.
Quartz and Talc are respectively 1542 ± 1120, 1075 ± 644, 2324 ± 1159, 1821 ± 1855, 220 ± 451, 2027 ± 730, and 1007 ± 1381 μg/m3, whereas the average mass concentration of the samples is 1134 ± 52 μg/m3. The weight percentages of a majority of phases, namely of Albite, Calcite, Cliochlore (Cholrite), Illite, and Quartz are around their average values. Most weight percentages of Gypsum and Talc are zero with a few exceptions. These minerals were not detected in the Lahore soils [2] and their sources are remote or due to crushing or grinding of marble rocks as house building materials in Lahore.
In this study only crystalline phases were quantized; the crystalline phases however grown in the air due to photosynthesis could not be detected by XRD because their concentration in the samples could be below the detection limit of the diffractometer. In order to determine the elements belonging to those anthropogenic phases, elemental analysis of two samples, one collected from industrial area in Lahore (Batti Chowk) and the other collected from Chichawatni was carried out by spark source mass spectrometry (SSMS). The presence of organic matter (carbonaceous) as indicated during analysis of the mass spectrometry was also indicated by the results of the chemical analysis of the SPM sample done by [2]. The results of elemental analysis of these samples are described in the following Section 3.3.
3.3. Complete Elemental Analysis
The major phases studied in this study are Albite, Calcite, Clionchlore (Chlorite), Gypsum, Illite, Quartz and Talc. There could be other minor phases, both natural and anthropogenic, present in the airborne samples. The review in Section 3.1 and the present results do indicate presence of anthropogenic compounds in the airborne samples. The elements present in Albite, Clinochlore (Chlorite), Gypsum, Quartz and in Talc are Al, C, Ca, Fe, H, Mg, O, Na, S and Si. If minor phases (minerals) belonging to the classes of Albite, Clinochlore (Chlorite), Gypsum, Quartz and in Talc are also present in the samples, B, Cd, Co, Li, Mn, Ti and Zn could also be detected. Table 7 shows mass concentration of Al, C, Ca, Fe, Mg, Na, S and Si belonging to the identified/quantized minerals and of B, Cd, Li, Mn, Ti and Zn belonging to the undetected minor phases. H and O were also quantized in both the samples but their mass concentration is not included in the elemental data given in the table. Be, Cl, Er, Hg, N, Pb, Ru, and Sb were also detected in the samples but their sources could not be identified, which may be either natural or anthropogenic or both natural and anthropogenic. Mass concentrations of the detected elements are plotted in Figure 7.
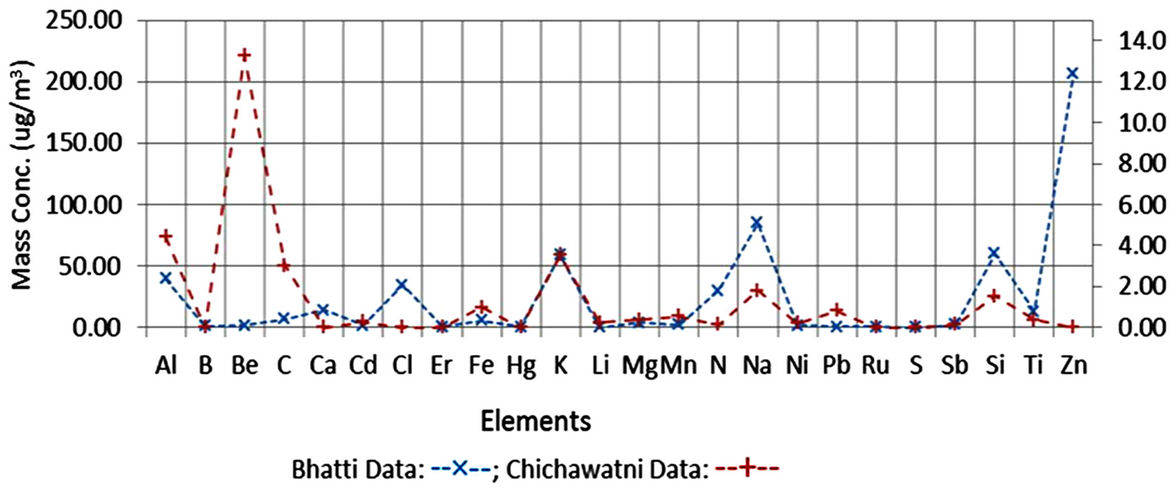
Figure 7. Mass concentration of elements in Bhatti and Chichwatni samples.
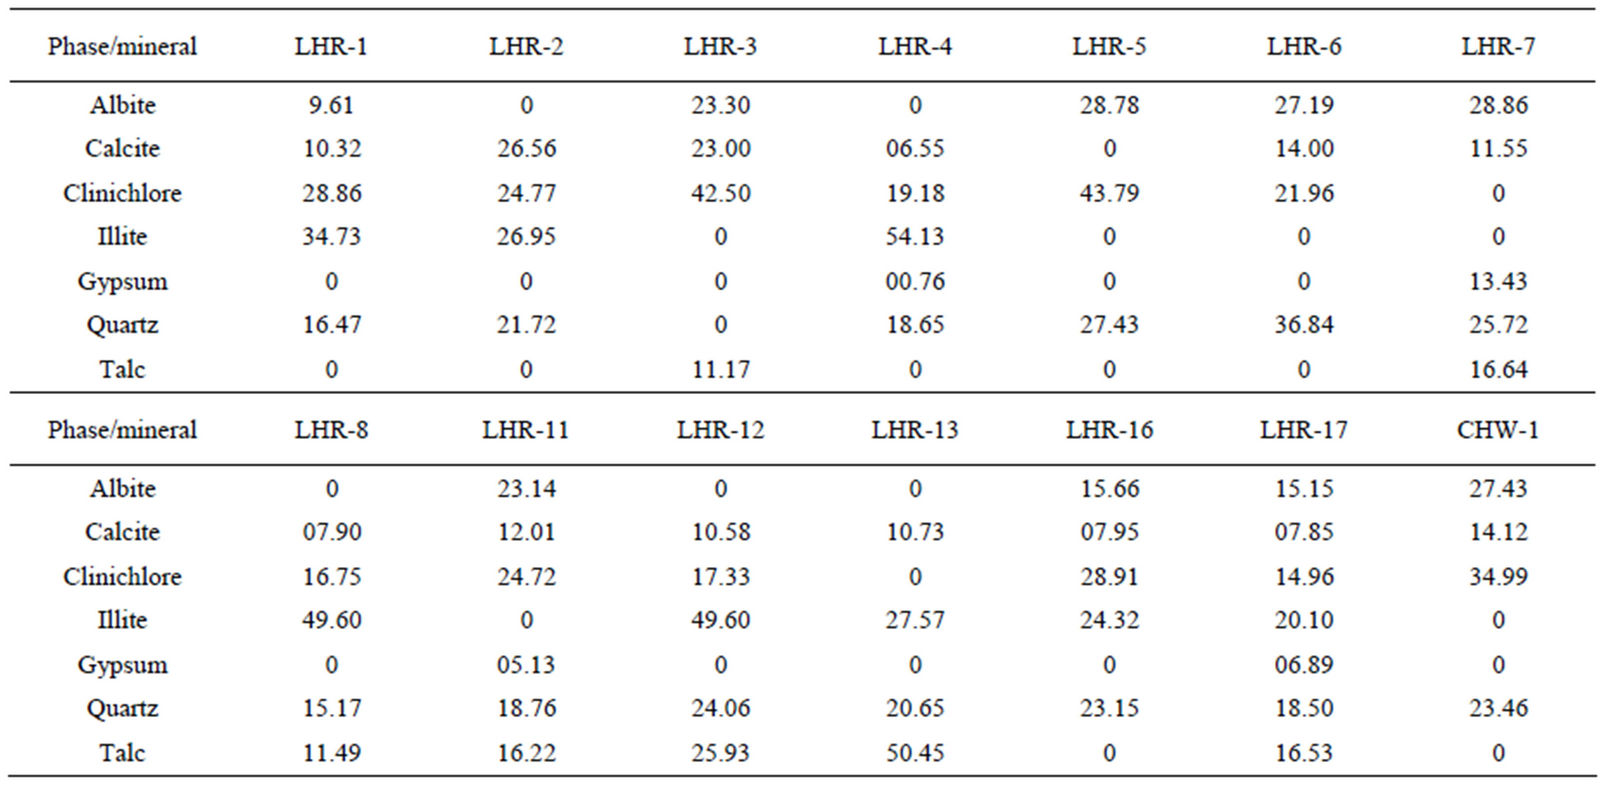
Table 6. Wt percentage of phases in samples.
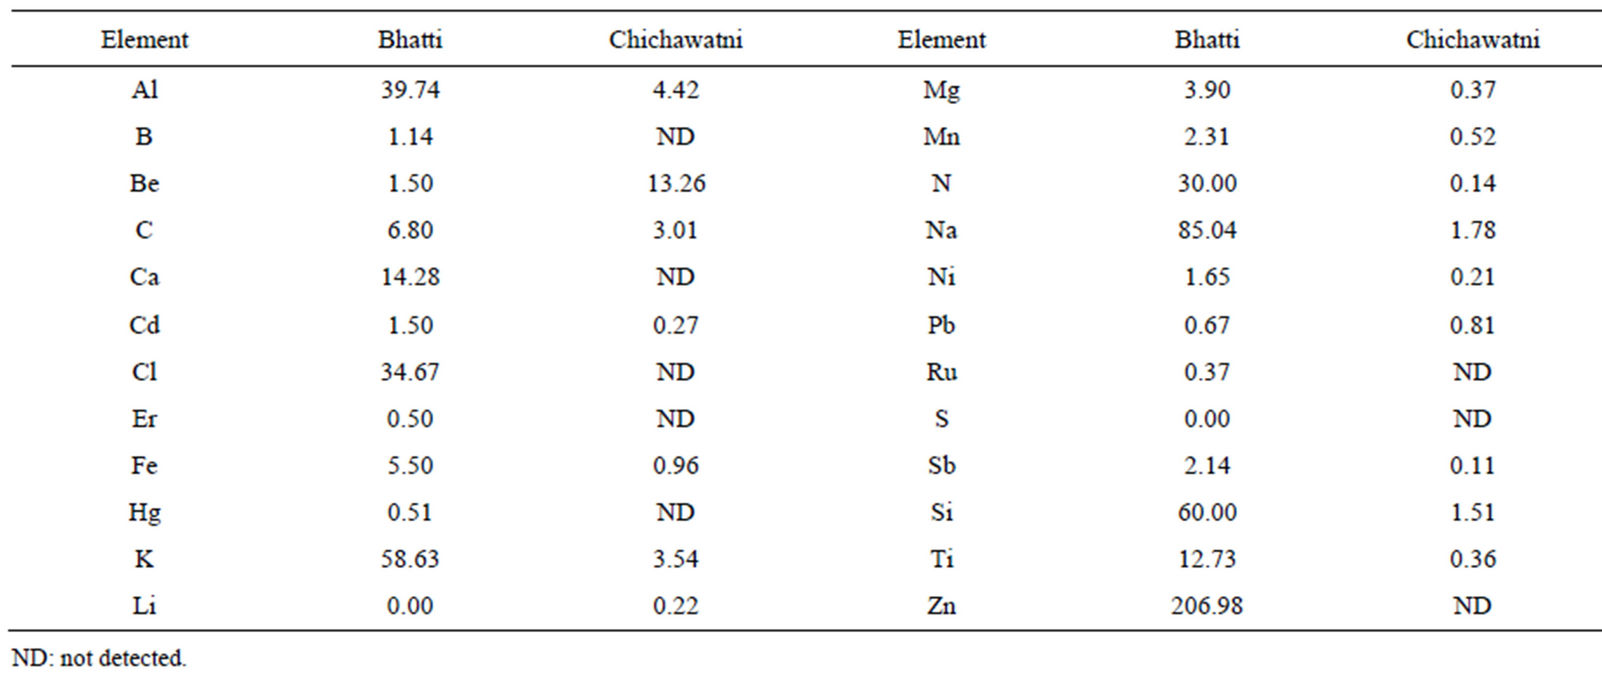
Table 7. Mass concentration of elements in Bhatti and Chichawatni samples (H and O not included).
4. Conclusions
Airborne samples were collected on GFC filters of diameter 47 mm and pore size 0.7 μm from Lahore and Chichawatni running a Low-Volume Sampler at a flow rate around 40 l/min and continuously around eight hours.
The phases identified in the Lahore aerosol samples are the soil minerals; these are Albite, Calcite, Clinochlore (Chlorite), Gypsum, Illite, Quartz and Talc. Gypsum and Talc were not identified in the Chichawatni aerosols. Theses phases were found in the Lahore aerosols respectively having average weight percentage of 15.5, 10.6, 23.7, 2.4, 19.1, 20.2, and 8.5. These results need not to be compared with results for other parts of the world, as the phases identified in aerosols collected in different parts of the world may have different phases and in different proportions. No phases of anthropogenic origin or grown in the air via photosynthesis were identified by the X-ray diffraction technique. The obvious reason is that the amount of such phases in the collected aerosol samples could be below the detection limit of the diffractometer.
The present study shows the presence of Gypsum and Talc due to crushing of marble rocks for use as building materials. Similar evidence has already been reported [2, 33].
The elements detected and quantified in the two samples (Bhatti and Chichawatni) show the presence on elements natural origin and anthropogenic/natural origins. The natural elements such as Al, B, C, Ca, Cd, Fe, K, Li, Mg, Mn, Na, Ni, and Si are respectively about 49% and 53% whereas the anthropogenic/natural elements such as Be, Cl, Er, Hg, N, Pb, Ru, Sb, Ti and Zn are respectively 53% and 47% in Bhatti and Chichawatni samples. The sources of anthropogenic elements, particularly in the Bhatti (Lahore) sample could be fly ashes and small industrial units located in the area and in the Chichawatni sample due to fly ashes.
5. Acknowledgements
NA and KH are grateful to Prof. Dr. Nasir Ahmad, Director, Institute of Geology, and University of the Punjab, Lahore for useful discussions and for lending LowVolume Sampler to collect airborne samples.
REFERENCES
- P. Roberts and J. Hallett, “A Laboratory Study of the Ice Nucleating Properties of Some Mineral Particulates,” Quarterly Journal of the Royal Meteorological Society, Vol. 94, No. 399, 1968, pp. 25-34. doi:10.1002/qj.49709439904
- K. Hussain, R. Riffat, A. Shaukat and M. A. Siddiqui, “A Study of Suspended Particulate Matter in Lahore (Pakistan),” Advances in Atmospheric Science, Vol. 7, No. 2, 1990, pp. 178-185. doi:10.1007/BF02919155
- B. L. Davis and N. K. Cho, “Theory and Application of X-Ray Diffraction Compound Analysis to Hi-Volume Filter Samples,” Atmospheric Environment, Vol. 11, No. 1, 1977, pp. 73-85. doi:10.1016/0004-6981(77)90209-8
- P. D. E. Biggins and R. M. Harrison, “Atmospheric Chemistry of Automotive Lead,” Environmental Science and Technology, Vol. 13, No. 5, 1979, pp. 558-565. doi:10.1021/es60153a017
- P. D. E. Biggins and R. M. Harrison, “Characterization and Classification of Atmospheric Sulfates,” Journal of Air Pollution Control Association, Vol. 29, No. 8, 1979, pp. 838-840. doi:10.1080/00022470.1979.10470871
- R. L. Foster and P. F. Lott, “X-Ray Diffractometry Examination or Air Filters for Compounds Emitted by Leads Melting Operations,” Environmental Science and Technology, Vol. 14, No. 10, 1980, pp. 1240-1244. doi:10.1021/es60170a009
- B. H. O’Connor and J. M. Jaklevic, “Characterization of Ambient Aerosol Particulate Samples from the St. Louisaera by X-Ray Powder Diffractometry,” Atmospheric Environment, Vol. 15, No. 9, 1981, pp. 1681-1690. doi:10.1016/0004-6981(81)90154-2
- T. Fukasawa, M. Iwasuki and S. P. Tillekeratne, “X-Ray Diffraction Analysis or Airborne Particulates Collected by an Andersen Sampler. Compound Distribution vs. Particle Size,” Environmental Science and Technology, Vol. 17, No. 10, 1983, pp. 596-602. doi:10.1021/es00116a007
- B. Tani, S. Siegel, S. A. Johnson and R. Kumar, “X-Ray Diffraction Investigation of Atmospheric Aerosols in the 0.3 - 1.0 µm Aerodynamic Size Range,” Atmospheric Environment, Vol. 17, No. 11, 1983, pp. 2277-2283. doi:10.1016/0004-6981(83)90226-3
- R. M. Harrison and W. T. Sturges, “Physico-Chemical Speciation and Transformation Reactions of Particulate Atmospheric Nitrogen and Sulphur Compounds,” Atmospheric Environment, Vol. 18, No. 9, 1984, pp. 1829-1833. doi:10.1016/0004-6981(84)90358-5
- M. Iwatsuki, S. P. Tillekeratne and T. Fukasawa, “X-Ray Analysis of Airborne Particulates Collected by an Andersen Sampler, Compound and Elemental Distributions vs Particle Size of Laboratory Particulates,” Environmental Science and Technology, Vol. 18, No. 11, 1984, pp. 818- 822. doi:10.1021/es00129a003
- G. Clarke and G. N. Karani, “Characterizations of the Carbonate Content of Atmospheric Aerosols,” Journal of Atmospheric Chemistry, Vol. 14, No. 1-4, 1992, pp. 119- 128. doi:10.1007/BF00115228
- V. Esteve, A. Justo and J. M. Amigó, “X-Ray Diffraction Analysis of Airborne Particulates Collected by a Cascade Impactor Sampler Phases Distribution versus Particle Size,” Materials Science Forum, Vol. 166-169, 1994, pp. 705-710. doi:10.4028/www.scientific.net/MSF.166-169.705
- S. L. Lu, Q. X. Luan, Z. Jiao, M. H. Wu, Z. Li, L. Y. Shao and F. S. Wang, “Mineralogy of Inhalable Particulate Matter (pm10) in the Atmosphere of Beijing, China,” Water, Air & Soil Pollution, Vol. 186, No. 1-4, 2007, pp. 129-137. doi:10.1007/s11270-007-9470-5
- F. H. Chung, “Quantitative Interpretation of X-Ray Diffraction Patterns of Mixtures I. Matrix-Flushing Method for Quantitative Multicomponent Analysis,” Journal of Applied Crystallography, Vol. 7, 1974, pp. 519-525. doi:10.1107/S0021889874010375
- F. H. Chung, “Quantitative Interpretation of X-Ray Diffraction Patterns of Mixtures II. Adiabatic Principle of X-Ray Diffraction Analysis of Mixtures,” Journal of Applied Crystallography Vol. 7, 1974, pp. 526-531. doi:10.1107/S0021889874010387
- F. H. Chung, “Quantitative Interpretation of X-Ray Diffraction Patterns of Mixtures III. Simultaneous Determination of a Set of Reference Intensities,” Journal of Applied Crystallography, Vol. 8, 1975, pp. 17-19. doi:10.1107/S0021889875009454
- P. O. Warner, L. Saad and J. O. Jackson, “Identification and Quantitative Analysis of Particulate Air Contaminants by X-Ray Diffraction Spectrometry,” Journal of Air Pollution Control Association, Vol. 22, No. 11, 1972, pp. 887-890. doi:10.1080/00022470.1972.10469727
- B. L. Davis, “Additional Suggestions for X-Ray Quantitative Analysis of High-Volume Filter Samples,” Atmospheric Environment, Vol. 12, No. 12, 1978, pp. 2403- 2406. doi:10.1016/0004-6981(78)90283-4
- B. L. Davis, “Standardless X-Ray Diffraction Quantitative Analysis,” Atmospheric Environment, Vol. 14, No. 2, 1980, pp. 217-220. doi:10.1016/0004-6981(80)90280-2
- B. L. Davis, “A Study of the Errors in X-Ray Quantitative Analysis Procedures for Aerosols Collected on Filter Media,” Atmospheric Environment, Vol. 15, No. 3, 1981, pp. 291-296. doi:10.1016/0004-6981(81)90030-5
- B. L. Davis and L. R. Johnson, “On the Use of Various Filter Substrates for Quantitative Particulate Analysis of X-Ray Diffraction,” Atmospheric Environment, Vol. 16, No. 2, 1982, pp. 273-282. doi:10.1016/0004-6981(82)90443-7
- B. L. Davis, “X-Ray Diffraction Analysis and Source Apportionment of Denver Aerosol,” Atmospheric Environment, Vol. 18, No. 10, 1984, pp. 2197-2208. doi:10.1016/0004-6981(84)90207-5
- B. L. Davis and D. K. Smith, “Tables of Experimental Reference Intensity Ratios,” Powder Diffraction, Vol. 3, No. 4, 1988, pp. 205-208. doi:10.1017/S088571560001349X
- J. Rius, F. Plana and A. Palanques, “A Standardless XRay Diffraction Method for the Quantitative Analysis of Multiphase Mixtures,” Journal of Applied Crystallography, Vol. 20, 1987, pp. 457-460. doi:10.1107/S0021889887086217
- T. Nakamura, “Quantitative Determination by X-Ray Diffractometry of Calcium Sulfate and Calcium Carbonate in Airborne Dusts,” Powder Diffraction, Vol. 3, No. 2, 1988, pp. 86-90. doi:10.1017/S0885715600013294
- B. L. Davis, “Semi-Quantitative X-Ray Diffraction Analysis of Size Fractionated Atmospheric Particles,” Atmospheric Environment, Vol. 23, No. 10, 1989, pp. 2329- 2332. doi:10.1016/0004-6981(89)90196-0
- B. L. Davis, D. K. Smith and M. A. Holomany, “Tables of Experimental Reference Intensity Ratios Table no. 2,” Powder Diffraction, Vol. 4, 1989, pp. 201-205. doi:10.1017/S0885715600013725
- W. T. Sturges, R. M. Harrison and L. A. Barrie, “SemiQuantitative X-Ray Diffraction Analysis of Size Fractionated Atmospheric Particles,” Atmospheric Environment, Vol. 23, No. 5, 1989, pp. 1083-1098. doi:10.1016/0004-6981(89)90309-0
- B. L. Davis and M. N. Spilde, “Quantitative X-Ray Powder Diffraction Analysis Applied to Transmission Diffraction,” Journal of Applied Crystallography, Vol. 23, 1990, pp. 315-320. doi:10.1107/S0021889890003879
- B. L. Davis, R. Kath and M. Spilde, “The Reference Intensity Ratio: Its Measurement and Significance,” Powder Diffraction, Vol. 5, No. 2, 1990, pp. 76-78. doi:10.1017/S0885715600015372
- D. L. Bish and J. E. Post, “Quantitative Mineralogical Analysis Using the Rietveld Full-Pattern Fitting Method,” American Mineralogist, Vol. 78, 1993, pp. 932-940.
- V. Esteve, J. Rius, L. E. Ochando and J. M. Amigo, “Quantitative X-Ray Diffraction Phase Analysis of Coarse Airborne Particulate Collected by Cascade Impactor Sampling,” Atmospheric Environment, Vol. 31, No. 23, 1997, pp. 3963-3967. doi:10.1016/S1352-2310(97)00257-4
- B. D. Cullity, “Elements of X-Ray Diffraction,” AddisonWesley, London, 1978.
- S. Battaglia, “Quantitative X-Ray Diffraction Analysis on Thin Samples Deposited on Cellulose Membrane Filters,” X-Ray Spectroscopy, Vol. 14, No. 1, 1985, pp. 16-19. doi:10.1002/xrs.1300140105
- D. R. Rowe, M. A. Nouth and K. H. Al-Dhowalla, “Indoor-Outdoor Relationship of Suspended Particulate Matter in Riyadh, Saudi Arabia,” Journal of the Air Pollution Control Association, Vol. 35, No. 1, 1985, pp. 24-26.
- The Powder Diffraction File, Joint Committee on Powder Diffraction Standards, 1980.
- J. A. Adedokun, W. O. Emofurieta and O. A. Adedeji, “Physical, Mineralogical and Chemical Properties of Harmattan Dust at Ile-Ife, Nigeria,” Theoretical and Applied Climatology, Vol. 40, No. 3, 1989, pp. 161-169. doi:10.1007/BF00866179
- T. Fukasawa, M. Iwatsuki and S. P. Tillekeratne, “X-Ray Diffraction Analysis of Airborne Particulates Collected by an Andersen Sampler: Compound Distribution vs. Particle Size,” Environmental Science and Technology, Vol. 17, No. 10, 1983, pp. 596-602. doi:10.1021/es00116a007
- M. Arslan and M. Boybay, “A Study on the Characterization of Dust Fall,” Atmospheric Environment, Vol. 24, No. 10, 1990, pp. 2667-2671. doi:10.1016/0960-1686(90)90146-E
NOTES
*Corresponding author.