Food and Nutrition Sciences
Vol.07 No.14(2016), Article ID:73084,15 pages
10.4236/fns.2016.714126
Physical and Technological Parameters of Maize Varieties (Zea mays L.) Grown in the Southern Parts of Benin and the Influence of Chemical Composition
Josiane Adjobignon Semassa1,2, Victor Bienvenu Anihouvi1*, Adolphe Adjanohoun3, Wilfrid Padonou1,4, Joachim Gbénou5, Lamine Baba-Moussa2
1Laboratoire des Sciences des Aliments, Faculté des Sciences Agronomiques, Université d’Abomey-Calavi, Cotonou, Bénin
2Laboratoire de Biologie et de Typage Moléculaire en Microbiologie, Département de Biochimie et de Biologie Cellulaire, Université d’Abomey-Calavi, Cotonou, Bénin,
3Centre de Recherches Agricoles Sud, Institut National des Recherches Agricoles du Bénin, Attogon, Bénin
4Programme Technologie Agricole et Alimentaire, Centre de Recherches Agricoles d’Agonkanmey, Institut National des Recherches Agricoles du Bénin, Abomey-Calavi, Bénin
5Laboratoire de Pharmacognosie et des huiles essentielles, Faculté des Sciences et Techniques, Université d’Abomey-Calavi, Cotonou, Bénin

Copyright © 2016 by authors and Scientific Research Publishing Inc.
This work is licensed under the Creative Commons Attribution International License (CC BY 4.0).
http://creativecommons.org/licenses/by/4.0/


Received: October 13, 2016; Accepted: December 25, 2016; Published: December 28, 2016
ABSTRACT
Objective: The study aims to investigate some physical and technological parameters of varieties of maize collected from the most representative areas of maize production in the southern part of Benin, and mainly used by the populations of those areas. Method: The chemical composition, physical and technological characteristics of the grains were determined using standard methods. Results: The results showed that the weight of 1000 grains ranges from 158.01 to 305.12 g, the length from 0.79 to 1.81 cm, the average width from 0.74 to 1.51 cm, thickness from 0.36 to 0.85 cm and density from 1.07 to 1.25. Regarding the technological parameters, the hardness of the grains before and after cooking was between 16.78 and 47.20 kgf, and 0.23 and 0.71 kgf respectively, while the cooking time varies from 71.00 and 158.33 mn. There was a positive and significant correlation (r = 0.405; p < 0.026) between the hardness after cooking and the weight of 1000 grains, between the hardness after cooking and grain width (r = 0.460; p < 0.011). A positive and highly significant correlation (r = 0.527, p < 0.003) was also observed between the hardness after cooking and the grain length, between the hardness after cooking and the thickness of grain (r = 0.476, p < 0.008), and between the grain density and the weight of 1000 grains (r = 0.481, p < 0.007). A positive and highly significant correlation (r = 0.923, p < 0.000) was also observed between maize grain length and width, and between grain length and grain thickness (r = 0.764, p < 0.000) and between the width and thickness (r = 0.764, p < 0.000). On the other hand, a significant negative correlation (r = −0.394, p < 0.031) was found between the hardness before cooking and the thickness and between the hardness before cooking and sphericity index (r = −0465*, p < 0.010). Conclusion: Through its chemical and technological characteristics the maize constitutes an important raw material for many culinary recipes in West African region.
Keywords:
Maize, Physical Characteristics, Technological Parameters, Chemical Parameters

1. Introduction
The world maize production in 2010 was estimated at 840 million tons, and ranked first before rice (696 million tons) and wheat (653 million tons) [1] . In West Africa, Nigeria is the largest maize producer with 9.18 million tons in 2011 [1] . In other West African countries, the area for maize production has increased sharply, particularly in the areas of cotton production in Benin, Burkina Faso and Mali. It is the first cereal in Benin, far ahead of rice and sorghum [2] with a national production in 2010 more than one million tons (1,012,630 tons) [3] and 1,345,820.9 tons in 2013 [4] . In the country, maize occupies a prominent place in the diet of the population in view of a consumption level estimated at 96 kg/per capita/day) [5] and the diversity of dishes from maize [6] . Indeed, as stated by Adegbola et al. [7] , maize is used in Benin in several forms according to different destinations. Among the derivatives are pasta, beverages and porridges [8] but also bread, roasted or braised products. It has been thus recorded forty recipes made from maize in Benin, gathering the traditional products of primary processing “lifin”, fermented paste (Ogi, Mawè, etc.), secondary processing products (owo, liquid pap, ablo, solid pap, etc.) and different beverages [6] . In terms of technology ability, major studies have recorded multitude both for local varieties and improved maize [9] [10] [11] . Thus, Sodjinou et al. [12] identified 43 different products derived from maize in food consumption system of Benin. These products are obtained through a variety of traditional skills based on inefficient processing techniques as needs rise. The works done by Dossou-Yovo [10] and Aly [11] on agro-biodiversity in Benin have shown preference of population for traditional varieties because of technological and organoleptic qualities of their by-products found better than those of improved varieties. Farmers have a diverse range of maize varieties they grow and some of which are often oriented to specific agro-food processing because of their technological characteristics. Some traditional varieties formerly available in the national collection are now sought for their grain texture suitable for the preparation of certain dishes and their resistance to storage insects. This is the case of the yellow variety and Houèglé variety for the consistency and elasticity of maize paste, the variety named “Gnonli” for his “bokoun” and the variety “Gbogboé” which could not be preserved due to the lack of appropriate storage structure [13] . Other authors have reported the effect of maize cultivars on the quality of flour “lifin” [6] and that of paste “owo” obtained from “lifin”. Similarly, the influence of particle size of the Ghanean “tuwo” (shelled maize flour) on the textural characteristics of the derived paste was assessed [14] . Several varieties of maize (local and improved) are grown in Benin but their technological and physical characteristics are insufficiently documented. With a view to have a database that could be used in the food processing, this work aims mainly to characterize maize varieties currently in use in different zones of southern part of Benin.
2. Materials and Methods
2.1. Materials
The collection of grain maize samples was conducted in different zones in the Southern part of Benin. A total of 30 varieties including seven improved varieties and twenty-three endogenous varieties were collected. For chemical analysis, the grains of each maize variety were crushed with a crusher (Falling Number, Type 3600) and then ground with a laboratory grinder (Retsch, type ZM 1).
2.2. Determination of the Physical Parameters of the Collected Grains
2.2.1. Measurement of Length, Width, Thickness and Index of Sphericity of Grains
The three dimensions (length, width and thickness) of the grains of each variety were determined on 100 grains randomly selected, using a caliper (Mitutoyo, series 522). Maize grain was placed between the measurement beaks by seeking the best possible contact, and then the reading was taken. The measurements were horizontally done for the length and vertically for the width and thickness for each grain. The sphericity index (SI) was calculated based on the three dimensions according to the following formula:

where L = length; W = width; T = thickness.
2.2.2. Determination of the Weight of 1000 Grains, Density and the Real Volume of Grains
The weight of 1000 grains was determined according to the method described by NFV03-702 standard (AFNOR, 1991). Hundred (100) maize grains were counted and weighed by variety. The total weight of one thousand (1000) grains was obtained by multiplying the weight of 100 grains by 10. Five replicates were performed for each variety. The density (d) was determined by the ratio of real volumetric mass of grain (ρ) to volumetric mass of water (ρo) in kg/dm3. The real volumetric mass of grains was calculated by the ratio of the weight of grains to the real volume of grains. The real volume of grain was determined using a test-tube by test sample of 150 g. 150 g of maize grains were placed into water and the displacement V of the volume of water was read.
2.3. Measurement of Hardness and Cooking Time of Maize Grains
Grain hardness before and after cooking were measured with a texture analyzer (Texture Analyzer Stevens-LFRA), which operates on compression principle of analyzed sample with a conical probe, at a penetration speed of 0.2 mm/sec and a penetration depth of 5 mm. The measurements were performed on 10 grains randomly selected. For the determination of the cooking time, 200 g of maize grains from each variety were washed and then placed into a beaker containing hot water using a heating plate. The time t1 was the period at which water begins to boil. The cooking ended at the moment the majority of grains (90% - 95%) bursts. The time t2 was recorded.
The cooking time T was calculated by the following formula:

2.4. Determination of Chemical Contents of Maize Samples Collected
The ash, protein, fat, fiber, and carbohydrate contents were determined according to [15] (in press).
2.5. Statistical Analysis
The data obtained were subjected to a descriptive analysis using STAISTICA 7.1 software. Pearson correlation test was performed with SAS 9.2 software to establish links between the main physical and technological characteristics of grain maize varieties. An analysis of variance followed by Student-Newman-Keuls (SNK) was performed to compare the grains from different areas of study based on the physical and technological characteristics determined. Numerical classification taking into account the different chemical parameters was performed with SAS version 9.2 software and according to the coefficient of determination R2 = 0.50 the data were subjected to a principal component analysis (PCA) using software SAS 9.2 to describe the relationships between the physical and technological characteristics.
3. Results
3.1. Physical and Technological Characteristics of Maize Grains
The descriptive analysis of the physical and technological data obtained is presented in Table 1. The studied varieties had an average weight of 1000 grains of 224.70 ± 29.04 g, the lowest weight was 158.01 g and the highest weight was 305.12 g. The grain length ranged from 0.79 cm for small ones to 1.81 cm for big ones, the width of the grains varies from 0.74 cm to 1.51 cm , and the thickness of grains was between 0.36 and 0.85 cm . The average grain density was between 1.07 for the least dense and 1.25 for the densest variety with an average of 1.19 ± 0.06. The cooking time varies from 71 min for the least hard varieties and 158.33 min for the hardest varieties with an average of 117.75 ± 24.60 min. On average, the hardness before cooking the grains was 28.41 ± 7.13 kgf with minimum and maximum levels of 16.78 kgf and 47.20 kgf respectively, and the hardness after cooking was between 0.23 kgf and 0.71 kgf with an average of 0.44 ± 0.10 kgf.

Table 1. Descriptive statistics of quantitative variables measured on the varieties.
Table 2. Correlation coefficient of Pearson between quantitative variables.
*p < 0.05; **p < 0.01; ***p < 0.001.
The sphericity index of the grains was between 0.70 and 0.76.
3.2. Correlation between Physical and Technological Parameters of Maize Varieties Collected
Table 2 shows the different correlations between the measured variables. It appears from the analysis of this table that there was a positive and significant correlation (r = 0.405; p < 0.05) between the hardness after cooking and the weight of 1000 grains. In other words the hardest grains after cooking had the highest weight of 1000 grains. Similar correlation (r = 0.460; p < 0.05) was also observed between the hardness after cooking and the width of the grains. The largest grains were the hardest after cooking. A positive and highly significant correlation (r = 0.527; p < 0.01) was observed between the hardness after cooking and the grain length on the one hand, and between the hardness after cooking and the grain thickness (r = 0.476; p < 0.01) on the other hand. The longest and thickest grains were the hardest after cooking. There was also a positive and highly significant correlation (r = 0.481; p < 0.01) between the grain density and the weight of 1000 grains. The densest grains had the highest weight, that is, the more the weight was high the more maize grain were dense. A positive correlation and highly significant (r = 0.923, p < 0.001) was observed between the length and the width of the grains, and between the length and thickness of the grains (r = 0.764; p < 0.001). In other words, the longest grains were the widest and the thickest. A positive and highly significant correlation (r = 0.764; p < 0.001) was also noted between the width and thickness. The largest grains were the thickest. However, a negative and significant correlation (r = −0.394, p < 0.05) was observed between the hardness before cooking and the thickness. The thickest grains showed low hardness before cooking. From all the above results, we can note that the longest maize grains were the widest, the thickest, with the highest average weights, the highest densities with low hardness before cooking.
The analysis of variance showed that the 30 maize varieties used were very significantly (p < 0.001) different in relation to the hardness before cooking, the hardness after cooking, cooking time, the weight of 1000 grains, the length, the width and the thickness of the grains; but 50% (15/30) of varieties were similar in terms of the density (Table 3). The results of SNK test show that variety AB-3-2013-4 was the hardest before cooking, TF-1-2013-18 the hardest after cooking, and the highest cooking time was observed with variety AB-3-2013-48, and variety AB-3-2013-39 revealed the highest weight. Variety TF-1-2013-18 was the longest, the widest and the thickest and finally varieties AB-3-2013-001, AB-3-2013-3004, AB-3-2013-351, AB-3-2013-43, AB-3-2013- 317, AB-3-2013-40, 3-2013-39-AB, AB-3-2013-35, 3-2013-21 AB-AB-3-2013-18, TF-1- 2013-20, 1-2013-21-TF, TF-1-2013-35, TF-2-2013-003, TF-2-2013-004, TF-2-2013-009, TF-2-2013-011, TF-2-2013-016 were the densest (Table 3).
The grouping of the different varieties according to the physical and technological parameters is presented in a dendrogram of three classes (Figure 1). The first group consists of 16 varieties, the second group includes 13 varieties and the third group consists of a single variety. The varieties classified in each group are shown in Table 4. The results of the principal component analysis on these different groups of maize and the analyzed parameters were used to describe the relationship between them and refine their analysis. These results indicate that the first two axes explain 100% of variations for which the first axis account for 80.3% and the second 19.7% (Table 5 and Figure 2).
Table 6 shows the correlation between the physical and technological parameters and the axes. The first principal component opposes the hardness before cooking and the cooking time to the hardness after cooking, the weight of 1000 grains, the length, the width and the thickness of the grains. It appears that any maize variety with hard grains before cooking and high cooking time showed low hardness after cooking, low weight of 1000 grains and low dimensions and vice versa.
In Figure 2, the projection of different variables in the system of axes defined by the groups of varieties revealed that the varieties of Group 1 were the densest with the highest weights, the highest cooking time and high hardness before cooking, whereas
Table 3. Comparison between variables measured on varieties.
*: significant at 0.05; **: highly significant at 0. 01; ***: very highly significant at 0.001; ns: not significant at 5%; a, b, c, d, e, f, g data followed by the same letter in the same column are not significantly different at 5%.
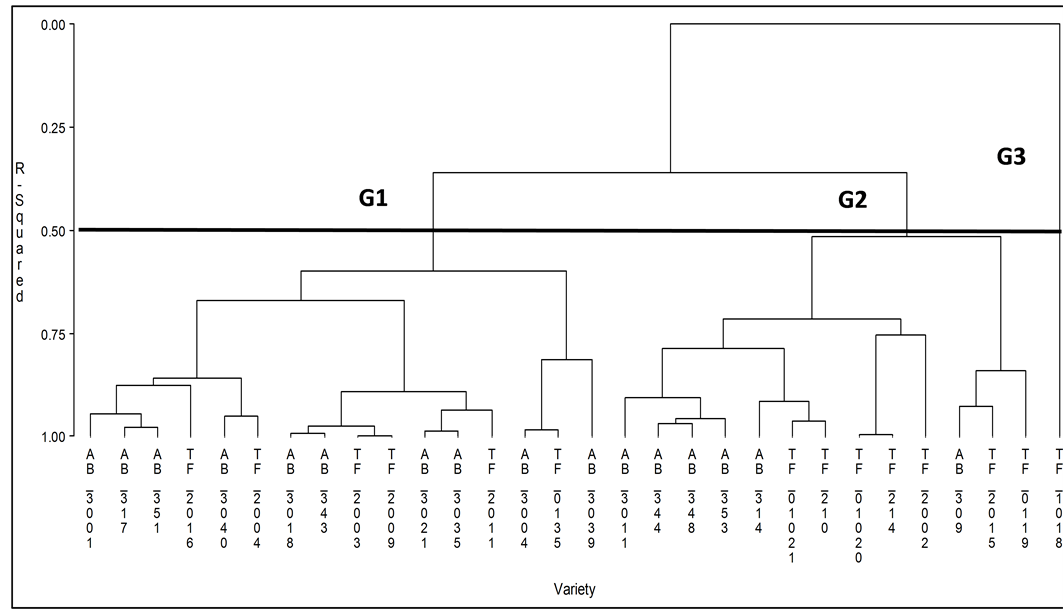
Figure 1. Dendrogram showing different groups of maize varieties.
Table 4. Composition of different groups of maize varieties obtained.
Table 5. Eigen value of the first three principal components.
Table 6. Variables associated with the two first components.
*: p < 0.05; ns: non significant.
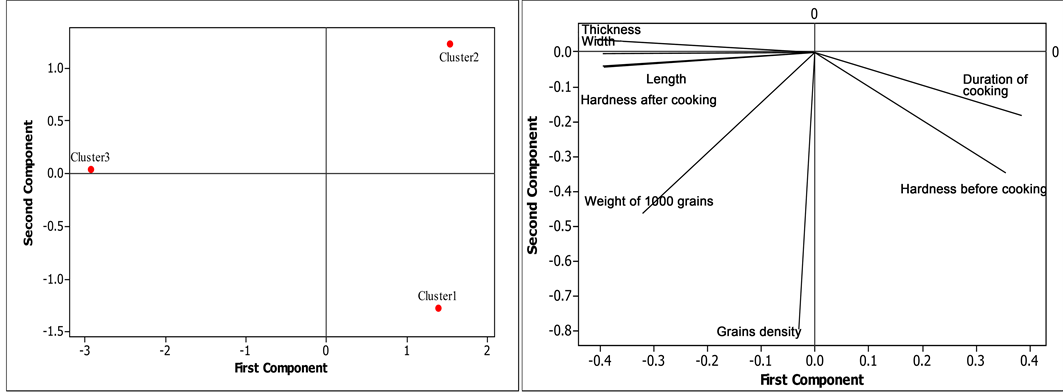
Figure 2. Correspondence Analysis to reveal linkages between maize varieties groups and parameters analysed on axes 1 and 2.
those of Group 2 were the hardest before cooking and had high cooking time. Group 3 showed the hardest after cooking, the longest, the widest and the thickest.
3.3. Correlation between Physical, Technological and Chemical Parameters of Maize Grain Varieties Collected
Table 7 shows the correlations between different variables measured. It appears from the analysis of this table that there was a positive and significant correlation (r = 0.037; p < 0.05) between the hardness after cooking and the water content of varieties. Thus, the hardest grains after cooking were the richest in water. A significant negative correlation was observed between the hardness before cooking and sphericity index (r = −0.465; p < 0.05), the hardest grains before cooking had low sphericity index. Similarly a negative and highly significant correlation was observed between fat content and carbohydrate levels (r = −0.502, p < 0.01), in other words, all varieties that demonstrated high fat content showed low carbohydrate levels. Similar correlation was observed between the fiber contents and the cooking time (r = −0.466; p < 0.01). The varieties that indicated high fiber had low cooking time. A negative and highly significant correlation was observed between the fiber and carbohydrate contents (r = −0.597, p < 0.001), meaning that, the varieties that showed high fiber content had low carbohydrate content.
4. Discussion
The descriptive analyses showed significant differences between the minimum and maximum values for all the physical and technological parameters analyzed. This indicates an important inter-variety variability. In fact, several authors have shown that
Table 7. Correlation coefficient of Pearson between quantitative variables.
*: p < 0. 05 **: p < 0. 01 ***: p < 0.001.
farmer seed management practices, including exchange of varieties among farmers are the source of important diversity between populations of crop plants [16] . The physical and technological parameters of the 30 maize varieties (local and improved) were determined in order to know their morphology and technological ability. Grain weight is based on its size, shape and chemical constituents. The weight of 1000 grains of maize varieties studied was between 158.01 and 305.12 g and was close to those of [17] ranging between 270.80 g and 330.43 g. According to FAO [18] , grain weight depends on, among others, genetic factors related to each variety, but also environmental factors and agronomic practices (fertilization, date and sowing rate, antifungal protection, etc.). The measurement of the weight of 1000 grains is used to determine the yield of cereal before harvest. We therefore deduce that the variety AB-3-2013-039 (CARDER) collected from Djakotomey in the south-west region of Benin showed good yield at harvest. Also, grain variety TF-2013-01-019 (Massahoué) collected from Adjarra in the south-east region showed the smallest weight and this could be explained by the fact that these grains were amongst the shortest and the thinnest maize grains. To that end, the more dense and bulky varieties were AB-3-2013-001 (DMR), AB-3-2013-004 (DMR), AB-3-2013-351 (Acthivi), AB-3-2013-043 (Gotin-wlin), AB-3-2013-017 (Tchigbadé), AB-3-2013-040 (Carder/wilin-wilin), AB-3-2013-039 (CARDER), AB-3- 2013-035 (CARDER), AB-3-2013-021(CARDER), AB-3-2013-018 (Edouantin), TF- 2013-01-020 (EVDT), TF-2013-01-021 (Massahoué), TF-2013-01-035 (Akobigbadé), TF-2013-2-003 (Ovinonboé), TF-2013-2-004 (Massahoué), TF-2013-2-009 (Tchoké), TF-2013-2-011 (Tchikoun), TF-2013-2-016 (Gnonli). The grains with very low density were observed with varieties TF-2013-01-019 (Massahoué), TF-2013-2-002 (Yagbo) and AB-3-2013-009 (Houévi). Furthermore, the axial dimensions vary between 7.9 and 18.1 mm for length, 7.4 and 15.1 mm for width, and 3.6 and 8.5 mm for the thickness. These results are similar to those of Songré-Ouattara et al. [19] who found the values ranging from 9.1 to 12.3 mm for length, 7 to 9.2 mm for width, and 3.4 to 4.5 mm for thickness. The shape of the grains was measured either by the sphericity index which was calculated using the three dimensions of maize grain or by indentation [20] [21] [22] . According to Nago [6] , the more round is a grain, the more its sphericity index is close to unity. Our results showed that the index of sphericity of maize grains was between 0.70 and 0.76. From the values obtained we could conclude that most of the studied maize grains were rather flat. Overall, the shape and the grain size influenced the quality of the grinding products obtained. Thus, the flat grains (low sphericity index) provide more grits than round grains [23] [24] . The hardness expresses the resistance of grain to the crushing or grinding. Some authors have also highlighted the influence of the hardness of certain cereals on the quality of food preparation [25] . The hardness was also linked to the quality of the usage as in the case of wheat, where it represents an important quality parameter. In view of this, the results of this study showed that among the varieties studied we recorded varieties whose grains were moderately hard and varieties whose grains were soft. Concerning the hardness after cooking, variety TF-2013-01-018 (Tchahounkpo) collected from Adjarra showed the highest value (0.71 kgf); this could be explained by the fact that there is a negative and significant correlation between hardness before cooking of grains and thickness. The cooking time corresponds to the time between the start of the cooking (boiling water) of grains and the time they are ready to be eaten, that is at least 90% - 95% of the grains are soft for the mastication.The cooking time varies from 71 to 158.33 min for the varieties studied. The variety TF-2013-01-019 (Massahoué) showed the shortest cooking time of 71 min while AB-3-2013-048 (Edouatchi) requires a maximum time of 158.33 min. These results show that the variety influences the cooking time of the maize grains. The cooking of grains indicates the gelatinization of starch simultaneously softening of the cell walls. It is correlated to the permeability of the integument of the grains to hot water, which depends on the chemical structure of the cell walls, the inherent hardness of the cotyledons and finally grain size [26] . This study also showed that the quantity of cooking water changes from one variety to another. This variability could be explained by the fact that there is a difference in the chemical composition of different parts of the maize grain. Indeed, there was a negative and very significant correlation between the fiber and the cooking time. All the physical and technological characteristics are a set of important commercial criteria that could condition the selection and purchase of grain from food professionals to meet the needs of increasingly demand of customers, especially urban consumers. This work also allowed us to study the influence of the chemical composition of the physical and technological parameters of 30 maize varieties collected. The results showed that the ash and carbohydrate contents, the hardness before cooking, the hardness after cooking, cooking time, grain density, the weight of 1000 grains and the dimensions such as length, width, and thickness are the main physical, chemical and technological characteristics that allowed to differentiate the maize varieties studied. It appeared that the grain weight had an influence on their density that is the more the weight is high, the more the density is high. The same observation was made by Nago [6] who reported that the weight of 1000 grains is a characteristic parameter of the grain size and appears closely related to density. Songré-Ouattara et al. [19] also reported that for cereals such as maize, millet and sorghum, the weight of 1000 grains evolves with density. Likewise the hardness after cooking was influenced by the weight of 1000 grains, the length, width and thickness of the grains. As for the hardness before cooking it acts on the length and the sphericity index, which expresses the shape of the grains. Similar observations have been made by other authors who have highlighted the influence of the hardness of certain cereals on the quality of food preparation [26] . Furthermore it has been observed that the cooking time has an effect on the fiber content of maize grains. Some authors have observed in their study on the cereal grains and leguminous plants that passive variation of total fiber content after cooking reported by Kutos et al. [27] can be attributed to the solubilization of other compounds of the matrix into the cooking water. According to Flatt [28] and Stubbs [29] , the energy value of carbohydrates is about 4 kcal/g while that of fat is about 9 kcal/g, illustrating clearly the superiority of lipids in this field. Thus, this observation is similar to that observed in our study in terms of the relationship between carbohydrate and lipid content.
5. Conclusion
This study enabled us to characterize the physical and technological maize grain from the southern part of Benin. The results of the morphological characteristics of maize studied showed clearly that the varieties demonstrated a difference for all of the characters used. This difference was observed in length, width, thickness, weight of 1000 grains. Overall it showed that the values of each of the measured parameters vary significantly from one variety to another, except for the density of the grains which remained similar. The differences in physical and technological characteristics of grain could be explained in particular by varietal genetic diversity. This study also showed that all improved varieties are the densest and showed the highest weights. It was also observed that there is a relationship between the chemical composition, and physical and technological parameters. Each characteristic is a potential source of interesting criteria for the improvement of maize processing techniques in Benin.
Acknowledgements
The authors wish to thank the Project 1-CNS-maïs of the West African Agricultural Productivity Project (WAAPP) for material and financial support.
Cite this paper
Semassa, J.A., Anihouvi, V.B., Adjanohoun, A., Padonou, W., Gbénou, J. and Baba-Moussa, L. (2016) Physical and Technological Parameters of Maize Varieties (Zea mays L.) Grown in the Southern Parts of Benin and the Influence of Chemical Composition. Food and Nutrition Sciences, 7, 1386-1400. http://dx.doi.org/10.4236/fns.2016.714126
References
- 1. FAOSTAT (2012) Agricultural Database Result.
http://www.fao.org - 2. ONS (2010) Prix Plancher Coton Campagne 2010-2011. Office National de Soutien des revenus agricoles. Unité de Gestion des Programmes PUASA-PDAVV, 79 p.
- 3. AGRISTAT (2012) Statistiques agricoles du Bénin.
http://www.countrystat.org/ben - 4. DPP (2013) Country Stat Food and Agriculture Data Network. Direction de la Programmation et de la Prospective-MAEP Bénin.
- 5. Gandonou, E., Gounou, E., Mitchikpè, E., Biaou, A. and Kpènavoun, S. (2010) Etude sur les niveaux de consommation des principaux produits vivriers et l’insécurité alimentaire au Bénin. rapport CePED-Bénin, 73 p.
- 6. Nago, C.M. (1997) La transformation traditionnelle du mais au Bénin: Détermination des caractéristiques physico-chimiques des variétés en usage ; relation avec l"obtention et la qualité des principaux produits dérivés. Thèse de Doctorat d"Etat es-sciences, Université Paris-7, Deris Diderot, Paris France, 201 p.
- 7. Adégbola, P.Y., Arouna, A. and Ahoyo, N.R.A. (2011) Acceptabilité des structures améliorées de stockage du mais au Sud-Bénin in Bulletin de la Recherche Agronomique du Bénin—Numérospécial 2: Aspects économiques du stockage et de la conservation du mais au Sud-Béni, Septembre 2011, 1-12.
- 8. Charalampopoulos, D., Pandiella, S.S. and Webb, C. (2002) Growth Studies of Potential Probiotic Lactic Acid Bacteria in Cereal-Based Substrates. Journal of Applied Microbiology, 92, 851-859.
https:/doi.org/10.1046/j.1365-2672.2002.01592.x - 9. Nago, C.M. and Hounhouigan, D.J. (1990) La technologie traditionnelle de transformation du mais en pate fermentée au Bénin. Rapport de recherche no. 1, FSA-IRAT-CEE, 30 p.
- 10. Dossou-Yovo, G. (2000) Résultats de l’enquête en milieu paysan, In: Dètongnon,. J., DjinadouIgué, K. and Aly, D., Eds., Actes de l'Atelier national sur la méthode variétale participative, 26-28 Janvier 2000, Cotonou-Infosec, INRAB-CBDD, 17-22.
- 11. Aly, D. (2001) Sélection participative des variétés de mais en milieu paysan au Sud Bénin. Rapport Technique, 5 p.
- 12. Sodjinou, E., Adegbola, P.Y., Zinsou, J. and Oloukoi, L. (2008) Rice and Maize Stratification for Investment Decision Support. Agricultural Policy Analysis Program of the National Agricultural Research Institute of Benin (PAPA/INRAB), and Rice Policy and Development Program, Research Division, Africa Rice Center, Cotonou, 117 p.
- 13. Bolade, K.M., Adeyemi, A.I. and Ogunsua, O.A. (2009) Influence of Particle Size Fractions on the Physicochemical Properties of Maize Flour and Textural Characteristics of a Maize-Based Nonfermented Food Gel. International Journal of Food Science and Technology, 44, 646-655.
https:/doi.org/10.1111/j.1365-2621.2008.01903.x - 14. Djivoh, H. (2009) Caractérisation physico-chimique des graines de néré et mise au point d’une méthode de fragilisation. Thèse d’Ingénieur Agronome FSA/UNB, 60 p.
- 15. Semassa, A.J., Anihouvi, V.B., Padonou, S.W., Adjanohoun, A, Aly, D., Gbenou, J. and Baba-Moussa, L. (2016) Nutritional Assessment of Endogenous and Improved Varieties of Maize (Zea mays L.) Grown in Southern Benin. Pakistan Journal of Biological Sciences. (In Press)
- 16. Mckeye, D., Emperaie, E.L., Elias, M., Pinton, F., Robert, T., Desmoulière, S. and Et Rival, L. (2001) Gestion locales et dynamiques régionales de la diversité variétale du manioc en Amozonie. Genetics Selection Evolution, 33, 465-490.
- 17. Delaunay, S., Tescar, R.P., Oualbego, A., Vom-Brocke, K. and Lancon, J. (2008) La culture du coton ne bouleverse pas les échanges traditionnels de semences de sorgho. Cahiers Agricultures, 17, 189-194.
- 18. Deffan, K.P., Akanvou, L., Akanvou, R., Nemlin, G.J. and Et Kouame P.L. (2015) Evaluation morphologique etnutritionnelle de variétés locales et améliorés de mais (Zea mays L.). Produites en Cote d’Ivoire, 11, 181-196.
- 19. FAO (1993) Le mais dans la nutrition humaine. Alimentation et nutrition. Collection No. 25, FAO Ed, Genève, 119 p.
- 20. Songre-Ouattara, L.T., Bationo, F., Parkouda, C., Dao, A., Bassole, I.H.N. and Et Diawara, B. (2015) Qualité des grains et aptitude à la transformation: cas des variétés de Sorghum bicolor, Pennisetumg laucum et Zea mays en usage en Afrique de l’Ouest. International Journal of Biological and Chemical Sciences, 9, 2819-2832.
https:/doi.org/10.4314/ijbcs.v9i6.23 - 21. Manoharkumar, B., Gerstenkorn, P., Zwingelberg, H. and Bolling, H. (1978) On Some Correlations between Grain Composition and Physical Characteristics of Dry Milling Performance in Maize. Journal of Food Science and Technology, 15, 1-6.
- 22. Paulsen, M.R. and Hill, L.D. (1985) Corn Qualityfactors Affecting Dry Milling Performance. Journal of Agricultural Engineering Research, 31, 255-263.
https:/doi.org/10.1016/0021-8634(85)90092-7 - 23. Pelplinski, A.J., Paulsen, M.R., Anderson, R.A. and Kwolek, W.F. (1989) Physical Chemical and Dry-Milling Characteristics of Corn Hybrids from Various Genotypes. Cereal Chemistry, 66, 117-120.
- 24. Mestres, C., Louis-Alexandre, A., Matencio, F. and Lahlou, A. (1991) Dry-Milling Properties of Maize. Cereal Chemistry, 68, 51-56.
- 25. Raju, G.N., Bhashy, A.M., Narasimha, H.V., Sreedhara Murty, S. and Srinivas, T. (1992) Grain Morphology and Structure in Relation to Milled Product Quality in Maize (Zea mays L.). International Journal of Science and Technology, 27, 213-220.
https:/doi.org/10.1111/j.1365-2621.1992.tb01197.x - 26. Rai, K.N., Gowda, C.L.L., Reddy, B.V.S. and Sehgal, S. (2008) Adaptation and Potential Uses of Sorghum and Pearl Millet in Alternative and Health Foods. Comprehensive Reviews in Food Science and Food Safety, 7, 340-352.
- 27. Uzogara, S.G., Morton, I.D. and Daniel, J.W. (1992) Processing, Microstructural and Nutritional Changes in Cowpeas (Vigna unguiculata) Cooked in Kanwa Alcaline Salt. In: Proceedings of a Regional Workshop on Traditional African Foods Quality and Nutrition, Dares Salaam, 3-5 November 1992, 18.
- 28. Kutos, T., Golob, T., Kac, M. and Plestenjak, A. (2003) Dietary Fibre Content of Dry and Processed Beans. Food Chemistry, 80, 231-235.
https:/doi.org/10.1016/S0308-8146(02)00258-3 - 29. Flatt, J.E. (1995) Use and Storage of Carbohydrate and Fat. American Journal of Clinical Nutrition, 61, 9525-9595.