Food and Nutrition Sciences
Vol.07 No.09(2016), Article ID:69084,15 pages
10.4236/fns.2016.79079
Influence of the Presence of Chemical Additives on the Thermal Properties of Starch
Mostaq Ahammad, T. Thuy Minh Nguyen
Department of Chemistry and Biochemistry, Lamar University, Beaumont, TX, USA

Copyright © 2016 by authors and Scientific Research Publishing Inc.
This work is licensed under the Creative Commons Attribution International License (CC BY).
http://creativecommons.org/licenses/by/4.0/


Received 23 June 2016; accepted 24 July 2016; published 27 July 2016
ABSTRACT
Starch is an essential but very complex semi-crystalline biopolymer. In addition to being an important food source, numerous industrial applications have been proposed for this renewable material. Most applications are highly dependent on the physical properties of the material which are a strong function of the amount of intra- and inter-molecular interactions. This research investigates the potential to manipulate the type and amount of chain-chain interactions to tailor the properties of starch for different applications. Three types of additives acting as probe molecules were used to vary these interactions by changing the amounts and the pH of each sample: a very polar organic molecule, glycerol, a high electron density compound, TiO2, and a mostly hydrophobic organic molecule, cholesterol. Differential scanning calorimetry was used to determine the strength and the amount of chain-chain interactions while Fourier transform infrared spectroscopy was used to follow the nature of these interactions. Results show that the different probe molecules do interact with starch but form chemical interactions at different locations on the chain. We conclude that with proper play on amount, type of additive, temperature cycle, and pH a composite of starch could be tailored for numerous and specific applications.
Keywords:
Starch, Glycerol, TiO2, Cholesterol, Intermolecular Interactions

1. Introduction
Starch is one of the major essential biopolymers because, while it is mostly used as a food source, it also has a wide range of commercial applications such as a biodegradable plastic, adhesive, binder, pharmaceutical additive, and texture enhancer and stabilizer. Applications strongly depend on material properties, which in turn depend on the amounts of intra and intermolecular interactions. Advancements in starch research and development have recently led to increased understanding of starch but, the complete description of the structure of amylose in starch, and more importantly the relation between the intra and intermolecular interactions and the physical properties of the biopolymer is not fully understood [1] [2] . The reason for this is the material’s structural complexity. Starch, a semi-crystalline biopolymer, comprises of two high molecular mass biopolymers of alpha- glucan, amylose and amylopectin. These biopolymers encompass repeating units of α-D-glucose, where glucose monomer units work as the building blocks of starch molecule. Amylose is a linear chain that typically contains up to 3000 glucose monomers interconnected mainly by α-1,4 glycosidic linkages with only a small portion of α-1,6 glycosidic branches [3] . Amylopectin is a highly branched macromolecules with linear linkages of α-1,4 that consist of the backbone and α-1,6 linkages that act as branching points [4] [5] . The ratio of these two polysaccharides depends on the botanical source of the starch. Common sources usually contain 20% - 35% amylose but, “high” amylose maize starches have more than 40% of amylose [6] .
The physical and thermal properties of these materials are strongly related to the three-dimensional structure of the molecule. Amylose can form two kinds of helical structures: a rigid left-handed single helix, and a more rigid parallel stranded left-handed double helical structure due to chain-chain interactions [7] . The single helix amylose contains a hydrophobic inner surface of low solubility mostly as the result of the large number of intra- molecular hydrogen bonds [8] . Hydrogen bonds form between oxygen atoms at the second and the sixth carbon position of each glycosidic unit on the outer sphere of the single helix. Though the single helix amylose structure has a hydrophobic core, it is still able to hold water molecules loosely. These water molecules can be easily replaced with more hydrophobic molecules such as glycerol and iodine [9] . The double helix structure contains widespread inter- and intra-molecular hydrogen bonds at the inner and outer surfaces as well as at the surface of each helix [9] . A hydrophobic inner surface is formed which also can bind guest molecules such as glycerol, iodine and alcohols into an inner channel. The polysaccharide chain is believed to form inclusion complexes by accommodating a variety of compounds in the core space of the helix.
Concentrated solutions of starch will result in increased intermolecular interactions and recrystallization can occur. Starch can crystallize into three distinct polymorphic structures called A, B, and V. Both A and B are composed of left-handed parallel double helices packed in an orthorhombic crystalline lattice [10] - [13] . Polymorph A was found to be slightly deformed compared to form B due to the amount of water and the packing of double helices [7] [14] [15] . These structures are primarily stabilized by the formation of intramolecular hydrogen bonds between strands of the double helix [7] . The double helices within forms A and B are similar in terms of helical structure. However, the packing of these polymorphs is different [6] . The A type crystalline arrangement is more densely packed than the B type and contains only four water molecules per unit cell. The B type crystalline structure, which displays a more open structure in a hexagonal pattern, contains thirty-six water molecules. Amylose also can form a so called V type polymorphic structure due to the presence of guest molecules such iodine, fatty acids, lipids etc. [16] [17] . Amylose forms complexes with these guest molecules to produce a six-fold left handed single helix with an anti-parallel arrangement [11] .
Thermal analysis is ideally suited to investigate the thermodynamics of crystal formation. In addition, starch possesses two other main types of transformation, gelatinization, and retro-gradation. These account for many structural changes of amylose, and are responsible for weakening or strengthening intra- or intermolecular interactions between the amylose chains. Gelatinization is the reordering of starch intermolecular polymer chains at elevated temperature in the presence of sufficient water. During this process, intra- and inter-molecular hydrogen bonds are changed during cycles of temperature increases with subsequent cooling [18] - [20] . The gelatinization process causes significant structural changes in the physical and chemical properties of starch. When water hydrates the double helices, the rearrangement of bonds occurs between water and starch molecules at raised temperatures. Gelatinization usually happens between 55˚C and 75˚C [20] . Retro-gradation involves the rearrangement of amylose molecules in starch which increases the crystallinity of starch structures. In amylose, 40 - 70 monomer glucose units in double helices aggregate together to form crystal arrangements during this process [21] . Both parallel and anti-parallel double helices are formed because of retro-gradation. These helices are characterized dissociated by similar amounts of free energies. The helices interact with each other to make B-type semi-crystalline units, which accumulate to form inter- or intra-molecular networks [22] .
The variety of crystalline content and structure as well as the processes of gelatinization and retro-gradation make starch an ideal candidate for a variety of purposes from food source to slow released drug matrixes to composite material. The consistent forces differentiating these processes are the intra- and intermolecular interactions. The control of these interactions could lead to tailoring of the properties needed for specific applications involving starch. The aim of this research is to determine the role and nature of interactions between polycarbohydrate chains. In this study, glycerol, TiO2 and cholesterol are used as molecular probes to follow these interactions as a function of pH, and thermal treatment. The strength of these interactions was determined thermally using Differential Scanning Calorimetry (DSC) and the nature of the interactions was followed by Fourier Transform Infrared Spectroscopy (FTIR).
2. Methodology
2.1. Materials
Starch was acquired from Sigma-Aldrich Co. (St. Louis, MO, USA). This product was used as received and contained less than 1% of butanol. Glycerol, TiO2 and cholesterol were used as a molecular probe, and were purchased from Fisher-Scientific (Fair lawn, NJ, USA). No purification steps were performed prior to using these materials for experiments.
2.2. Sample Preparation
Samples were prepared by adding 30% (W/W) deionized water such as 0.1 g of starch was weighted in a small beaker and 43.0 mg of water were added to it. Then 18.0 mg, 34.0 mg, 54.0 mg probe molecules (glycerol, TiO2 and cholesterol) were added into starch paste to prepare 15%, 25%, 35% (w/w) samples respectively. These samples were sonicated for 10 minutes to prepare homogenous mixtures. A stock solution of 1.0 M NaOH was prepared and used instead of deionized water to change the pH of starch samples. Starch containing 30% (w/w) NaOH, was prepared by adding 43.0 mg of 1.0 M NaOH solutions to starch. Samples containing TiO2 and cholesterol were prepared in the same manner.
2.3. Sample Fourier Transform Infrared (FTIR) Measurements
A Thermo Nicolet Nexus-470 FTIR was used at a resolution of 2 cm−1 and 32 scans. A single bounce attenuated total reflectance (ATR) zinc selenide (ZnSe) crystal was used to collect sample spectra. The OMNIC software package was used to analyze all spectra and perform baseline corrections. At least three samples were analyzed to ensure reproducibility.
2.4. Differential Scanning Calorimetry Measurements
A TA Instruments Q20 was used to determine the changes in enthalpy associated with the presence of interfering interactions. The sampling time was 0.10 seconds/point to record data using the following thermal method: heating up to a temperature of 150˚C, followed by an isothermal step for 10 minutes, and a cooling ramp to 20˚C. Heating and cooling rates were both 10˚C/min. To determine the reversibility of the processes, an isothermal step was added and maintained for 10 minutes and then heating ramp temperature was raised to 150˚C. Indium was used as the calibration standard. Reported results are the average of at least three replicates.
3. Results and Discussion
The objective of this research is to determine the role and nature of interactions between polycarbohydrate chains upon the addition of glycerol, TiO2 and cholesterol under different pH and thermal conditions. The strength of these interactions will be determined using DSC and the nature of the interactions will be followed by FTIR.
3.1. Thermal Analysis of Starch with Glycerol at Different pH Conditions
Glycerol was used as a probe molecule to investigate chain-chain interactions between polycarbohydrate chains in terms of pH and thermal treatment. This molecule contains three hydroxyl (-OH) groups and is expected to have a significant effect on inter- or intramolecular hydrogen bonds in starch macromolecules. Thermal analysis was used to investigate the strength and the number of interactions between starch chains in the presence of glycerol. Figure 1 shows typical DSC traces of starch containing 30% water (W/W) and various amounts of glycerol at a pH of 7 Figure 1(a), 10 Figure 1(b) and 14 Figure 1(c). Figure 1(a) shows that when 15% (w/w) glycerol is added, the maximum transition temperature is shifted dramatically from 53˚C to 80˚C with a large enthalpy changes from 99 J/g to 311 J/g at pH 7. With the addition of increasing amount of glycerol, the transition temperature also shifts to higher temperature but the enthalpy decreases. This result suggests that the addition of glycerol decreases the numbers of chain-chain interactions probably because of the formation of hydrogen bonds between glycerol and starch molecules at pH 7. However, the increase in the transition temperature suggests that the strength of the interactions increases. Figure 1(b) illustrates the sudden decrease of transition temperature at pH 10 in the absence of glycerol. This is possibly due to the dissociation of intermolecular bonds in the presence of a base. However, the transition temperature significantly increases from 45˚C to 62˚C in the presence of 15% (w/w) glycerol while the ∆H decreases from 109 J/g to 85 J/g. The transition temperatures
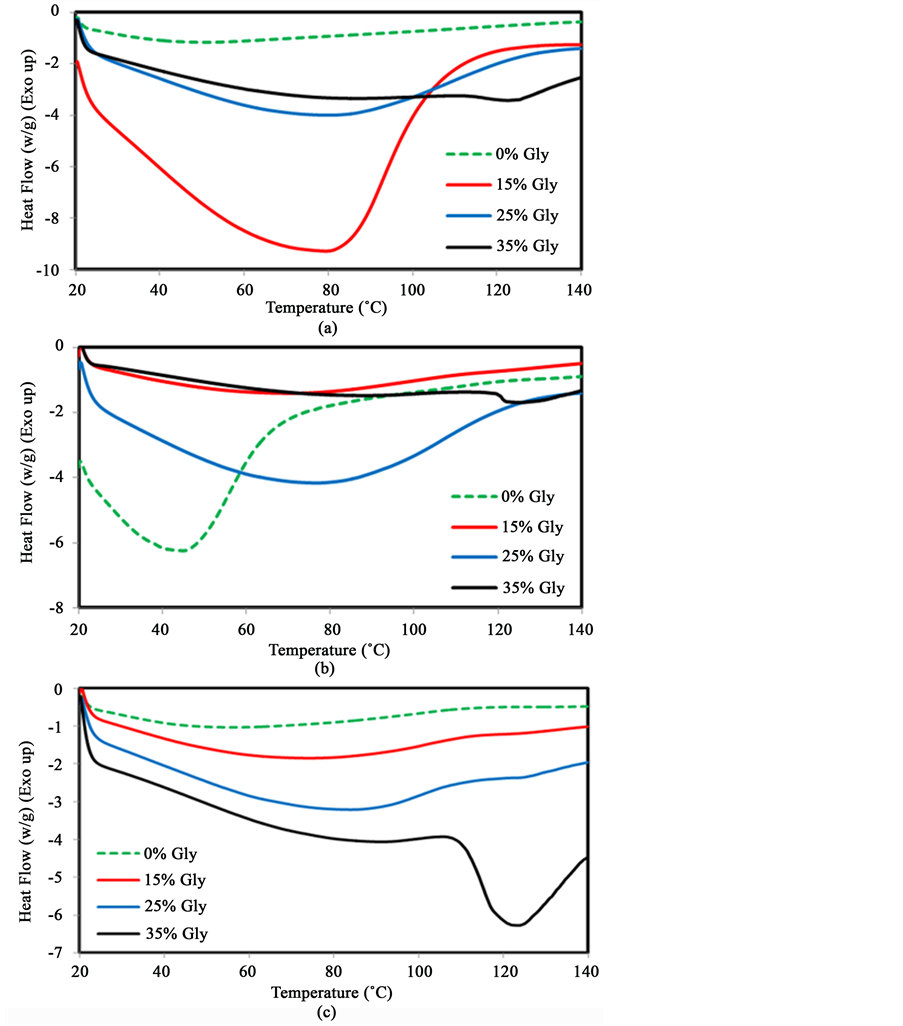
Figure 1. DSC traces of starch with the addition of different amounts of glycerol at pH 7 (a); 10 (b); 14 (c).
continues to increase to 72˚C and 132˚C with the addition of 25% and 35% glycerol respectively at pH 10. This suggests that glycerol is responsible for the formation of intermolecular hydrogen bonds with starch and may act as a link to stabilize ordered chains. Figure 1(c) shows that the transition temperature increases from 58˚C to 68˚C with the addition of 15% (w/w) glycerol at pH 14. The transition temperature of starch also shifts to 71˚C and 125˚C with the addition of 25% and 35% glycerol respectively. A sharp endotherm transition is also observed starting at around 108˚C with at maximum at 125˚C when 35% glycerol is added. The enthalpies (∆H) decrease steadily from 95 J/g to 89 J/g, 81 J/g and 45 J/g with the addition of 15%, 25% and 35% glycerol respectively. These results support the previous hypothesis that glycerol molecules help stabilize chain-chain interactions especially at higher pH. The data for the change in transition temperature is illustrated in Figure 2, while the variation in enthalpy of the order-disorder transition is shown in Figure 3.
Figure 2 shows that the transition temperature in starch from 53˚C to 77˚C and 82˚C with the increasing amount of glycerol 15%, 25% (w/w) respectively at pH 7. However, the addition of 35% (w/w) glycerol results in a large increase, from 82˚C to around 125˚C. Increasing the pH to 10 and 14, results in a similar trend. These seemingly exponential increase in the transition temperature suggests that the addition of glycerol increases the strength of chain-chain interactions between starch chains. At higher pH, hydroxyl ions (-OH-) go into starch inner hydrophobic surface and dissociate intra-molecular hydrogen bonds. Hence, starch helices are steadily unraveled as intermolecular hydrogen bonds are replaced. However, with the addition of glycerol, the variations with the pH are comparable to the experimental standard deviation. Glycerol molecules may form stronger inter- molecular hydrogen bonds in the hydrophobic inner surface of the helical structure and promote stronger chain-chain interactions.
While the addition of glycerol increases the strength of the starch ordered phase, the change in enthalpy shown in Figure 3 reveals a different aspect. A sharp increase in enthalpy (∆H) from 95 J/g to 312 J/g occurs

Figure 2. Variation of the transition temperature with increasing amounts of glycerol at different pH.
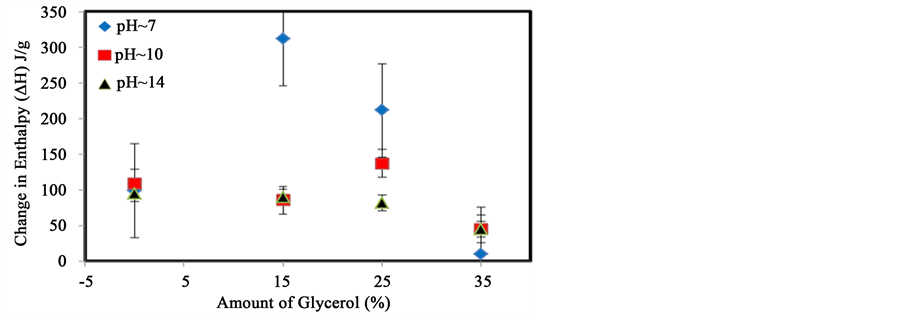
Figure 3. Variation of the enthalpy (∆H) of the transition with increasing amounts of glycerol at different pH.
with the addition of 15% (w/w) glycerol at pH 7. The change in enthalpy starts to decrease rapidly from 312 J/g to 212 J/g and 10 J/g with the addition of 25% and 35% glycerol respectively. This suggests that small amounts of glycerol can promote the formation of a greater numbers of inter/intra molecular hydrogen bond between starch chains. The addition of a larger amount of glycerol may provide competitive options for intra or inter- molecular interactions which lead to an overall decrease in the number of interactions.
At pH 10, the enthalpy is not affected by the addition of 15% glycerol. However, the enthalpy slightly increases from 90 J/g to 137 J/g when 25% (w/w) is added, while the addition of 35% glycerol significantly decreases the enthalpy of the transition from 137 J/g to 44 J/g. As discussed previously, the addition of a base may disrupt the inner helical hydrogen bonds in starch and gradually unravel the helices structure to allow even more glycerol molecules to interact with starch. Too much glycerol will lead to a competition for the replacement of starch-starch in favor of starch-glycerol interactions. However, if a sufficient amount of glycerol is added, the number of interactions between starch-glycerol-starch is optimized. These results show that a polar molecule can interact with starch to modify the thermal and physical properties of the starch. A similar analysis will now be presented using an electron rich molecule, TiO2.
3.2. Thermal Analysis of Starch with TiO2 at Different pH Conditions
Nanoparticles of TiO2 have been used to study the physicochemical behavior of starch molecules and we suggest that this material with its delocalized electrons may affect inner and outer surfaces of the starch helical structure in a way similar to the effect of glycerol.
Figure 4 shows the DSC traces of starch containing different amounts of TiO2. Figure 4(a) shows the traces at pH 7. The transition temperature of starch molecules increases from 53˚C to 74˚C upon addition of 15% (w/w) TiO2. However, it decreases to 60˚C and 54˚C when 25% and 35% TiO2 is added respectively. The change in enthalpy (∆H) occurs rapidly from 99 J/g to 258 J/g due to the presence of 15% (w/w) TiO2. However, the ∆H decreases slightly to 219 J/g and 234 J/g with the addition of 25% and 35% TiO2 into starch respectively. Figure 4(b) shows DSC traces of samples at pH 10. As previously observed, the order-disorder transition temperature shifts from 45˚C to about 54˚C with the addition of 15% TiO2. But, the transition temperature moves to lower temperature (48˚C) when 25% (w/w) TiO2 is added. Again, an increase is observed to around 55˚C, when 35% of TiO2 is added. The change in enthalpy (∆H) increases slightly from 45 J/g to 55 J/g when 15% TiO2 is added, while the ∆H shifts to 48 J/g and 54 J/g due to the addition of 25% and 35% TiO2 respectively.
Figure 4(c) presents the DSC traces of the samples at pH 14. Sharp endotherms are observed with addition of increasing amounts of TiO2 at pH 14. The transition temperature increases significantly from 57˚C to about 102˚C following the addition of 15% (w/w) TiO2 to starch. However, it decreases steadily to 88˚C and 85˚C when the amount of TiO2 increased to 25% and 35%with the presence of 25% and 35% respectively. No significant changes in enthalpy (∆H) occur following the addition of 15% TiO2 at pH 14. However, ∆H decreases from 95 J/g to 62 J/g when 25% TiO2 is added, and increases to 111 J/g when 35% TiO2 are added.
Figure 5 shows the variation of the transition temperature with the addition of different amounts of TiO2 to starch at pH 7, 10, and 14. As noted, each transition temperature reaches a maximum when 15% (w/w) TiO2 is added irrespective of the pH. This suggests that TiO2 interacts with starch in a way similar to glycerol. TiO2 may form bonds on the outside of the single helical structure of starch as nanoparticles of TiO2 have more electronegative oxygen atoms with delocalized electrons. However, the addition of larger amounts of TiO2 may disrupt the formation of starch-starch interactions. This suggests that as the presence of negative ions increases the electron availability increases, which enables TiO2 to transfer electrons over multiple locations.
The effect on the enthalpy of the order-disorder transitions was also investigated. Figure 6 shows the change in enthalpy with the addition of different amounts of TiO2 at different pH. A maximum value is observed at different amounts of TiO2 for different pH values. At pH 7, when 15% TiO2 was added to starch, the enthalpy increased from 95 J/g to about 250 J/g and remained at that value when more TiO2 was added. At pH 10, the maximum was achieved when 25% TiO2 was added. At a higher pH however, the addition of TiO2 did not affect the enthalpy. This phenomenon suggests that the addition of small amounts of TiO2 can increase the number of intermolecular chain-chain interactions in starch. With larger amount of TiO2, these interact with each other, decreasing the number of particle-chain interactions. The enthalpy decreases rapidly with the increase in pH. Since the results show that a high electron density can affect the thermal properties of starch, a more non-polar molecule, cholesterol was added to confirm this effect.

Figure 4. DSC traces of starch with the addition of different amounts of TiO2 at pH 7 (a); 10 (b); 14 (c).
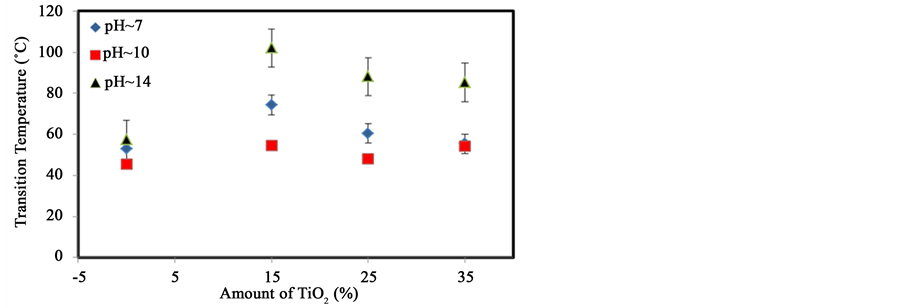
Figure 5. Variation of the transition temperature with increasing amounts of TiO2 at different pH.
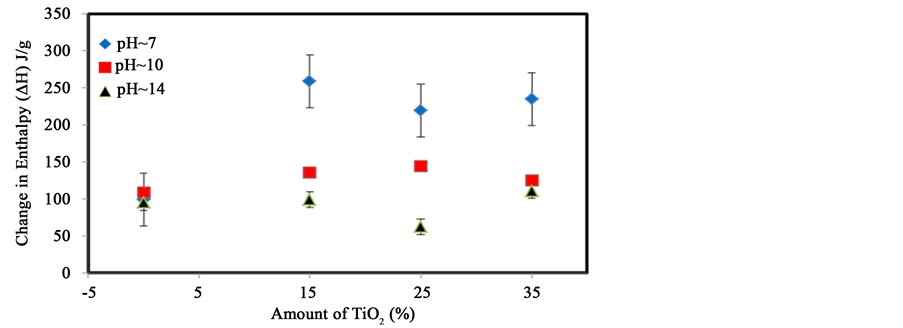
Figure 6. Variation of the enthalpy (∆H) of dissociation of starch with increasing amounts of TiO2 at different pH. The error bars represents the standard deviation of least three replicates.
3.3. Thermal Analysis of Starch with Cholesterol at Different pH Conditions
Cholesterol was also used as probe molecule to study the physicochemical behavior of starch molecules by thermal analysis. It is a bulkier, mostly hydrophobic, organic molecule containing a hydroxyl group. Figure 7(a) shows that the transition temperature of starch steadily decreases from 53˚C to 47˚C, 45˚C and 42˚C following the addition of 15%, 25% and 35% cholesterol respectively at pH 7. This decrease suggests that the addition of cholesterol decreases the chain-chain interactions of starch molecules. Values of the change in enthalpy (∆H) increase slightly from 99 J/g to 127 J/g, when 15% cholesterol was added. However, when larger amounts (25% and 35%) of cholesterol are added, ∆H decreases to 90 J/g and 56 J/g respectively. Figure 7(b) shows that the transition temperature of starch increases slightly from 45˚C to around 55˚C in the presence of 15% (w/w) cholesterol at pH 10. However, it varies from 55˚C to 48˚C and 54˚C with the addition of 25% and 35% cholesterol respectively. These variations are not necessarily significant suggesting that very little interactions occur between cholesterol and starch at this pH. A large increase in the enthalpy change from 109 J/g to about 181 J/g was observed in the presence of 15% cholesterol at pH 10. When more cholesterol (25% and 35%) was added, the enthalpy varied from 109 J/g to 116 J/g and 159 J/g respectively. Figure 7(c) shows that significant changes occur at pH 14 with the addition of cholesterol. The shape of the transition is changed in addition to being shifted to higher temperatures for specific amounts of cholesterol. The analyses of the transition temperature variation and of the change in enthalpy are presented in Figure 9 and Figure 10 respectively.
Figure 8 shows that with the increase of the amounts of cholesterol, the transition temperature decreases slightly if at all, at pH 7 and may increase from 45˚C to 57˚C at pH 10. A significant change is only observed at pH 14. This suggests that cholesterol cannot readily interact with starch unless the helical structure and intramolecular interactions are weakened by the addition of base.
Figure 9 shows the changes of the enthalpy of the order-disorder transition in starch at different pH with increasing amounts of cholesterol. Large variations are found. The enthalpy increased from 95 J/g to 128 J/g following the addition of 15% cholesterol at pH 7. However, the enthalpy decreased to 85 J/g and 56 J/g, when 25% and 35% cholesterol were added. Similar results were observed at pH 10. However, large fluctuations are found at pH 14. The enthalpy decreased from 94 J/g to 61 J/g with the addition of 15% cholesterol at pH 14 and increased to 85 J/g and about 165 J/g with the addition of more cholesterol, suggesting that a base is necessary to promote interactions between starch and cholesterol. These results support the hypothesis that a high electron density is needed to have significant interactions with starch.
3.4. FTIR Analysis of Starch
According to Kizil and coworkers, a typical untreated starch spectrum includes two peaks at 860 cm−1 and 930 cm−1 [23] - [25] . The peak at 860 cm−1 was assigned to CH2 deformation and the peak at 930 cm−1 was assigned to the skeletal vibration of the α-1,4 glycosidic linkage (C-O-C). Starch also contains bands at the 995 cm−1 and 1079 cm−1 positions which are assigned to C-C or C-O stretching vibrations in C-OH, and C-H bending vibrations respectively [26] . Figure 10 shows the typical spectrum of starch in the mid-IR region between 1200 and
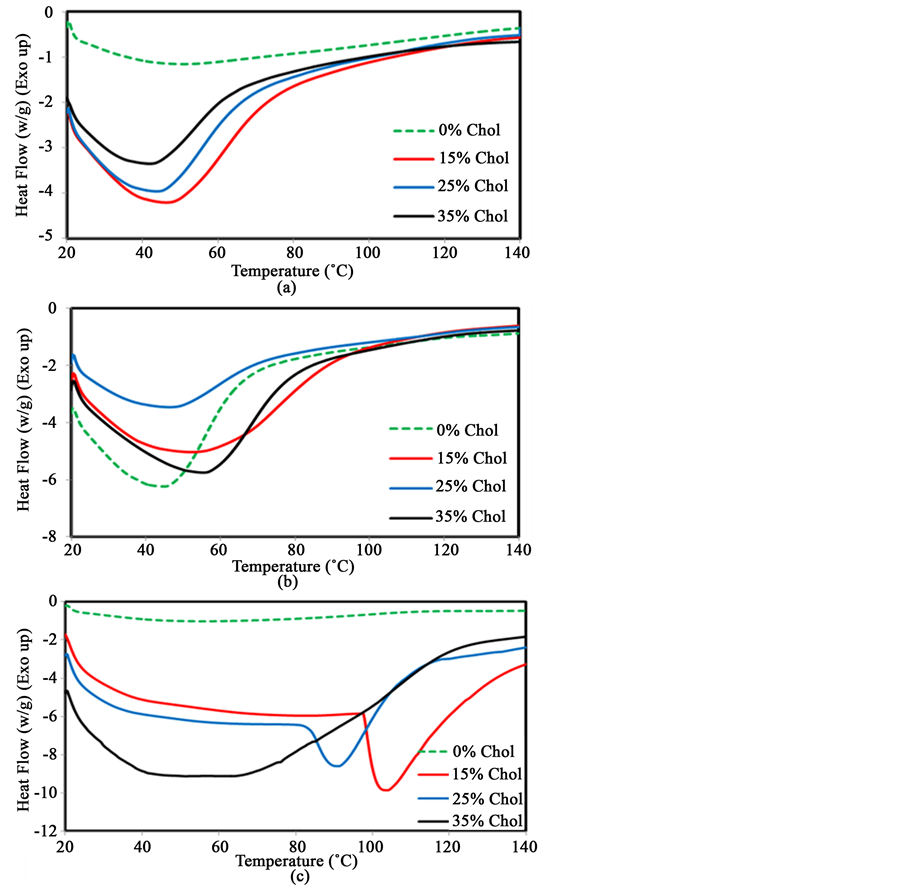
Figure 7. DSC traces of starch with the addition of different amounts of cholesterol at pH 7 (a); 10 (b); 14 (c).
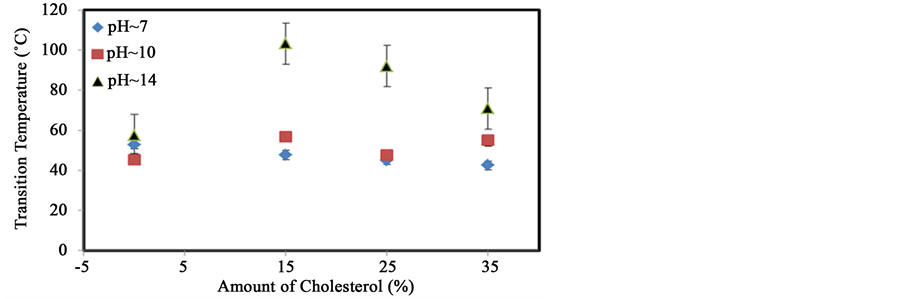
Figure 8. Variation of the transition temperature with increasing amounts of cholesterol at different pH.
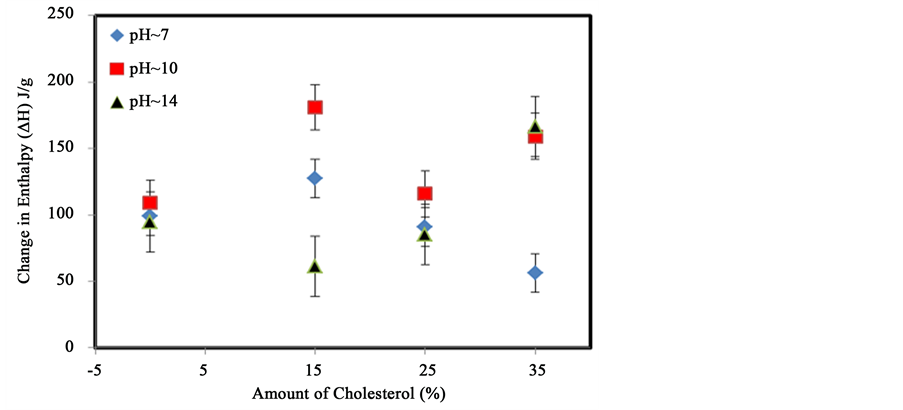
Figure 9. Variation of the enthalpy of dissociation of starch with increasing amounts of cholesterol at different pH. The error bars represents the standard deviation from at least replicates.
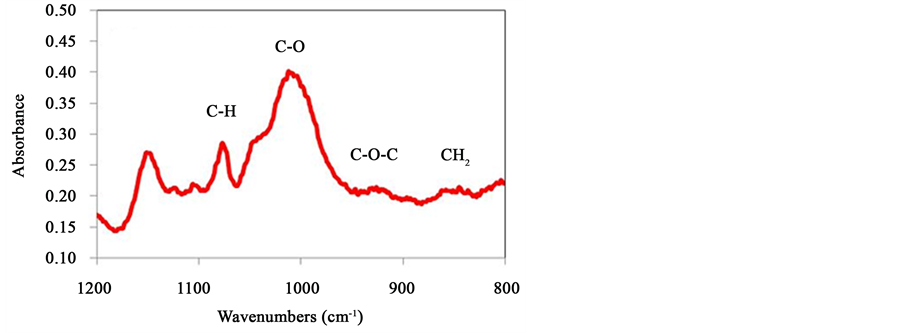
Figure 10. Typical FTIR spectrum of starch.
800 cm−1. As expected, the CH2 deformation band and the stretching vibration of the 1,4 glycosidic linkages (C-O-C) are found around positions 860 cm−1 and 930 cm−1 respectively at pH 7. This spectrum also shows C-C stretching vibration and C-H stretching vibrational band at 1000 cm−1 and 1076 cm−1 position. This region of the spectrum was selected to investigate starch binding with other probe molecules since it involves vibrations of the key chemical groups of the polysaccharide and water molecules do not interfere with the spectrum.
3.5. FTIR Analysis of Starch with Glycerol at Different pH
Figure 11 shows the variation in the peak position of IR bands for starch containing different amounts of glycerol. Four peaks are followed at three different pH values. The CH2 deformation, the C-O-C stretching vibration, the C-O stretching vibration, and the C-H bending vibration. The error bars characterize the standard deviation from the averages of at least three samples. Figure 11(a) shows that the peak around at 860 cm−1 representing the deformation of CH2 shifts to lower wavenumbers, from 861 cm−1 to 849 cm−1, when glycerol is added at pH 7. Similar trend lines are also observed at higher pH. The spring constant of this vibration is affected by the deformation of the angle within the C-CH-OH group suggesting that interactions with particular hydroxyl group are possible. Figure 11(b) shows the variation in the stretching vibrations of α-1,4 glycosidic linkages. This peak shifts from 930 cm−1 to 923 cm−1 at pH 7 and it also decreases further at pH 10 and pH 14. This suggests that glycerol may interact with the C-O-C groups through the formation of hydrogen bonds. These kinds of
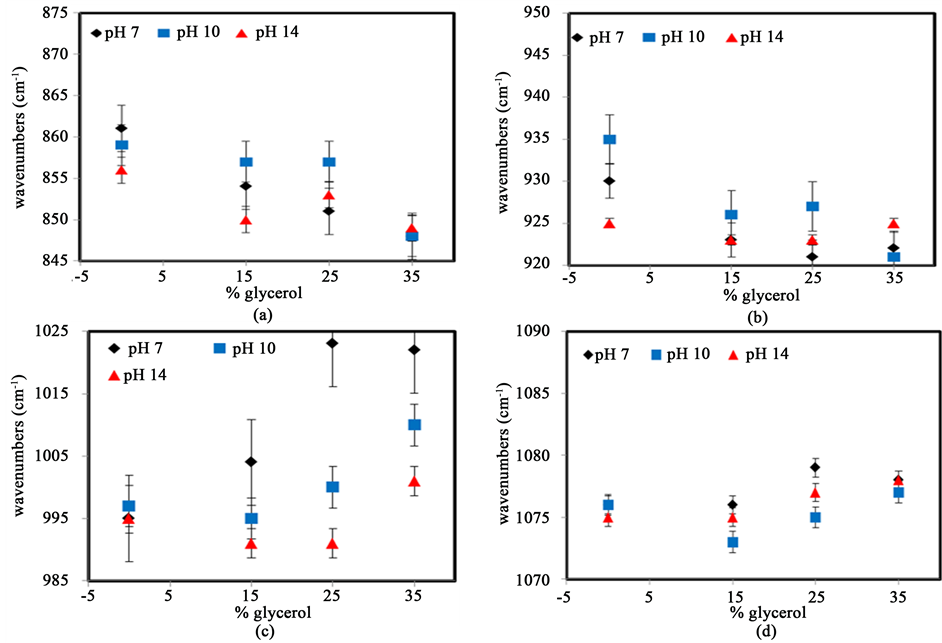
Figure 11. Variation in peak position of IR bands of starch at several percentages of glycerol for different pH values: (a) CH2 deformation; (b) C-O-C stretching vibration; (c) C-O stretching vibration; (d) C-H bending vibration. The error bars represent the standard deviation from the averages of at least three samples.
interactions reduce the vibration of C-O or C-C bonds as the energy associated with the vibration. Figure 11(c) shows that the peak around 995 cm−1, associated with C-O stretching vibrations, shifts to 1022 cm−1 as the amount of glycerol increases at pH 7. The peak shift occurs more sharply in starch at pH 7 rather than higher pH conditions, suggesting that glycerol more strongly interacts with the hydroxyl groups of starch at this pH. Under more basic condition, these interactions may compete with anions in solution. Figure 11(d) shows the variations of the C-H vibrational band found at around 1076 cm−1. Only small peak shifts are observed suggesting that no direct interactions with glycerol occur though this chemical group. The small changes observed are probably the result of bond angle deformations caused indirectly by the binding of glycerol with a different chemical group.
3.6. FTIR Analysis of Starch with TiO2 at Different pH Conditions
Similar sets of experiments were performed upon addition of TiO2. The observed variations in peak position are shown in Figure 12. Figure 12(a) shows the changes in the peak around 860 cm−1, associated with CH2 deformation. The variation is strongly dependent on pH. At pH 14, the peak shifts to higher wavenumbers as the amount of TiO2 is increased however, at pH 7 and pH 10, only poorly defined fluctuations are observed. These small changes suggest that TiO2, contrary to glycerol does not significantly interact with C-CH2-OH group except at very high pH.
Figure 12(b) shows that the peak around 930 cm−1, representing skeletal stretching vibration of α-1,4 glycosidic linkages, shifts towards lower wavenumbers as TiO2 is added at different pH conditions. This implies that TiO2 interact readily with the glycosidic bond group causing a deformation of the ring, which results in the observed peak shift. Figure 12(c) shows that the C-O stretching peak found at around 995 cm−1 increases significantly with increasing amount of TiO2 at pH 7, 10 and 14. This indicates that TiO2 helps to destabilize the starch helical structure at higher pH conditions. Finally, Figure 12(d) illustrates the variation of the peak around 1079 cm−1,
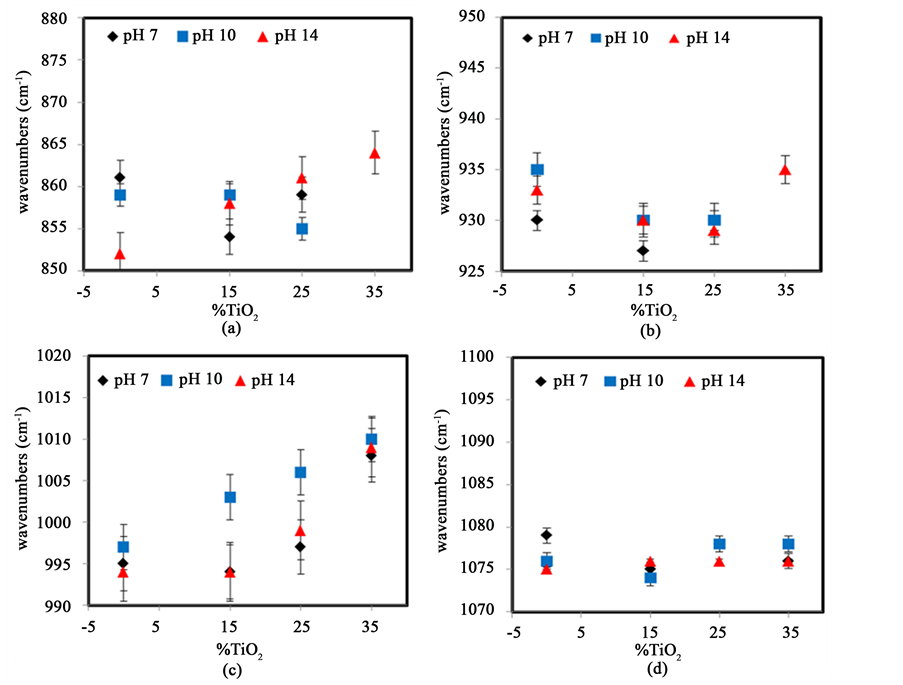
Figure 12. Variation in peak position of IR bands of starch at several percentages of TiO2 and different pH values: (a) CH2 deformation; (b) C-O-C stretching vibration; (c) C-O stretching vibration, (d) C-H bending vibration. The error bars repre- sent the standard deviation from the averages of at least three replicates.
which is associated with bending vibrations. There are no significant changes occurring in this peak peaks as the amount of TiO2 increases at any pH confirming that this chemical group is not involved in chain-chain or TiO2-chain interactions either directly or indirectly.
3.7. FTIR Analysis of Starch with Cholesterol at Different pH Conditions
A similar set of experiments was conducted by adding cholesterol to starch. The analysis is summarized in Figure 13, which shows the variation in peak position of IR band of starch at several percentages TiO2 for different pH. Figure 13(a) shows that large variations exist for the CH2 deformation peak but no clear trend lines are identified regardless of pH. These fluctuations, which also involve large error bars, may be the result of the fact that cholesterol does not interact with the C-CH2-OH group in a systematic way. Figure 13(b) shows the variations for the peak around 930 cm−1 associated with skeletal vibrations of α-1,4 glycosidic linkages (C-O-C). The addition of cholesterol shifts this vibration to higher values at pH 14, but the peak shifts to lower wavenumbers at pH 7 and 10, suggesting that the presence of a strong base is needed for cholesterol to interact with the glycosidic bond. This result corroborates those found using DSC. These effect could be explained by the hypothesis that, at lower pH, the cholesterol molecules may attempt to insert themselves into the hydrophobic center of the starch helix which would presumably affect the rigidity of the molecule and cause a deformation of the angles of C-O-C glycosidic bond. Figure 13(c) shows the variation of the peak at around 995 cm−1, representing C-O stretching vibration. At all values of pH, the addition of cholesterol results in an increase in the peak position of this band up to a maximum value, supporting the hypothesis that cholesterol can insert itself in the hydrophobic core of the starch helix. Figure 13(d) shows the evolution of the peak at 1079 cm−1, representing C-H bending vibrations. Once again, the addition of cholesterol does not have significant effect on this band position.
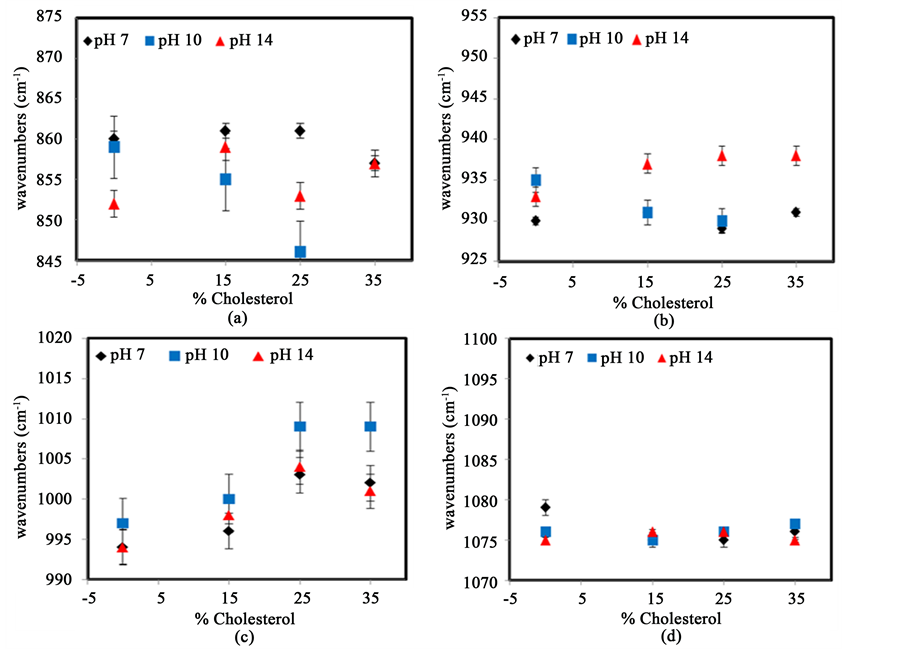
Figure 13. Variation in peak position of IR bands of starch at several percentages of cholesterol and different pH values: (a) CH2 deformation; (b) C-O-C stretching vibration; (c) C-O stretching vibration; (d) C-H bending vibration. The error bars represent the standard deviation from the averages of at least three samples.
4. Conclusion
The physico-chemical behavior of starch chain interactions was studied in the presence of three types of probe molecules: a very polar organic molecule, glycerol, a high electron density nano-material, TiO2, and an amphiphilic organic molecule with much lower electron density, cholesterol. Using a combination of DSC and FTIR and by varying the pH values of the samples, the effect of the addition of the probe molecules on the strength and number of inter- or intramolecular chain-chain interactions of starch was determined. Thermal analysis results show that glycerol causes an overall increase in the order to disorder transition temperature at pH 7, pH 10, and pH 14. The addition of TiO2 resulted in increases in both the transition temperature and enthalpy at high pH values only, while the addition of cholesterol resulted in fluctuations of temperature mostly at high pH. FTIR spectra were recorded to investigate the nature of the interactions between probe molecules and starch chains. Results suggest that glycerol was interacting both inside and on the outside of the polysaccharide helix causing fluctuations in the vibrational frequency of the CH2 deformation, the C-O-C glycosidic stretching vibration, and the C-OH stretching vibrations. TiO2, with its large electron density, was able to participate in chain interactions mostly involving outside helix vibrations i.e. the CH2 deformation, and the C-OH stretching vibrations. Cholesterol with its mostly hydrophobic and medium sized structure was primarily involved in inner helix interactions. Taken together, results suggest a potential for the control of the physico-chemical properties by the careful selection of additives which would influence the number and type of intra- and intermolecular interactions. However, more work is warranted to fully comprehend the behavior of these complex macromolecules.
Acknowledgements
The authors gratefully acknowledge the partial support of the Welch Foundation (V-0004) and fruitful discussions with P. Bernazzani.
Cite this paper
Mostaq Ahammad,T. Thuy Minh Nguyen, (2016) Influence of the Presence of Chemical Additives on the Thermal Properties of Starch. Food and Nutrition Sciences,07,782-796. doi: 10.4236/fns.2016.79079
References
- 1. Jane, J. (1995) Starch Properties, Modifications, and Applications. Journal of Macromolecular Science: Pure and Applied Chemistry, A32, 751-757.
http://dx.doi.org/10.1080/10601329508010286 - 2. Bernazzani, P., Peyyavula, V.K., Agarwal, S. and Tatikonda, R.K. (2008) Evaluation of the Phase Composition of Amylose by FTIR and Isothermal Immersion Heats. Polymer, 49, 4150-4158.
http://dx.doi.org/10.1016/j.polymer.2008.07.022 - 3. Takeda, Y., Tomooka, S. and Hizukuri, S. (1993) Structures of Branched and Linear Molecules of Rice Amylose. Carbohydrate Research, 246, 267-272.
http://dx.doi.org/10.1016/0008-6215(93)84038-8 - 4. Zobel, H.F. (1988) Molecules to Granules: A Comprehensive Starch Review. Starch, 40, 44-50.
http://dx.doi.org/10.1002/star.19880400203 - 5. Buléon, A., Colonna, P., Planchot, V. and Ball, S. (1998) Starch Granules: Structure and Biosynthesis. International Journal of Biological Macromolecules, 23, 85-112.
http://dx.doi.org/10.1016/S0141-8130(98)00040-3 - 6. Tester, R.F., Karkalas, J. and Qi, X. (2004) Starch-Composition, Fine Structure and Architecture. Journal of Cereal Science, 39, 151-165.
http://dx.doi.org/10.1016/j.jcs.2003.12.001 - 7. Wu, H.-S.H. and Sarko, A. (1978) The Double-Helical Molecular Structure of Crystalline A-Amylose. Carbohydrate Research, 61, 27-40.
http://dx.doi.org/10.1016/S0008-6215(00)84464-X - 8. Brady, J.E. (2000) Matter and Its Changes. 3rd Edition, New York, Wiley.
- 9. Kong, L., Lee, C., Kim, S.H. and Ziegler, G.R. (2014) Characterization of Starch Polymorphic Structures Using Vibrational Sum Frequency Generation Spectroscopy. The Journal Physical Chemistry B, 118, 1775-1783.
http://dx.doi.org/10.1021/jp411130n - 10. Imberty, A., Chanzy, H., Peèrez, S., Buleéon, A. and Tran, V. (1988) The Double-Helical Nature of the Crystalline Part of A-Starch. Journal of Molecular Biology, 201, 365-378.
http://dx.doi.org/10.1016/0022-2836(88)90144-1 - 11. Imberty, A. and Perez, S. (2004) A Revisit to the Three-Dimensional Structure of the B-Type Starch. Biopolymers, 27, 1205-1221.
http://dx.doi.org/10.1002/bip.360270803 - 12. Popov, D., Buleéon, A., Burghammer, M., Chanzy, H., Montesanti, N., Putaux, J.L., Potocki-Veronese, G. and Riekel, C. (2009) Crystal Structure of A-Amylose: A Revisit from Synchrotron Microdiffraction Analysis of Single Crystals. Macromolecules, 42, 1167-1174.
http://dx.doi.org/10.1021/ma801789j - 13. Takahashi, Y., Kumano, T. and Nishikawa, S. (2004) Crystal Structure of B-Amylose. Macromolecules, 37, 6827-6832.
http://dx.doi.org/10.1021/ma0490956 - 14. Smith, A.M. (2001) The Biosynthesis of Starch Granules. Biomacromolecules, 2, 335-341.
http://dx.doi.org/10.1021/bm000133c - 15. Bernazzani, P., Chapados, C. and Delmas, G. (2000) Double-Helical Network in Amylose as Seen by Slow Calorimetry and FTIR. Journal of Polymer Science: Part B, Polymer Physics, 38, 1662-1677.
http://dx.doi.org/10.1002/(SICI)1099-0488(20000615)38:12<1662::AID-POLB120>3.0.CO;2-6 - 16. Bluhm, T.L. and Zugenmaier, P. (1981) Detaille Structure of the Vh-Amylose-Iodine Complexe: A Linear Polyiodine Chain. Carbohydrate Research, 89, 1-10.
http://dx.doi.org/10.1016/S0008-6215(00)85224-6 - 17. Godet, M.C., Buleon, A., Tran, V. and Colonna, P. (1993) Structural Features of Fatty Acid-Amylose Complexes. Carbohydrate Polymers, 21, 91-95.
http://dx.doi.org/10.1016/0144-8617(93)90003-M - 18. Rappenecker, G. and Zugenmaier, P. (1981) Detailed Refinement of the Crystal Structure of Vh-Amylose. Carbohydrate Research, 89, 11-19.
http://dx.doi.org/10.1016/S0008-6215(00)85225-8 - 19. Kizil, R. and Irudayaraj, J. (2006) Discrimination of Irradiated Starch Gels Using FT-Raman Spectroscopy and Chemometrics. Journal of Agricultural and Food Chemistry, 54, 13-18.
http://dx.doi.org/10.1021/jf051491f - 20. Tester, R.F., Karkalas, J. and Qi, X. (2004) Starch Structure and Digestibility Enzyme-Substrate Relationship. World’s Poultry Science Journal, 60, 186-195.
http://dx.doi.org/10.1079/WPS20040014 - 21. Singh, N., Sandhu, K.S. and Kaur, M. (2005) Physicochemical Properties including Granular Morphology, Amylose Content, Swelling and Solubility, Thermal and Pasting Properties of Starches from Normal, Waxy, High Amylose and Sugary Corn. Progress in Food Biopolymer Research, 1, 43-54.
- 22. Putaux, J.L., Buleon, A. and Chanzy, H. (2000) Network Formation in Dilute Amylose and Amylopectin Studied by TEM. Macromolecules, 33, 6416-6422.
http://dx.doi.org/10.1021/ma000242j - 23. Kizil, R.J., Irudayaraj, J.K. and Seetharaman, K. (2002) Characterization of Irradiated Starches by Using FT-Raman and FTIR Spectroscopy. Journal of Agricultural and Food Chemistry, 50, 3912-3918.
http://dx.doi.org/10.1021/jf011652p - 24. Delval, F., Grini, G., Bertini, S., Morin-Crini, N., Badot, P.M., Vebrel, J. and Torri, G. (2004) Characterization of Crosslinked Starch Materials with Spectroscopic Techniques. Journal of Applied Polymer Science, 93, 2650-2663.
http://dx.doi.org/10.1002/app.20851 - 25. Dumoulin, Y., Alex, S., Szabo, P., Cartilier, L. and Mateescu, M.A. (1998) Cross-Linked Amylose as Matrix for Drug Controlled Release. X-Ray and FT-IR Structural Analysis. Carbohydrate Polymers, 37, 361-370.
http://dx.doi.org/10.1016/S0144-8617(98)00058-7 - 26. Millan-Testa, C.E., Mendez-Montealvo, M.G., Ottenhof, M.A., Farhat, I.A. and Bello Perez, L.A. (2005) Determination of the Molecular and Structural Characteristics of Okenia, Mango, and Banana Starches. Journal of Agricultural and Food Chemistry, 53, 495-501.
http://dx.doi.org/10.1021/jf048862x