Food and Nutrition Sciences
Vol.5 No.11(2014), Article
ID:46936,10
pages
DOI:10.4236/fns.2014.511114
Chemical Quality Indexes of Mullet (Mugilplatanus) Stored on Ice
Sabrina da Costa Silva Andrade1*, Eliane Teixeira Mársico2, Ronoel Luiz de Oliveira Godoy3, Sidney Pacheco3, Robson Maia Franco2, Sérgio Borges Mano2, Carlos Adam Conte-Junior2
1Graduation Program in Veterinary Hygiene and Technological Process of Products of Animal Origin, Fluminense Federal University, Niterói, Brazil
2Department of Food Technology, UFF, Niterói, Brazil
3Embrapa Food Agroindustry, Rio de Janeiro, Brazil
Email: *sabrina.vet@gmail.com
Copyright © 2014 by authors and Scientific Research Publishing Inc.
This work is licensed under the Creative Commons Attribution International License (CC BY).
http://creativecommons.org/licenses/by/4.0/


Received 20 February 2014; revised 21 March 2014; accepted 1 April 2014
ABSTRACT
The present study was conducted aiming at establishing chemical quality parameters to assess ice stored mullet (0˚C ± 1˚C) through the evaluation of nucleotide (adenosine monophosphate [AMP], inosine [HxR] and hypoxanthine [Hx]) degradation, biogenic amine (histamine [HI], putrescine [PU], cadaverine [CA] and tyramine [TI]) quantification and mesophilic and psychrotrophic bacteria count monitoring. The microbial load of 7 log CFU∙g−1 established as maximum acceptable limit was attained after the 20th day of ice storage. IMP concentration declined during the storage period to levels below the detection limit. HxR content increased only up to time T3 and then declined. Hx level increased during all the storage period. CA and HI content increase was not observed, on the other hand, PU and TI contents significantly increased (p < 0.05) at time T5. We concluded that IMP and Hx concentrations can be adequate parameters to assess mullet quality under the study conditions. HxR proved to be adequate to evaluate the freshness of mullet in the first days of storage while the amines, PU and TI, can be used to assess loss of quality. Mullet obtained in conditions similar to those of the present study and maintained at 0˚C ± 1˚C can be consumed up to the 20th storage day.
Keywords:Quality Parameters, Biogenic Amines, Nucleotides, Hypoxanthine, Mugilidae

1. Introduction
Fish per capita consumption has increased worldwide during the past five decades [1] due to its nutritional quality with desirable content of proteins of high biological value, quick digestibility and content of essential amino acids and poly-unsaturated fatty acids, especially the omega-3 [1] -[3] . However, due to its chemical composition, high water activity, presence of easily oxidized unsaturated fats and pH close to neutrality, this food is highly susceptible to spoilage [2] [4] [5] which justifies the development of species-specific researches to assess the quality of each food matrix.
Fish spoilage process begins with the action of endogenous enzymes from the muscle tissue or enzymatic activity of the viscera. The catabolites formed during this autolytic process, favor bacterial growth [5] , with consequent formation of compounds with undesirable flavors and odors [6] [7] , frequently used to assess fish quality.
The products originated from nucleotide degradation have been used as quality indicators [8] -[13] , because they allow detecting the initial alterations that occur immediately after fish capture. Adenosine triphosphate (ATP) is converted, by dephosphorilation in adenosine diphosphate (ADP) and adenosine monophosphate (AMP), deaminated to inosine monophosphate (IMP) which gives inosine (HxR) and hypoxanthine (Hx) as degradation products [2] [11] . Most of these reactions occur by the action of endogenous enzymes present in the muscle, however, the degradation of IMP to HxR and Hx occurs by the action of both, autolytic and microbial enzymes [2] [5] . Similarly, the characterization and the concentration of biogenic amines have been used as quality parameters [14] -[17] , because these products are present in low levels and its formation is associated with the activity of deterioration bacteria [14] [18] through decarboxylation of precursor amino acids [18] [19] .
In this context, due to the need of establishing reliable parameters for quality assessment and acknowledging the importance of mullet (Mugil platanus) as an alternative fish resource to substitute the traditional resources the capture and yield of which are declining in Brazil, especially in the Rio de Janeiro State [20] , the objective of the present study was to establish chemical parameters to assess the quality of mullet stored on ice (0˚C ± 1˚C) based on nucleotide degradation and concentration of biogenic amines.
2. Materials and Methods
2.1. Samples
A total of 25 mullet specimens with weight ranging from 389.3 to 660.7 grams were acquired, immediately after capture, directly from fishing boats in the Municipality of Maricá (RJ) (22˚57’36.1”S, 42˚41’48.5”W) from May to August, 2012. The mean ambient water temperature was 23˚C ± 1˚C. The capture was performed with the aid of nets in hygienic conditions and avoiding fish stress. The specimens were sacrificed by hypothermia in cold water and ice. Then, the fish were transported to the analysis’ laboratory in expanded polystyrene isothermal boxes with ice within two hours from the moment of the harvest. There, they were individually washed in tap water and packed in plastic containers with ice (0˚C ± 1˚C) with a fish/ice ratio of 1:2. The fish were maintained in these conditions for 24 days, period in which the analyses were performed.
2.2. Bacteriological Analyses
A 25g aliquot sample was collected on alternate days, under sterile conditions and homogenized with 225 mL of 0.1% Saline Peptone Water (SPW) in a Stomacher (SEWARD-Stomacher 80) type homogenizer to prepare a 10-1 solution. Other dilutions were obtained from this one as the results were obtained. The Aerobic Heterotrophic Mesophilic Bacteria Count (AMHBC) and Psychrotrophic Heterotrophic Bacteria Count (APHBC) were carried out by the methodology described by the American Public Health Association [21] based on the inoculation of 1 mL of the dilutions in plates with Standard Count Agar (SCA). The incubation was carried out in an oven at 35˚C - 37˚C for 48 hours for AMHBC and in a refrigerator with temperature controlled at 4˚C ± 1˚C for seven days for APHBC.
2.3. Determination of Nucleotide Degradation Products
Nucleotide extraction was performed according to the methodology used by Andrade et al. [22] . A 50 mg aliquot was daily collected and homogenized with 1 mL of 8% perchloric acid (HClO4), added of 200 µL 6 M potassium hydroxide (KOH) and, after mechanical stirring, centrifuged at 6339 g for 3 minutes. The supernatant was used for compound determination by reverse phase high performance liquid chromatography, according to methodology used by Özogul et al. [23] , with some modifications as described below. A Waters® model Alliance® 2695 chromatograph equipped with a Waters® 2996 photodiode array detector, Ultraviolet absorption (UV) at 254 nm, a C18 precolumn and a BDS Hypersil C18, 2.4 µm, 100 × 4.6 mm Thermo® column in oven at 30˚C was used. The mobile phase was formed by 0.04 M KH2PO4 and 0.06 M K2HPO4, pH 7.0 (A) and acetonitrile (B) and a programmed gradient elution with 1.3 mL∙min−1 flow rate was used. The total time of the chromatographic run was 12 minutes and the analyzed compounds were resolved in 4.5 minutes. After fifteen sample injections the column was flushed in acetonitrile gradient. The adenosine monophosphate (AMP), inosine monophosphate (IMP), inosine (HxR) and hipoxantine (Hx) standards used were from Sigma-Aldrich®.
Based on AMP, IMP, HxR and Hx concentrations, the values Ki [24] , G [25] and H [26] were calculated:


2.4. Quantification of Biogenic Amines Derivatized with 6-Aminoquinolyl-N-Hydroxysuccinimidyl Carbamate (AQC)
Biogenic amine extraction was conducted according to AOAC methodology [27] with some modifications described below. A 1 g aliquot was daily collected from the sample, homogenized with methanol, placed in a water bath at 60˚C for 15 minutes and then the extract was placed in a 10 mL volumetric flask, adjusting the volume with methanol. The biogenic amines were derivatized with 6-aminoquinolyl-N-hydroxysuccinimidyl carbamate (AQC), which is a reagent that forms more stable fluorescent compounds than those commonly used, and quantified by high performance liquid chromatography according methodology proposed by Cohen and Michaud [28] with some modifications. This reagent forms more stable compounds than those commonly used. The Waters® AccQ∙Tag amino acid kit, composed by AQC reagent (Millipore, Milford, MA, EUA) dissolved in acetonitrile and borate buffer solution (200 mM boric acid, 5.0 mM EDTA, pH 8.8) was used. A 50 µL extract aliquot was dried in a desiccator with activated silica gel. The dry extract was dissolved in 20 µL HCl 20 mM solution and 40 µL borate buffer solution, followed by homogenization for 10 and 15 seconds after each reagent addition and derivatized with 20 µL AQC previously prepared. After homogenization the derivatized extract was placed in an oven at 55˚C for 10 minutes and then analyzed by high performance liquid chromatography (Waters® model Alliance® 2695 chromatograph with Waters® 2475 model fluorescence detector, 254 nm excitation wavelength and 395 nm emission wavelength) using a BDS Hypersil C18, 2.4 µm, 100 × 4.6 mm Thermo® column in oven at 37˚C and mobile phase composed by phase A (sodium acetate solution (60 - 140 mM), triethylamine (5 - 20 mM) and phosphoric acid with pH 5.0 - 6.5 (AccQ∙TagTM) from Waters®) and phase B (acetonitrile) with programmed elution gradient (initial = 100%A, 0.5 min = 99%A, 18 min = 95%A, 19 min = 91%A, 29.5 min = 83%A, 35 min = 80%A, 36 min = 78%A, 45 min = 40%A and 48 min = 100%A). The flow rate was 1.0 mL∙min−1 up to 35 minutes of chromatographic run and 1.2 mL∙min−1 over the remaining 15 minutes. The histamine (HI), putrescine (PU), cadaverine (CA) and tyramine (TI) standards were from Sigma-Aldrich®.
2.5. Statistical Analysis
The parameters of bacterial growth (lag phase and generation time) were determined using the DMfit 2.0 computer program based on predictive microbiology and idealized by Baranyi and Roberts [29] .
The correlation between the quality indices based on nucleotide concentration with storage time was assessed by the determination of Pearson’s coefficient (R). Variance analysis (ANOVA) was used to verify the differences of nucleotide and biogenic amine content among storage times. To help result interpretation, the data obtained (from day 0 to day 24) were grouped into five periods of time, according to Rodrigues et al. [17] proposal: Time 1 (T1)—analysis up to the fourth storage day, time 2 (T2)—analysis from the fifth to the ninth storage day, time 3 (T3)—analysis from the tenth to the 14th, time 4 (T4)—analysis from the 15th to the 19th, and time 5 (T5)—analysis from the 20th to the 24th storage days.
All the analyses were performed using the GraphPad Prism version 6.00 for Windows (GraphPad Software, San Diego, California, USA), considering a significance of 5%.
3. Results and Discussion
3.1. Bacteria Count
The means of the Aerobic Mesophilic Heterotrophic Bacteria Count (AMHBC) and Aerobic Psychrotrophic Heterotrophic Bacteria Count (APHBC) are represented in Figure 1. At storage day 0 (the day of mullet capture) the AMHBC mean was 2.2 log CFU∙g−1 and APHBC was 1.9 log CFU∙g−1. The microbial load of 7.0 log CFU∙g−1 established by the international commission of microbiologic specifications for food [30] as maximum acceptable level of mesophilic bacteria in fish was attained after the 20th storage day. These results are different from those obtained with other fish species [22] [31] -[34] , however, the initial microbial load and the storage time of this food matrix can be influenced by the fish species involved, bacterial load and type of bacteria present, which can be related to the contamination of the environment and water temperature where the fish lives, and also to the capture, handling and storing conditions [2] [5] [22] [32] [33] . The data in Table 1 shows that the higher adaptation time needed by the mesophilic bacteria indicates that the refrigeration conditions used in the present study favored the quick adaptation of the psychrotrophic bacteria present in the matrix, as reported in previous studies [22] [35] , as well as the development of this group of bacteria during the storage time as indicated by the smaller generation time of this group of bacteria when compared to mesophilic, which needed 1.6 greater time to multiply than psychrotrophic bacteria. Similar behavior was observed by Ababouch et al. [6] who reported smaller generation time of psychrotrophic bacteria (14.5 hours) than mesophilic bacteria (16.0 hours) in sardine (Sardinapilchardus) samples stored in ice. Zaragozá et al. [34] and Ensani and Jasour [35] also reported greater load of psycrotrophic bacteria compared to mesophilic bacteria inatlantic salmon (Salmosalar) stored at 4˚C and pike-perch (Sander lucioperca) stored on ice and frozen storage, respectively.
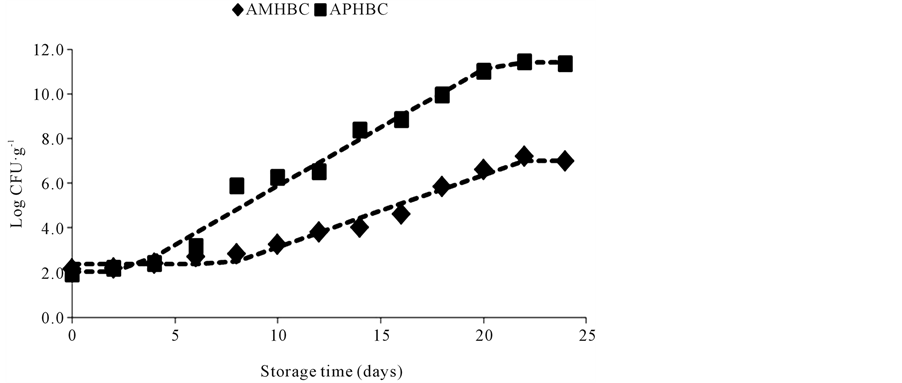
Figure 1. Mean of Aerobic Mesophilic Heterotrophic Bacteria Count (AMHBC) and Aerobic Psychrotrophic Heterotrophic Bacteria Count (APHBC) of mullet (Mugilplatanus) stored at 0˚C ± 1˚C for 24 days.

Table 1. Results of Aerobic Mesophilic Heterotrophic Bacteria Count (AMHBC) and Aerobic Psychrotrophic Heterotrophic Bacteria Count (APHBC) growing parameters in mullet (Mugilplatanus) stored under refrigeration at 0˚C ± 1˚C for 24 days.
Initial count: Bacteria count in log CFU∙g−1; Lag: lag phase in days; g: generation time in hours; Stationary phase count: Bacteria count at the beginning of the stationary phase in log CFU∙g−1.
3.2. Nucleotide Degradation
The content of AMP, IMP, HxR and Hx over the different mullet storage times at 0˚C ± 1˚C obtained by HPLC is represented in Figure 2. The technique employed in this study, through the use of a column with smaller particles (2.4 µm) and addition acetonitrile to mobile phase, allowed the resolution of compounds in less time compared to others studies [36] [37] . AMP content significantly increased (p < 0.05) during storage time, from 0.64 ± 0.09 µmol∙g−1 in time T1 to 0.88 ± 0.20 µmol∙g−1 in time T5. These results differ from those reported by other researchers that observed AMP content decline during storage time of different fish species [10] [38] -[41] . However, nucleotide degradation in fish can follow two different paths: one involving the formation of inosine monophosphate and the other that considers a sequence of dephosphorylations to adenosine. In some species both paths can occur. Other species present prevalence of adenosine formation, with consequent AMP accumulation and absence of IMP [42] . In the present study, IMP was detected only up to time T3, because it showed marked decline during the storage time, from 5.15 ± 1.39 µmol∙g−1 at time T1 to undetectable levels from time T4. The sharp fall of IMP content was also observed in previous studies with different fish species [8] [10] -[12] [43] . IMP is the main responsible for defining the aroma and flavor of fresh fish [2] [5] . Thus, the decline in the concentration of this compound indicates the initial loss of fish quality, in accordance with reports from other authors [8] [9] [12] [13] . HxR content showed marked increase (p < 0.05) only up to time T3, from 2.94 ± 0.65 µmol∙g−1 (T1) to 4.60 ± 0.49 µmol∙g−1 (T3). After this time, the concentration of this compound signficanty attaining 3.25 ± 0.47 µmol∙g−1 at time T5. A similar behavior was observed by other authors in previous studies with different fish species [9] [11] [13] [44] . Hx content at time T1 was 0.51 ± 0.53 µmol∙g−1 and significantly increased during storage time mainly at times T3 (2.17 ± 0.32 µmol∙g−1) and T4 (3.20 ± 0.75 µmol∙g−1). Hx accumulation reflects the initial phase of autolytic spoilage, as well as bacterial spoilage and thus is an important quality parameter for different fish species, as observed in the present study and reported in previous ones [9] [10] [13] [22] . Some fish species accumulate HxR from IMP while others accumulate Hx. There are also species that accumulate both HxR and Hx, however Hx accumulation occurs slower [45] -[47] . HxR is relatively tasteless while Hx has a direct effect on the bitter flavor of spoiled fish [2] [5] . In the present study, HxR mean concentration was higher than that of Hx up to time T4, however from time T3, when IMP was not detected anymore, as HxR content declined, there was a significant increase of Hx content. Thus, in the same way that IMP and HxR decline, Hx accumulation can also be used as a measure of mullet quality loss.
The values Ki, G and H calculated from AMP, IMP, HxR and Hx concentration in mullet samples stored in ice (0˚C ± 1˚C) are represented in Figure 3. These values have been proposed as quality index due the differences that species present in relation to mechanisms of degradation of nucleotides [8] [24] -[26] . Ki value presented good correlation (R = 0.88) with storage time, however, marked increase occurred only up to T3 (T1 ~ 28%, T2 ~ 74% and T3 ~ 97%). From T4, IMP was not detected and consequently Ki value was constant (T4 = T5 ~ 100%). Ki value was suggested by Karube et al. [24] to replace K [48] and does not take into consideration the
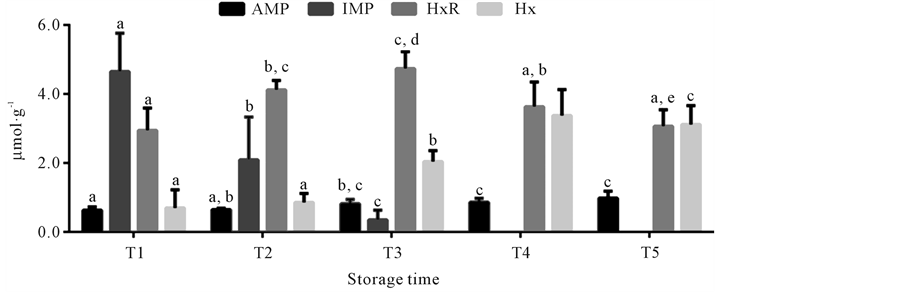
Figure 2. Concentrations of adenosine monophosphate (AMP), inosine monophosphate (IMP), inosine (HxR) and hypoxanthine (Hx) in mullet (Mugilplatanus) kept at 0˚C ± 1˚C for differrent storage times: T1 (0 to 4th storage day), T2 (5th to 9th storage day), T3 (10th to 14th storage day), T4 (15th to 10th and T5 (20th to 24th storage days). Mean concentrations (n = 8). Standard deviations are indicated by bars. Different letters indicates the statistically significant differences of values between storage time (p < 0.05).
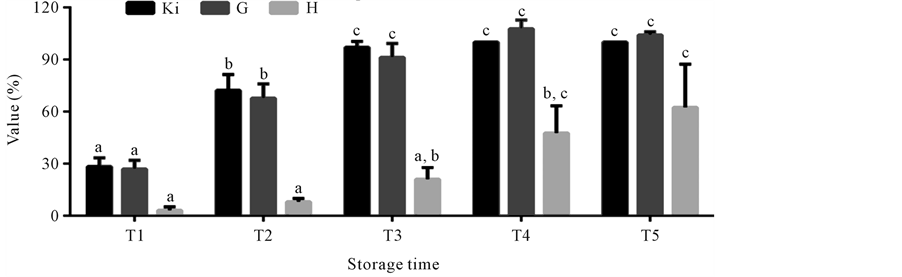
Figure 3. Mean Ki, G and H values in mullet (Mugilplatanus) kept at 0˚C ± 1˚C for different storage times: T1 (0 to 4th storage day), T2 (5th to 9th storage day), T3 (10th to 14th storage day), T4 (15th to 10th and T5 (20th to 24th storage days). Mean concentrations (n = 8). Standard deviations are indicated by bars. Different letters indicates the statistically significant differences of values between storage time (p < 0.05).
intermediary products of ATP degradation to IMP, because in some species this process occurs very fast impairing the identification of those compounds. G value showed high correlation (R = 0.92) with storage time with a significant increase (p < 0.05) during the initial storage times (T1 ~ 26%, T2 ~ 69% and T3 ~ 90%). From T4 its increase was not significant (p > 0.05), reaching at time T5 ~ 104%. G value, according to Burns et al. [25] is based in Hx accumulation and IMP degradation, however the rapid increase observed in both this value and the Ki value during the three initial storage times is due not only to the progressive Hx increase and the rapid degradation of IMP, but also to HxR content gradual increase, as was also observed by other authors [9] [11] . H was the value that presented the best correlation (R = 0.97) with storage time. As this value is based solely on Hx concentration [11] [26] [49] , a significant increase (p < 0.05) was observed only from time T3, when high Hx levels were also detected. In time T1 H value was approximately 3% reaching about 57% in time T5.
3.3. Biogenic Amines
The content of the biogenic amines derivatizated with AQC researched by HPLC in mullet stored on ice (0˚C ± 1˚C) is shown in Figure 4. The use of the AQC as derivatizing reagent allowed of forming stable compounds, as reported in others studies [28] [50] [51] . Histamine content did not significantly increase with storage time, fact related to amino acid substrate. The variation of biogenic amine content in fish may be a function of feeding, sex, physiological stage, tissue (sample aliquot), among other factors [6] [14] [52] , which explains histamine behavior observed during storage of the samples in the present study. In this manner, although histamine was the amine found in the highest concentration in the samples (7.84 to 13.4 mg∙100g−1), it is not adequate for quality assessment of mullet kept under those storage conditions. The presence of this biogenic amine is not necessarily related to fish spoilage, as reported in studies of several fish species [9] [10] [15] [53] . Cadaverine was also considered not adequate for mullet quality assessment, because its concentration was constant during the entire storage period (2.08 to 2.19 mg∙100g−1). However the research theses amines is fish has high importance because the histamine is often associated with allergic poisoning and the cadaverine is able to potentiate the action of histamine and form carcinogenic compounds [18] [19] [54] [55] . Putrescine and tyramine contents were constant until the last storage time (T5), when they increased from 1.01 ± 0.06 mg∙100g−1 and 5.89 ± 0.21 mg∙100g−1 at time T1, to 3.42 ± 1.74 mg∙100g−1 and 8.41 ± 3.44 mg∙100g−1 at time T5, respectively. The significant increase of theses amines just in time T5, corresponded to the day when mullet was microbiologically rejected, because it attained the limit of 7 log∙CFU∙g−1 for mesophilic count in fish under refrigeration [30] , which was the 20th storage day. Thus, the biogenic amines putrescine and tyramine have high potential for being used as quality parameters in the assessment of mullet stored in ice. The potential of these amines as quality indicators was also observed for other fish species, associated to other biogenic amines or individually [14] -[17] [53] .
3. Conclusion
The nucleotides IMP, HxR and Hx and the biogenic amines PU and TI are potential compounds for use as
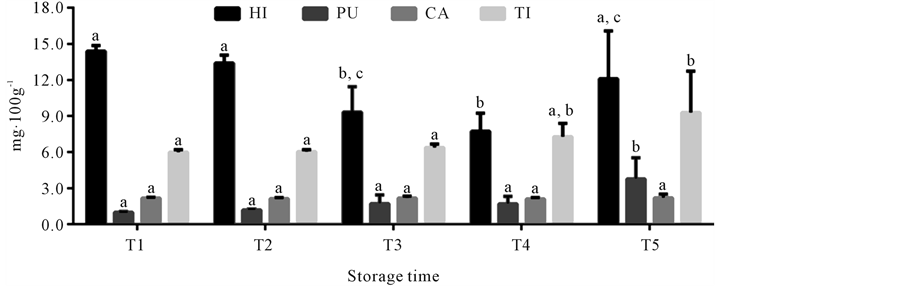
Figure 4. Mean of histamine (HI), putrescine (PU), cadaverine (CA) and tyramine (TI) concentrations in mullet (Mugilplatanus) kept at 0˚C ± 1˚C for different storage times: T1 (0 to 4th storage day), T2 (5th to 9th storage day), T3 (10th to 14th storage day), T4 (15th to 10th and T5 (20th to 24th storage days). Mean concentrations (n = 8). Standard deviations are indicated by bars. Different letters indicates the statistically significant differences of values between storage time (p < 0.05).
chemical parameters to assess the quality of mullet stored at 0˚C ± 1˚C. The IMP and Hx showed high correlation with quality loss of mullet, as well as the PU and TI, while HxR proved to be adequate to evaluate mullet freshness during the first days of storage. The results obtained show that mullet can be consumed up to the 20th storage day, when obtained in similar conditions as in the present study and kept at the same storage conditions (0˚C ± 1˚C).
Acknowledgements
The authors are grateful for the financial support from the Carlos Chagas Filho Research Support Foundation of the State of Rio de Janeiro (FAPERJ), processes numbers E-26/112.620/2012 and E-26/112.620/2012. S.C.S. Andrade was supported by the Coordination for the Improvement of Higher Education (CAPES).
References
- Food and Agriculture Organization (FAO) (2012) El Estado Mundial de la Pesca y laAcuicultura 2012. Roma.
- Huss, H.H. (1999) El Pescado Fresco: Su Calidad y Cambios de su Calidad. Dinamarca.
- Visentainer, J.V., Carvalho, P.O., Ikegaki, M. and Park, Y.K. (2000) Concentracao de ácido eicosapentaenóico (EPA) e ácido docosahexaenóico (DHA) em peixes marinhos da costa brasileira. Ciência e Tecnologia de Alimentos, 20, 90-93. http://dx.doi.org/10.1590/S0101-20612000000100017
- Ashie, I.N.A., Smith, J.P. and Simpson, B.K. (1996) Spoilage and Shelf-Life Extension of Fresh Fish and Shellfish. Critical Reviews in Food Science and Nutrition, 36, 87-121. http://dx.doi.org/10.1080/10408399609527720
- Gram, L. and Huss, H.H. (1996) Microbiological Spoilage of Fish and Fish Products. International Journal of Food Microbiology, 33, 121-137. http://dx.doi.org/10.1016/0168-1605(96)01134-8
- Ababouch, L.H., Souibri, L., Rhaliby, K., Ouahdi, O., Battal, M. and Busba, F.F. (1996) Quality Changes in Sardines (Sardinapilchardus) Stored in Ice and at Ambient Temperature. Food Microbiology, 13, 123-132. http://dx.doi.org/10.1006/fmic.1996.0016
- Gram, L. and Dalgaard, P. (2002) Fish Spoilage Bacteria—Problems and Solutions. Current Opinion in Biotechnology, 13, 262-266. http://dx.doi.org/10.1016/S0958-1669(02)00309-9
- Aubourg, S.P., Quitral, V., Larraín, M.A., Rodríguez, A., Gómez, J., Maier, L. and Vinagre, J. (2007) Autolytic Degradation and Microbiological Activity in Farmed Coho Salmon (Oncorhynchuskisutch) during Chilled Storage. Food Chemistry, 104, 369-375. http://dx.doi.org/10.1016/j.foodchem.2006.11.066
- ?zogul, F., ?zogul, Y. and Kuley, E. (2008) Nucleotide Degradation and Biogenic Amine Formation of Wild White Grouper (Epinephelusaeneus) Stored in Ice and at Chill Temperature (4℃). Food Chemistry, 108, 933-941. http://dx.doi.org/10.1016/j.foodchem.2007.11.070�
- Özogul, Y., Boga, E.K., Tokur, B. and Özogul, F. (2011) Changes in Biochemical, Sensory and Microbiological Quality Indices of Common Sole (Soleasolea) from the Mediterranean Sea, during Ice Storage. Turkish Journal of Fisheries and Aquatic Sciences, 11, 243-251. http://dx.doi.org/10.4194/trjfas.2011.0209
- Song, Y., Luo, Y., You, J., Shen, H. and Hu, S. (2012) Biochemical, Sensory and Microbiological Attributes of Bream (Megalobramaamblycephala) during Partial Freezing and Chilled Storage. Journal of the Science of Food and Agriculture, 92, 197-202. http://dx.doi.org/10.1002/jsfa.4572
- Li, T., Li, J. and Hu, W. (2013) Changes in Microbiological, Physicochemical and Muscle Proteins of Post Mortem Large Yellow Croaker (Pseudosciaenacrocea). Food Control, 34, 514-520. http://dx.doi.org/10.1016/j.foodcont.2013.05.028
- Rzepka, M., ?zogul, F., Surówka, K. and Michalczyk, M. (2013) Freshness and Quality Attributes of Cold Stored Atlantic Bonito (Sardasarda) Gravad. International Journal of Food Science and Technology, 48, 1318-1326. http://dx.doi.org/10.1111/ijfs.12094�
- Veciana-Nogués, M.C., Mariné-Font, A. and Vidal-Carou, M.C. (1997) Biogenic Amines as Hygienic Quality Indicators of Tuna. Relationship with Microbial Counts, ATP-Related Compounds Volatile Amines and Organoleptic Changes. Journal of Agricultural and Food Chemistry, 45, 2036-2041. http://dx.doi.org/10.1021/jf960911l
- K?í?ek, M., Pavlí?ek, T. and Vácha, F. (2002) Formation of Selected Biogenic Amines in Carp Meat. Journal Science of Food and Agriculture, 82, 1088-1093. http://dx.doi.org/10.1002/jsfa.1154�
- Rezaei, M., Montazeri, N., Langrudi, H.E., Mokhayer, B., Parviz, M. and Nazarinia, A. (2007) The Biogenic Amines and Bacterial Changes of Farmed Rainbow Trout (Oncorhynchus mykiss) Stored in Ice. Food Chemistry, 103, 150-154. http://dx.doi.org/10.1016/j.foodchem.2006.05.066
- Rodrigues, B.L., álvares, T.S., Costa, M.P., Sampaio, G.S.L., La Torre, C.A., Mársico, E.T. and Conte Junior, C.A. (2013) Concentration of Biogenic Amines in Rainbow Trout (Oncorhynchus mykiss) Preserved in Ice and Its Relationship with Physicochemical Parameters of Quality. Journal of Aquaculture Research & Development, 4, 1-4. http://dx.doi.org/10.4172/2155-9546.1000174
- Rodriguez, M.B.R., Carneiro, C.S., Feijó, M.B.S., Conte Júnior, C.A. and Mano, S.B. (2014) Bioactive Amines: Aspects of Quality and Safety in Food. Food and Nutrition Sciences, 5, 138-146.
- Sillas Santos, M.H. (1996) Biogenic Amines: Their Importance in Foods. International Journal of Food Microbiology, 29, 213-231. http://dx.doi.org/10.1016/0168-1605(95)00032-1
- Miranda, L.V. and Carneiro, M.H. (2007) A pesca da tainha Mugilplatanus (Perciformes: Mugilidae) desembarcada no Estado de Sao Paulo—Subsídio ao ordenamento. Série Relatórios Técnicos, 30, 1-13.
- American Public Health Association (APHA) (2001) Compendium of Methods for the Microbiological Examination of Foods. Washington DC.
- Andrade, S.C.S., Mársico, E.T., Franco, R.M., Godoy, R.L.O., Pacheco, S., Queiroz, M.F. and Guimaraes, C.F.M. (2012) Validade comercial de sardinhas inteiras e refrigeradas avaliada por análises físico-químicas, bacteriológicas e sensorial. Ciência Rural, 42, 1901-1907. http://dx.doi.org/10.1590/S0103-84782012005000077
- Özogul, F., Taylor, K.D.A., Quantck, P.C. and Özogul, Y. (2000) A Rapid HPLC-Determination of ATP-Related Compounds and Its Application to Herring Stored under Modified Atmosphere. International Journal of Food Science and Technology, 35, 549-554. http://dx.doi.org/10.1111/j.1365-2621.2000.00405.x
- Karube, I., Matsuoka, H., Suzuki, S., Watanabe, E. and Toyama, K. (1984) Determination of Fish Freshness with an Enzyme Sensor System. Journal of Agriculture and Food Chemistry, 32, 314-319. http://dx.doi.org/10.1021/jf00122a034
- Burns, B.G., Ke, P.J. and Irvine, B.B. (1985) Objective Procedure for Fish Freshness Evaluation Based on Nucleotide Changes Using a HPLC System. Canadian Technical Report of Fisheries and Aquatic Sciences, No. 1373.
- Luong, J.H.T., Male, K.B., Masson, C. and Nguyen, A.L. (1992) Hypoxanthine Ratio Determination in Fish Extract Using Capillary Electrophoresis and Immobilized Enzymes. Journal of Food Science, 57, 77-81. http://dx.doi.org/10.1111/j.1365-2621.1992.tb05429.x
- Association of Analytical Communities (AOAC) (2002) Official Methods of Analysis. Association of Official Analytical Chemists, Arlington.
- Cohen, S.A. and Michaud, D.P. (1993) Synthesis of a Fluorescent Derivatizing Reagent, 6-Aminoquinolyl-N-Hydroxysuccinimidyl Carbamate, and Its Application for the Analysis of Hydrolysate Amino Acids via High-Performance Liquid Chromatography. Analytical Biochemistry, 211, 279-287. http://dx.doi.org/10.1006/abio.1993.1270
- Barany, J. and Roberts, T.A. (1994) A Dynamic Approach to Predicting Bacterial Growth in Food. International Journal of Food Microbiology, 23, 277-294. http://dx.doi.org/10.1016/0168-1605(94)90157-0
- International Comission on Microbiological Specifications for Food (ICMSF) (1986) Microorganisms in Foods. 2. Sampling for Microbiological Analysis: Principles and Specific Applications. University of Toronto Press, Toronto.
- Erkan, N. and Özden, Ö. (2008) Quality Assessment of Whole and Gutted Sardines (Sardina pilchardus) Stored in Ice. International Journal of Food Science and Technology, 43, 1549-1559. http://dx.doi.org/10.1111/j.1365-2621.2007.01579.x
- Chong, C.Y., Bakar, F.A., Rahman, R.A., Bakar, J. and Zaman, M.Z. (2012) Biogenic Amine, Amino Acids and Microflora Changes in Indian Mackerel (Rastrellinger kanagurta) Stored at Ambient (25℃ - 29℃) and Ice Temperature (0℃). Journal of Food Science and Technology. http://dx.doi.org/10.1007/s13197-012-0621-3
- Carracosa, C., Millán, R., Saavedra, P., Jaber, J.R., Montenegro, T., Raposo, A., Pérez, E. and Sanjuán, E. (2014) Predictive Models for Bacterial Growth in Sea Bass (Dicentrarchus labrax) Stored in Ice. International Journal of Food Science and Technology, 49, 354-363. http://dx.doi.org/10.1111/ijfs.12307
- Zaragozá, P., Fernández-Segovia, I., Fuentes, A., Vivancos, J.L., Ros-Lis, J.V., Barat, J.M. and Martínez-Mánez, R. (2014) Monitorization of Atlantic Salmon (Salmo salar) Spoilage Using an Optoelectronic Nose. Sensors and Actuators B, 195, 478-485. http://dx.doi.org/10.1016/j.snb.2014.01.017
- Ehsani, A. and Jasour, M.S. (2012) Microbiological Properties and Biogenic Amines of Whole Pike-Perch (Sander Lucioperca, Linnaeus 1758): A Perspective on Fish Safety during Postharvest Handling Practices and Frozen Storage. Journal of Food Science, 77, M664-M668.
- Siripatrawan, U., Sanguandeekul, R. and Narakaew, V. (2009) An Alternative Freshness Index Method for Modified Atmosphere Packaged Abalone Using an Artificial Neural Network. Food Science and Technology, 42, 343-349. http://dx.doi.org/10.1016/j.lwt.2008.06.008
- Özogul, Y., Boga, E.K., Tokur, B. and Özogul, F. (2011) Changes in Biochemical, Sensory and Microbiological Quality Indices of Common Sole (Solea solea) from the Mediterranean Sea, during Ice Storage. Turkish Journal of Fisheries and Aquatic Sciences, 11, 243-251. http://dx.doi.org/10.4194/trjfas.2011.0209
- Massa, A.E., Palacios, D.L., Paredi, M.E. and Crupkin, M. (2005) Postmortem Changes in Quality Indices of Ice-Stored Flounder (Paralichthys patagonicus). Journal of Food Biochemistry, 29, 570-590. http://dx.doi.org/10.1111/j.1745-4514.2005.00050.x
- Özogul, F., Özogul, Y. and Kuley, E. (2007) Nucleotide Degradation in Sardine (Sardina pilchardus) Stored in Different Storage Condition at 4℃. Journal of Fisheries Sciences, 1, 13-19. http://dx.doi.org/10.3153/jfscom.2007002
- Ocano-Higuera, V.M., Marquez-Ríos, E., Canizales-Dávila, M., Castillo-Yánez, F.J., Pacheco-Aguilar, R., Lugo-Sánchez, M.E., García-Orozco, K.D. and Graciano-Verdugo, A.Z. (2009) Postmortem Changes in Cazon Fish Muscle Stored on Ice. Food Chemistry, 116, 933-938. http://dx.doi.org/10.1016/j.foodchem.2009.03.049
- Li, T., Li, J. and Hu, W. (2013) Changes in Microbiological, Physicochemical and Muscle Proteins of Post Mortem Large Yellow Croaker (Pseudosciaena crocea). Food Control, 34, 514-520. http://dx.doi.org/10.1016/j.foodcont.2013.05.028
- Contreras-Guzmán, E.S. (1994) Bioquímica de pescado e derivados. FUNEP, Jaboticabal.
- Lakshmanan, P.T., Antony, P.D. and Gopakumar, K. (1996) Nucleotide Degradation and Quality Changes in Mullet (Liza corsula) and Pearlspot (Etroplus suratensis) in Ice and at Ambient Temperatures. Food Control, 7, 277-283. http://dx.doi.org/10.1016/S0956-7135(96)00015-1
- Özogul, Y. and Özogul, F. (2002) Degradation Products of Adenine Nucleotide in Rainbow Trout (Oncorhynchus mykiss) Stored in Ice and in Modified Atmosphere Packaging. Turkish Journal of Zoology, 26, 127-130.
- Ehira, S. and Uchiyama, H. (1973) Formation of Inosine and Hypoxanthine in Fish during Storage in Ice. Bulletin of Tokai Regional Fisheries Research Laboratory, 75, 63-73.
- Ehira, S. and Uchiyama, H. (1987) Determination of Freshness Using the K Value and Comments on Some Other Biochemical Changes in Relation to Freshness. In: Kramer, D.E. and Liston, J., Eds., Seafood Quality Determination, Elsevier Science Publishers B. V., Amsterdam, 185-207.
- Izquierdo-Pulido, M.L., Hatae, K. and Haard, N.F. (1992) Nucleotide Catabolism and Changes in Texture Indices during Ice Storage of Cultured Sturgeon (Acipenser transmontanus). Journal of Food Biochemistry, 16, 173-192. http://dx.doi.org/10.1111/j.1745-4514.1992.tb00444.x
- Saito, T., Aarai, K. and Matsuyoshi, M. (1959) A New Method for Estimating the Freshness of Fish. Bulletin of the Japanese Society of Scientific, 24, 749-750. http://dx.doi.org/10.2331/suisan.24.749
- Özogul, F., Gokbulut, C., Özogul, Y. and Özyurt, G. (2006) Biogenic Amine Production and Nucleotide Ratios in Gutted Wild Sea Bass (Dicentrarchus labrax) Stored in Ice, Wrapped in Aluminium Foil and Wrapped in Cling Film at 4℃. Food Chemistry, 98, 76-84. http://dx.doi.org/10.1016/j.foodchem.2005.04.037
- Fiechter, G., Sivec, G. and Mayer, H.K. (2013) Application of UHPLC for Simultaneous Analysis of Free Amino Acids and Biogenic Amines in Ripened Acid-Curd Cheeses. Journal of Chromatography B, 927, 191-200. http://dx.doi.org/10.1016/j.jchromb.2012.12.006
- Ordónez, J.L., Callejón, R.M., Morales, M.L. and García-Parrilla, M.C. (2013) A Survey of Biogenic Amines in Vinegars. Food Chemistry, 141, 2713-2719. http://dx.doi.org/10.1016/j.foodchem.2013.05.087
- Lee, Y., Kung, H., Lin, C., Hwang, C., Lin, C. and Tsai, Y. (2012) Histamine Production by Enterobacter aerogenes in Tuna Dumpling Stuffing at Various Storage Temperatures. Food Chemistry, 131, 405-412. http://dx.doi.org/10.1016/j.foodchem.2011.08.072
- Hu, Y., Huang, Z., Li, J. and Yang, H. (2012) Concentrations of Biogenic Amines in Fish, Squid and Octopus and Their Changes during Storage. Food Chemistry, 135, 2604-2611. http://dx.doi.org/10.1016/j.foodchem.2012.06.121
- Lehane, L. and Olley, J. (2000) Histamine Fish Poisoning Revisited. International Journal of Food Microbiology, 58, 1-37. http://dx.doi.org/10.1016/S0168-1605(00)00296-8
- Silva, S.C., Fernandez, S.Y., Fonseca, M.J., Mársico, E.T. and Sao Clemente, S.C. (2011) Aminas Biogênicas nos Alimentos: Revisao de literatura. Higiene Alimentar, 25, 45-50.
NOTES

*Corresponding author.