Food and Nutrition Sciences
Vol. 2 No. 9 (2011) , Article ID: 8377 , 10 pages DOI:10.4236/fns.2011.29131
Approximate Compositional Values and Tissue Fatty Acid Profiles of Nile Tilapia (Oreochromis niloticus L.) Fed Azolla-Diets in Earthen Ponds*
![]()
1Research Unit on Wetlands, Department de Zoology and Genetic, Faculty of Sciences and Technics, University of AbomeyCalavi, Abomey-Calavi, Republic of Benin; 2Unit of Zootechny, Gembloux Agro-BioTech, University of Liège, Gembloux, Belgium; 3Research Unit in Environmental and Evolutionary Biology, FUNDP-University of Namur, Namur, Belgium.
Email: #y_abou@yahoo.com
Received August 24th, 2011; revised September 26th, 2011; accepted October 9th, 2011.
Keywords: Azolla filiculoides, fish meal replacement, Oreochromis niloticus, fatty acid, natural food, earthen pond
ABSTRACT
The approximate general composition and the fatty acid profile of Nile tilapia fed Azolla-diets in ponds were studied for 90 days. Six isonitrogenous (29.2% CP) and isoenergetic (16.9 kJ·g−1) diets were formulated to contain 0% (A0), 10% (A10), 20% (A20), 30% (A30), 40% (A40) and 50% (A50) of Azolla meal (AM), as partial fish meal (FM) substitutes. Diet A0 without AM served as a control. Fish growth decreased as AM level exceeded 20% in diets (P < 0.05). Dry matter and crude protein showed no significant differences (P > 0.05). Crude lipid was significantly lower in fish fed A50 and significant differences were also found in crude ash (P < 0.05). Linolenic acid (LLA) decreased significantly when AM level in diets increased (P < 0.05). In contrast, arachidonic acid (ARA), eicosapentaenoic acid (EPA) and docosahexaenoic acid (DHA) showed significantly higher values in fish fed high AM (P < 0.05). The n − 3/n − 6 ratio ranged from 0.35 to 0.49, with values being significantly higher in fish fed A20, A30 and A50. High level of the fern reduces growth without negatively affecting fatty acid in fish. Fish PUFA, especially the (n − 3) fatty acids, are affected positively, even when fed 50% AM, which is good for the quality of the fish produced in regard to the benefits for the health of consumers.
1. Introduction
Aquaculture productions continue to increase, as a challenge to meet the ever-increasing demand for fish products worldwide. However, aquaculture enterprises are faced with the need to resolve the problem of increasing demand for fish meal (FM). Indeed, according to IFFO [1], global production of FM has stabilized at 6 to 7 million tonnes since 1985. Consequently, the prices has rising, driving research in the feed industry towards finding substitutes [2]. Azolla, a small floating freshwater fern that has been successfully used recently in fish farming [3-7] appears a good candidate. So far, research on Azolla in fish farming has strongly focused on its effects on growth performance and digestibility. No research on the nutritional quality of the fish produced is available, especially regarding fatty acid composition. Yet, there are concerns that high replacement of FM could adversely affect the marketability of the fish, because of consumer perception of altered taste or reduced health benefits due to lowered (n − 3) fatty acids content [8,9]. Indeed, the consumption of fish containing an adequate level of highly unsaturated (n − 3) fatty acids (n − 3 HUFAs) is favourable for human health [10,11], as these fatty acids series is believed to reduce the occurence of heart diseases, strokes and various inflammatory injuries as well as to improve neurological function in newborn infants [12,13]. Many studies have been carried out to evaluate the effects of non-conventional ingredients used in diets as FM substitutes on fish fatty acid composition [13-15]. Findings have confirmed that body fatty acid composition to a large extent mirrors the dietary fatty acids composition [13,15]. However, biochemical observations show that live organisms, especially copepods and rotifers have a more suitable fatty acid pattern for aquaculture purposes, due to their high content in EPA and DHA [16,17], which must not be negligible in tilapia pond aquaculture.
As part of investigations examining the suitability of AM to replace FM in diets for Nile tilapia O. niloticus, the main objective of this study was to analyse proximate composition and whole body fatty acids profile in response to feeding this fish with gradual levels of Azolla in stagnant earthen ponds.
2. Material and Methods
2.1. Ponds, Fish and Feeding Regimes
The experiment was carried out for 90 days in a rural site (6˚29'15.12''N 2˚37'6.42''E, 13 m above the mean sea level) at Louho, a village located in Porto-Novo suburb, Benin (West Africa). In that site, eighteen small ponds of 30 m2 (10 m × 3 m × 1 m, each) were constructed for the experiment. They were filled naturally from the water table. Fingerlings Nile tilapia of homogeneous size and age (initial body weight: 16.3 ± 0.1 g) were obtained from Lassissi fish farming center in Porto-Novo, Benin. They were stocked at a density of 2 fish m–2 (60 fish pond−1) to limit the influence of natural food in pond. The ponds were randomly assigned to 6 triplicate (6 × 3) groups, each set attributed one of the experimental diets. Diets were isonitrogenous (29.2% crude protein) and isoenergetic (16.9 kJ·g−1), formulated using locally available ingredients and the freshwater fern Azolla filiculoides Lamarck. They were formulated to contain 0% (A0), 10% (A10), 20% (A20), 30% (A30), 40% (A40) and 50% (A50) of AM. The Azolla-diets were compared with a control diet (A0) without AM. Formulation and proximate composition of experimental diets are given in Table 1. Experimental diets were prepared according to the procedure described in Abou et al. [6]. After sundrying at 32˚C - 35˚C, the diet was broken into small particles (mm) and preserved in refrigerator (+4˚C) until used for feeding fish.
Fish were fed every day according to Melard [18]. Daily rations were divided into two parts, each hand-
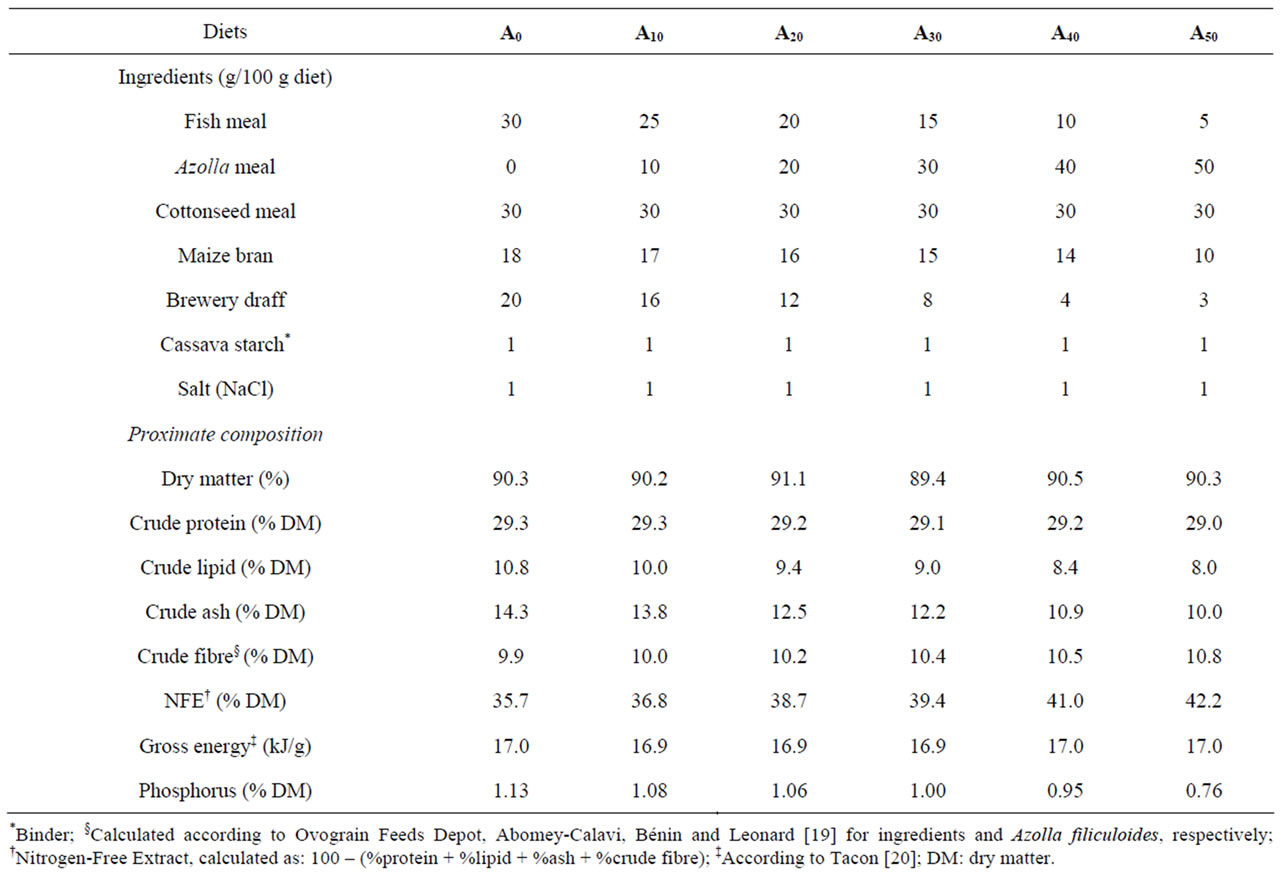
Table 1. Formulation and proximate composition of experimental diets used for feeding Nile tilapia in concrete tanks for 90 days.
distributed at 8:00 h and 16:00 h, respectively. Once every fortnight, fish in stock were sampled with a handling square-net, without entering the pond, and weighed. The daily ration was adjusted according to the actual body weight, and used for the next fortnight.
2.2. Biochemical Analysis
At the beginning of the experiment, thirty fish from the initial batch and six fish per pond at the end were randomly taken and mashed using a Robot coupe food processor. Subsamples were taken and stored at −20˚C for carcass analysis. Whole fish were mashed and whole body crude lipid was determined according to Folch et al. [21].
The diets used were reduced in meal and preserved at −20˚C for biochemical analysis. They were analyzed for dry matter [22], crude protein (Nitrogen × 6.25, Kjeldahl method), crude lipid [21] and crude ash content (incineration for 24 h at 550˚C in a muffle furnace).
Amino acid composition was determined by ionexchange chromatography using a Waters HPLC (Waters, Milford, MA, USA), column AccQ-Tag 3.9 × 150, following hydrolysis of samples with 6 M HCl at 110˚C under an atmosphere of N2 for 18 h. Fatty methyl esters were prepared after transesterification with anhydrous methanol containing 1% sulphuric acid and 0.01% (w/v) butylated hydroxytoluene (BHT) for 16 h at 50˚C [23].
They were separated and quantified by gas chromatography (GC Trace, 2000, Thermo Quest, Carlo Erba, Italy), using a 30 m × 0.32 mm capillary column (FAMEWaxTM, USA).
2.3. Statistical Analysis
Means for growth, proximate composition, and fish body fatty acids were analyzed using one-way Anova, after verifying the homogeneity of their variance [24]. Values for percentage data and ratios were log-transformed prior to analyses. When the effect was significant, comparisons between treatment means was run using Duncan’s multiple range test [25] at P = 0.05. All analysis were done using SPSS program version 17.0 (SPSS, Chicago, Illinois, USA).
3. Results
3.1. Amino Acid of Azolla and Diets, and Fatty Acid Composition of Ingredients and Diets
Essential amino acids (EAA) of Azolla filiculoides and experimental diets are presented in Table 2. Compared to the requirements of tilapias [26], A. filiculoides is poor in methionine. This amino acid is also deficient in diets A30, A40 and A50. The levels of the other EAA in Azolla as in different experimental diets meet the requirements for tilapia [26]. The percentages of fatty acids in A. filiculoides, in the different feedstuffs and in experimental diets are presented in Tables 3 and 4. The most abundant fatty acids found in A. filiculoides were palmitic acid (16:0), oleic acid (18:1n − 9) and LA (18:2n − 6). All experimental diets showed similar percentages for palmitic acid (27.3% - 29.3%), stearic acid 18:0 (10.1% - 12.4%) and oleic acid (16.4 - 20.4%). Percentages of 14:0 (2.22% - 6.92%), 16:1n − 7 (1.95% - 4.42%), 18:3n − 3 (0.96% - 2.40%), 20:5n − 3 (0.61% - 1.52%), 22:5n − 3
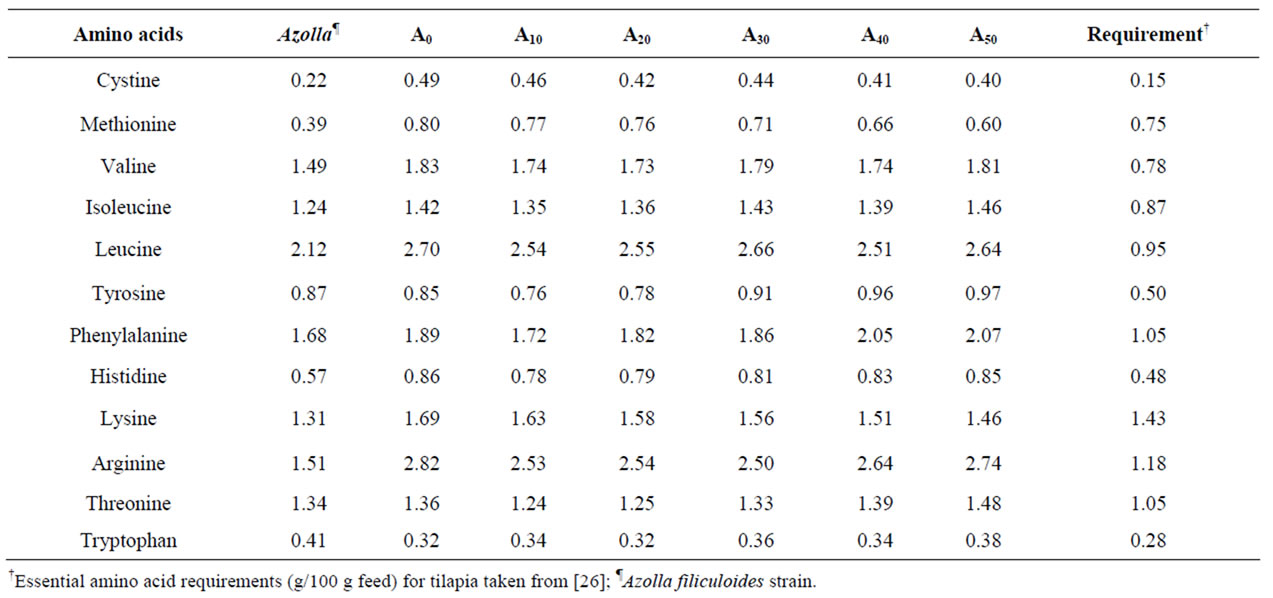
Table 2. Essential amino acid (EAA) composition (g/100 g feed) of Azolla filiculoides and experimental diets.
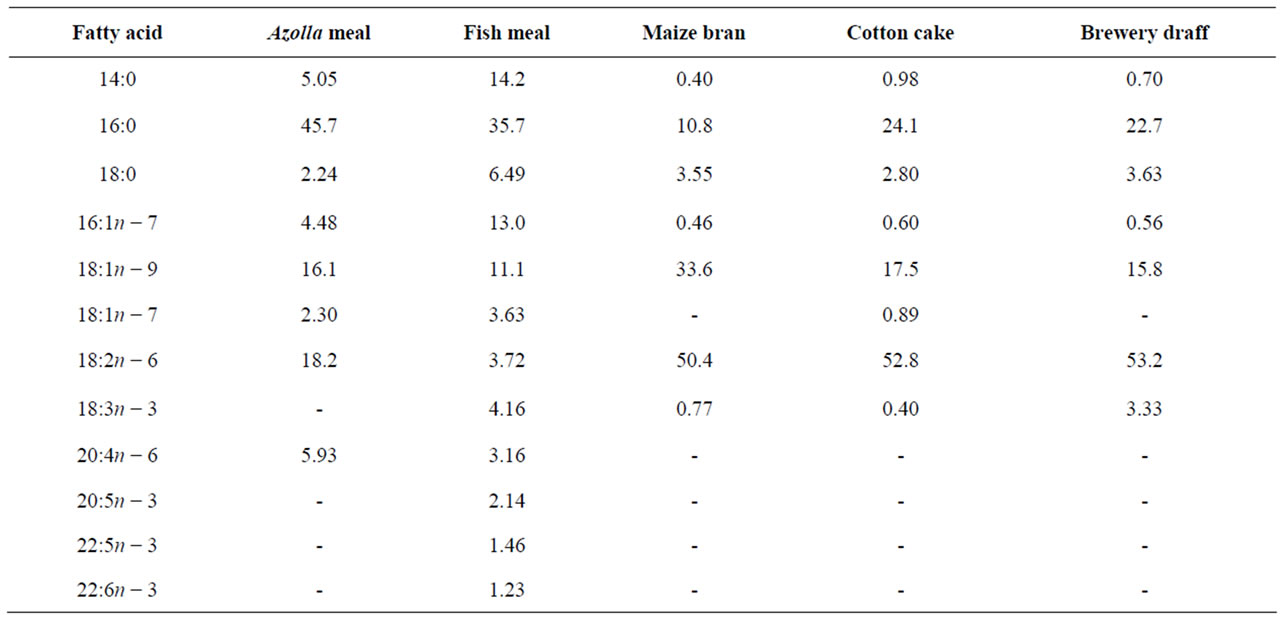
Table 3. Fatty acid composition (% total fatty acids) of Azolla filiculoides and ingredients used in the experimental diets.
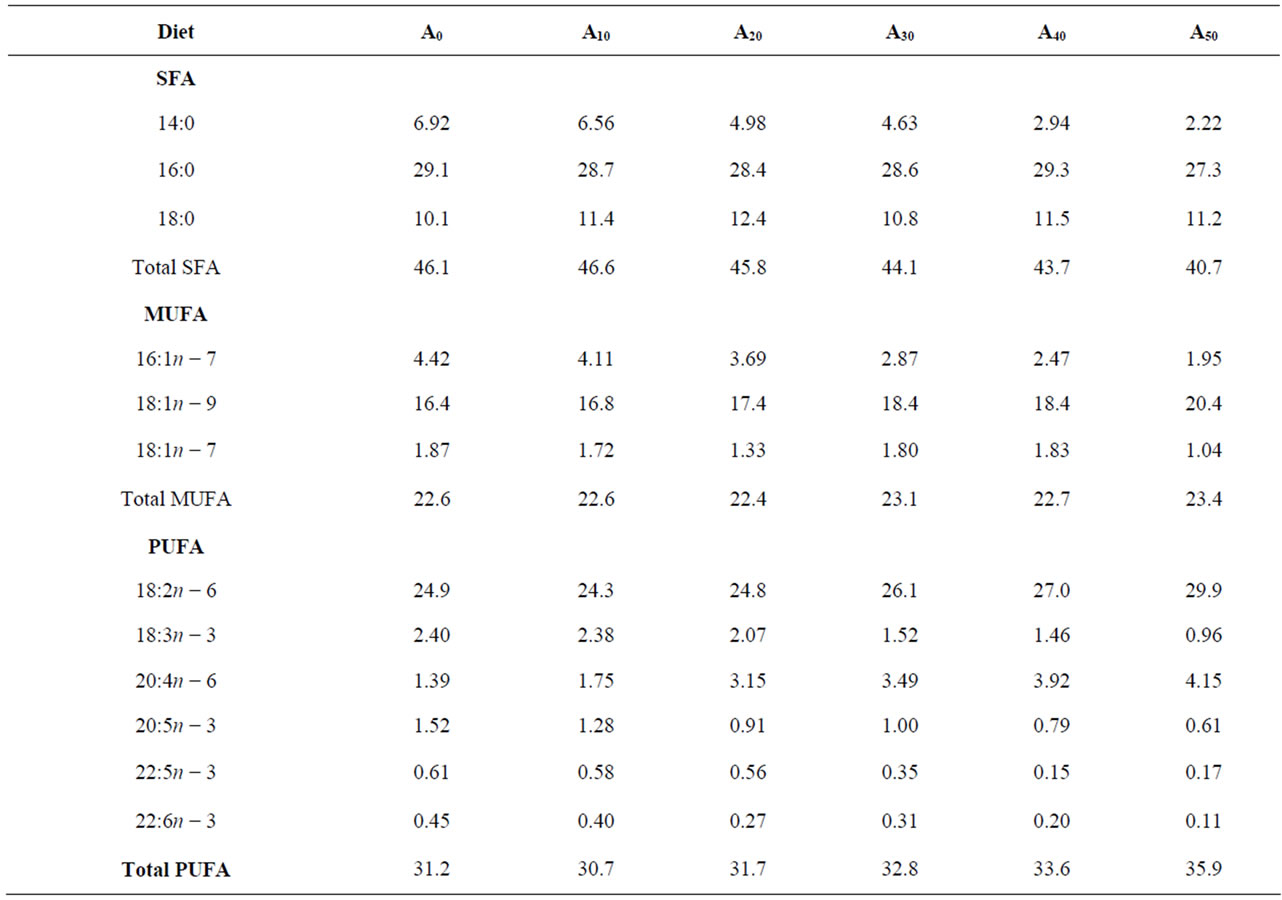
Table 4. Percentages of fatty acids (% of total fatty acids) in diets containing gradual level of Azolla fed to Nile tilapia reared in ponds.
(0.15% - 0.61%) and 22:6n − 3 (0.11% - 0.45%) decrease with decreasing FM in diets, whereas LA (18:2n − 6) and ARA (20:4n − 6) levels tend to increase with increasing AM.
3.2. Body Composition and Fatty Acid in Experimental Fish
Data on fish body composition at the beginning and at the end of the experiment are presented in Table 5. Moisture and crude protein were not significantly different among all the experimental diets (P > 0.05). Carcass lipid content was significantly lower at high AM level (A50). Significant variations were found in crude ash (P < 0.05).
Fatty acids in the whole body of experimental fish are presented in Table 6. In general, fatty acids found in high concentration in the diets were also the most abundant in fish. 16:0, 18:1n − 9 and 18:2n − 6 were the most abundant fatty acids in the diets and in fish. Levels of these fatty acids in fish ranged from 26.9% ± 1.1% to 29.1% ± 0.1% for 16:0, 15.0% ± 1.3% to 18.9% ± 0.9% for 18:1n − 9 and 18.2% ± 0.7% to 20.9% ± 1.2% for 18:2n − 6. Myristic acid (14:0) level decreased significantly as AM proportion increased in diets (P < 0.05). The same trend of variation was found for palmitoleic acid (16:1n − 7) and vaccenic acid (18:1n − 7), with values decreasing from 4.49% ± 0.22% to 1.99% ± 0.42% for 16:1n − 7 and from 3.88% ± 0.12% to 2.62% ± 0.73% for 18:1n − 7.
Fish fed A0 to A20 are rich in 14:0, 16:1n − 7, 18:1n − 7, 18:1n − 9 and 18:3n − 3 fatty acids (P < 0.05). Opposite of this group, fish fed A30 to A50 showed higher percentages in 18:0, arachidonic acid (ARA, 20:4n − 6), eicosapentaenoic acid (EPA, 20:5n − 3) and docosahexaenoic acid (DHA, 22:6n − 3). EPA and DHA levels in those last fish showed a markedly higher concentration compared to their level in the diets provided. This leads to a significantly higher concentration of total PUFAs in fish fed AM-diets, mainly in (n − 3) and (n − 6) fatty acids. As a consequence, significant differences were found in the resulting  ratios.
Identical values were obtained in fish fed A20, A30 and A50, which were higher to the values recorded in fish fed A0, A10 and A40 (P < 0.05).
4. Discussion
The results of the present study did not demonstrate any significant difference among fish fed AM-free diet (A0) and those fed either 10% (A10) or 20% (A20) of AM in their diets, in terms of final mean weight and SGR. These trends in growth variation were similar to those reported with other terrestrial and aquatic plants, as substitutes for FM. As in this study, El-Sayed [27], Fasakin et al. [28] and Fasakin et al. [4] reported reduced growth of Nile tilapia when Azolla pinnata R. Brown., Duckweed (Spirodela polyrrhiza L.) and Azolla africana Desv. were used, respectively. According to several studies, factors that limit the use of macrophytes in fish diets are their content of antinutrient factors, or a deficiency in aminoacids and phosphorus. Dato-Cajegas [29] pointed out phosphorus as the major mineral that limits Nile tilapia
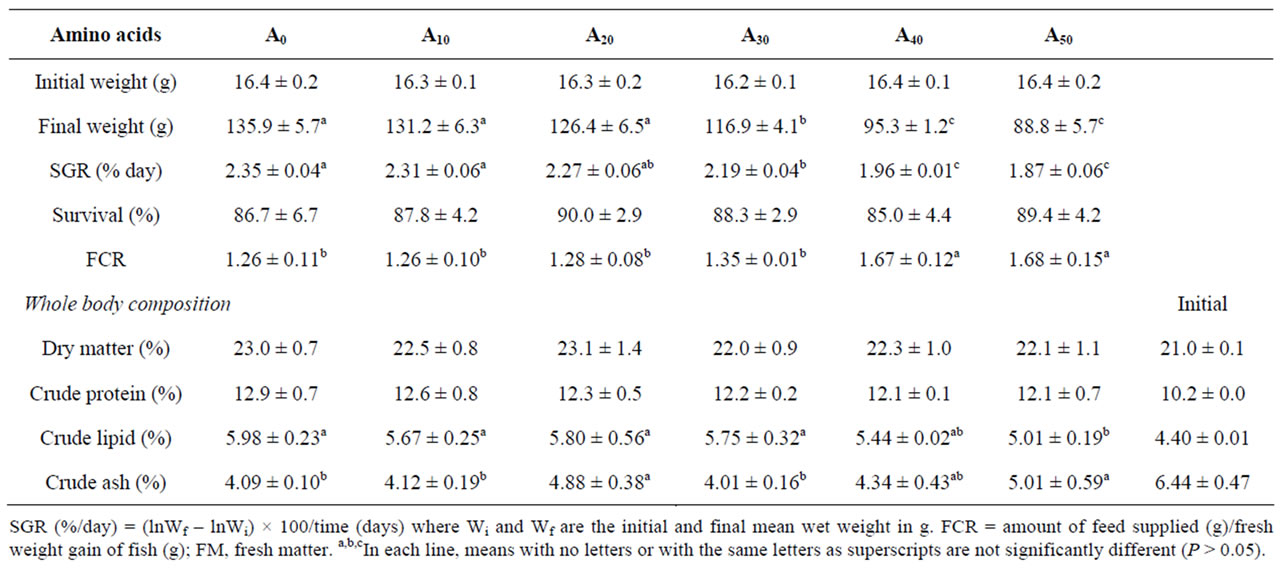
Table 5. Growth, feed performance and body composition (% fresh matter basis) of Nile tilapia fed in ponds with diets containing increasing level of Azolla filiculoides for 90 days. Data are mean ± S.D. of three replicates. A0 to A50: diet with 0% to 50% Azolla.
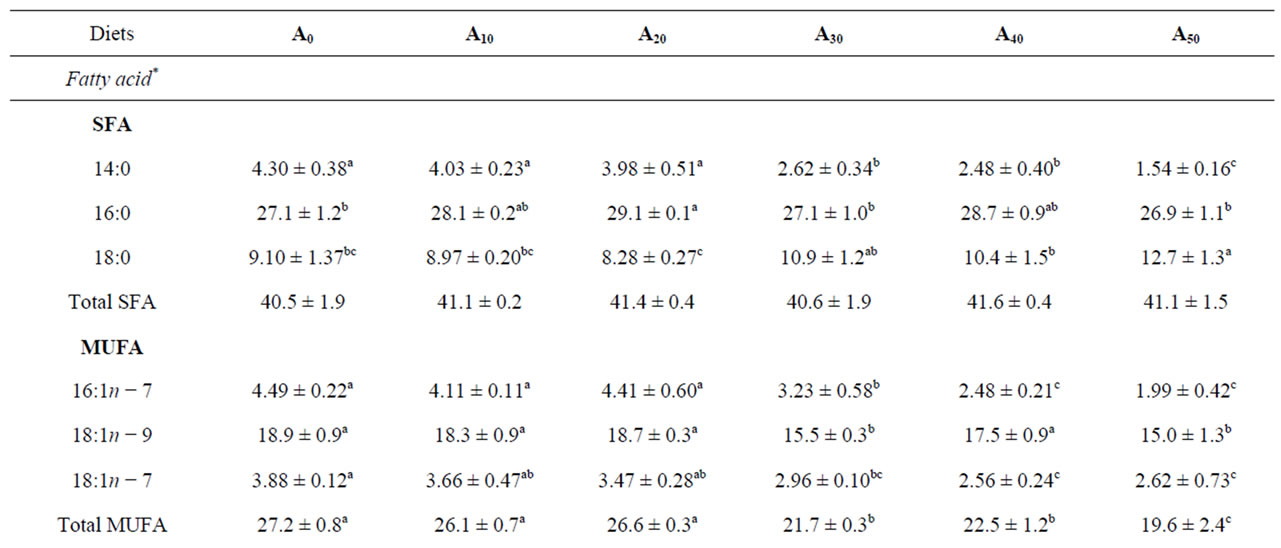

Table 6. Means ± S.D. of fatty acid levels (% of total fatty acids) in the whole body of Nile tilapia O. niloticus fed in ponds with diets containing gradual level of Azolla filiculoides. A0 to A50: diet with 0% to 50% Azolla.
growth in semi-intensive systems. The reported dietary requirement for phosphorus in tilapia varies from 0.90% [30] to 0.46% [31] depending on species, fish size and diet composition. In this study, all the diets used contain sufficient amounts of phosphorus to meet this need. Since A. filiculoides contain no antinutrient factor, the reduction in growth of fish fed diets A30, A40 and A50 could be explain by the lower content of methionine and (n – 3) fatty acids in the fern and thus in high AM-diets, as well as by the low digestibility of crude protein found in A. filiculoides [31,32]. Unfortunately, it seems that these deficiencies are not completely counterbalanced by the inputs from natural food, mainly plankton and invertebrates, through their content in methionine and other amino acids and fatty acids.
Carcass moisture and crude protein in whole fish body were not significantly affected by dietary treatment. Conversely, lipid deposition was affected at high AM level (A50).
Several studies have been reported on the effects of substituting FM with feedstuffs on the carcass composition of fish produced. The trend obtained for moisture and crude protein were in agreement with those reported for Nile tilapia by Patel & Yakupitiyage [33] in ponds and Schneider et al. [34] in aquaria.
The decreasing values of lipid at high AM in diets followed the results of Pouomogne et al. [35] who used cocoa husks, Hossain et al. [36,37] who used Sesbania, and Siddhuraju & Becker [38,39] who used Mucuna seed meal in their diets. The possible explanations for these variations could be the reduction of FM in diet and the lower contribution by plant protein that contained a high amount of non-digestible cuticles [40].
In experimental diets, percentages of myristic acid, stearic acid, palmitoleic acid, vaccenic acid, linolenic acid (LLA), EPA, clupanodonic acid and DHA in diets decreased with decreasing FM, certainly because of the high levels of these fatty acids in FM, compared to AM. Also, the increasing trend of linoleic acid (LA) and ARA levels in experimental diets is probably due to the increase of AM, which contains higher levels of that fatty acid than FM.
Because of the high content of AM in LA and ARA compared to FM, these fatty acids levels increased as AM proportion increased in diets. According to Maina et al. [13] quoting Olsen et al. [41] and Takeuchi et al. [42], tilapia possesses desaturation and elongation enzymes that efficiently convert C18 PUFAs to longer chain PUFAs. In experimental fish, significantly higher levels of ARA were found in fish fed high AM levels, whereas their LA showed significantly lower values. The higher values of ARA and the lower values of LA in fish compared to their levels in diets suggest de novo synthesis of ARA, using LA as precursor. Also, the lower values of LLA in fish compared to their levels in diets corroborated the well established fact that many freshwater fish [43], salmonids [44], rainbow trout [45] and tilapias [13,46] can readily convert LLA to EPA and DHA using metabolic pathways similar to those occurring in higher vertebrates. However, ARA, EPA, clupanodonic acid and DHA levels in all experimental fish were higher than the levels in diets. And these fatty acids values increased in AM-fed fish. According to Maina et al. [13] and Bahurmiz & Ng [46], the fatty acid composition of many fish resembles that of their food. This was also proved in many studies in which FM or fish oil was replaced by non-conventional sources of protein or lipid [15,47-49]. Awaïss et al. [16] found that fatty acid composition in gudgeon and perch reflected that of the rotifer Brachionus calyciflorus Pallas which they were fed. In Ethiopian lakes, the differences in natural food available in several lakes resulted in differences in fatty acid composition of O. niloticus [50].
Moreover, many phytoplankton families [51,52], copepods and rotifers [17,53], and chironomids and oligochaetes [54] are rich sources of LLA, EPA and DHA. It seems that the low levels of the latter fatty acids in AM-diets can be compensated by the consumption of an amount of natural food from the ponds. This contribution of the natural food to fatty acid profile of fish seems to be higher in fish fed high amounts of Azolla in diets. This emphasizes the need to quantify the contribution of natural food organisms to the overall nutritional budget of ponds, especially in those receiving AM. As a conesquence of increase in ARA, EPA, DHA in high AM-fed fish, total PUFAs, (n − 3) and (n − 6) fatty acids, and  values were higher in fish fed high AM levels in ponds.
5. Conclusions
The present study indicated that up to 20% of AM could be incorporated in diets without adverse effects on growth in Nile tilapia, which corresponds approximately to a reduction of 30% of FM protein of the control diet. This study also showed that the incorporation of AM in diets did not affect significantly the fish carcass composition.
Replacing FM with AM in diets for Nile tilapia O. niloticus raised in ponds yields fish with fatty acid profiles suitable for human consumption. As a result of the contribution of natural food available in ponds, the study suggest using AM in pond to produce high quality Nile tilapia with better fatty acid profile for human health.
REFERENCES
- IFFO, “Fishmeal Industry Overview,” International Fishmeal and Fish Oil Organization, St. Albans, 2006.
- FAO, “The State of the World Fisheries and Aquaculture,” Food and Agriculture Organization, Rome, 2006, p. 134.
- V. Leonard, C. Breyne, J.-C. Micha and Y. Larondelle, “Digestibility and Transit Time of Azolla Filiculoides Lamarck in Oreochromis aureus (Steindachner),” Aquaculture Research, vol. 29, No. 3, 1998, pp. 159-165. doi:10.1111/j.1365-2109.1998.tb01120.x
- E. A. Fasakin, A. M. Balogun and O. A. Fagbenro, “Evaluation of Sun-Dried Water Fern, Azolla africana, and Duckweed, Spirodela polyrrhiza, in Practical Diets for Nile Tilapia, Oreochromis niloticus, Fingerlings,” Journal of Applied Aquaculture, vol. 11, No. 4, 2001, pp. 83- 92. doi:10.1300/J028v11n04_09
- E. D. Fiogbé, J.-C. Micha and C. Van Hove, “Use of a Natural Aquatic Fern, Azolla microphylla, as a Main Component in Food for Omnivorous-Phytoplanktonophagous Tilapia, Oreochromis niloticus L.,” Journal of Applied Ichthyology, vol. 20, No. 6, 2004, pp. 517-520. doi:10.1111/j.1439-0426.2004.00562.x
- Y. Abou, E. D. Fiogbé and J.-C. Micha, “A Preliminary Assessment of Growth and Production of Nile Tilapia, Oreochromis niloticus L., Fed Azolla-Based-Diets in Earthen Ponds,” Journal of Applied Aquaculture, vol.19, No. 4, 2007, pp. 55-69. doi:10.1300/J028v19n04_03
- Y. Abou, E. D. Fiogbé and J.-C. Micha, “Effects of Stocking Density on Growth, Yield, and Profitability of Farming Nile Tilapia, Oreochromis niloticus L., Fed Azolla-Diet, in Earthen Ponds,” Aquaculture Research, vol. 38, No. 6, 2007b, pp. 595-604. doi:10.1111/j.1365-2109.2007.01700.x
- T. Ohaus, “Pen-Reared vs. Wild Salmon-Nutrition, Safety and Omega-3,” Pacific Fisheries, vol. 10, No. 6, 1989, pp. 51-59.
- G. M. Pigott, “The Need to Improve Omega-3 Content of Cultured Fish,” World Aquaculture, vol. 20, 1989, pp. 63-68.
- F. Thais and R. A. K. Stahl, “Effect of Dietary Fish Oil on Renal Function in Immune Mediated Glomerular Injury,” Proceedings of AOAC Short Course on Polyunsaturated Fatty Acids and Eicosanoids, American Oil Chemists Society, Champaign, 1987, pp. 123-126.
- D. Bates, N. Cartlidge, J. M. French, M. J. Jackson, S. Nightingale and D. A. A Shaw, “Double-Blinded Controlled Trial of Long Chain n-3 Polyunsaturated Fatty Acids in the Treatment of Multiple Sclerosis,” Journal of Neurological and Neurosurgical Psychiatry, vol. 52, No. 1, 1989, pp. 18-22. doi:10.1136/jnnp.52.1.18
- A. Kefatos, A. Diacatou, G. Voukiklaris, N. Nikolakakis, J. Vlachonikolis, D. Kounali, G. Mamalakis and A. S. Dontas, “Heart Disease Risk Factor Status and Dietary Changes in the Cretan Population over the Past 30 Years: The Seven Country Study,” American Journal of Clinical Nutrition, vol. 65, No. 5, 1997, pp. 1882-1886.
- J. G. Maina, R. M. Beames, P. N. Mbugua, G. Iwama and S. M. Kisia, “Partial Replacement of Fishmeal with Sunflower Cake and Corn Oil in Diets for Tilapia Oreochromis niloticus (Linn): Effect on Whole Body Fatty Acids,” Aquaculture Research, Vol. 34, No. 8, 2003, pp. 595-608. doi:10.1046/j.1365-2109.2003.00848.x
- T. Takeuchi, J. Lu, G. Yoshizaki and S. Satoh, “Effect on the Growth and Body Composition of Juvenile Tilapia Oreochromis niloticus Fed Raw Spirulina,” Fisheries Science, vol. 68, No. 1, 2002, pp. 34-40. doi:10.1046/j.1444-2906.2002.00386.x
- K. C. Williams, B. D. Paterson, C. G. Barlow, A. Ford and R. Roberts, “Potential of Meat Meal to Replace Fish Meal in Extruded Dry Diets for Barramundi, Lates calcarifer (Bloch). II. Organoleptic Characteristics and Fatty Acid Composition,” Aquaculture Research, vol. 34, No. 1, 2003, pp. 33-42. doi:10.1046/j.1365-2109.2003.00786.x
- A. Awaïss, P. Kestemont and J.-C. Micha, “Fatty Acid Profiles of Two Freshwater Fish Larvae (Gudgeon and Perch) Reared with Brachionus calyciflorus Pallas (rotifer) and/or Dry Diet,” Aquaculture Research, vol. 27, 1996, pp. 651-658.
- G. Drillet, N. O. G. Jørgensen, T. F. Sørensen, H. Ramløv and B. W. Hansen, “Biochemical and Technical Observations Supporting the Use of Copepods as Live Feed Organisms in Marine Larviculture,” Aquaculture Research, vol. 37, No. 8, 2006, pp. 756-772. doi:10.1111/j.1365-2109.2006.01489.x
- Ch. Mélard, “Bases Biologiques de L’élevage Intensif du Tilapia du Nil O. niloticus,” Cahiers d’Ethologie Appliquée, Vol. 5, No. 3, 1986, pp. 1-224.
- V. Leonard, “Use of an Aquatic Fern (Azolla filiculoides) in Two Species of Tropical Fish (Oreochromis niloticus and Tilapia rendalli),” Ph.D. Thesis, Catholic University of Louvain, Louvain-la-Neuve, 1997.
- A. G. J. Tacon, “Standard Methods for the Nutrition and Feeding of Farmed Fish and Shrimp,” Argent Laboratories Press, Washington, DC, 1990, 454 pp.
- J. Folch, M. Lees and G. H. S. Sloane-Stanley, “A Simple Method for the Isolation and Purification of Total Lipids from Animal Tissues,” Journal of Chemistry, vol. 226, 1957, pp. 497-509.
- AOAC, “Official Methods of Analysis,” 15th Edition, Association of Official Analytical Chemists, Arlington, 1990.
- W. W. Christie, “Lipid Analysis,” Pergamon, Oxford, 1982, p. 207.
- H. O. Hartley, “Smallest Composite Designs for Quadratic Response Surface,” Biometrics, vol. 15, No. 4, 1959, pp. 611-624. doi:10.2307/2527658
- D. B. Duncan, “Multiple Range and Multiple F-Tests,” Biometrics, vol. 11, 1955, pp. 1-42. doi:10.2307/3001478
- National Research Council (NRC), “Nutrient Requirements for Fish,” National Academy Press, Washington DC, 1993.
- A. F. M. El-Sayed, “Effects of Substituting Fish Meal with Azolla pinnata in Practical Diets for Fingerling and Adult Nile Tilapia Oreochromis niloticus (L),” Aquaculture and Fisheries Management, vol. 23, No. 2, 1992, pp. 167-173.
- E. A. Fasakin, A. M. Balogun and B. E. Fasuru, “Use of Duckweed, Spirodela polyrrhiza L. Schleiden, as a Protein Feedstuff in Practical Diets for Tilapia, Oreochromis niloticus L.,” Aquaculture Research, vol. 30, No. 5, 1999, pp. 313-318. doi:10.1046/j.1365-2109.1999.00318.x
- C. R. S. Dato-Cajegas and A. Yakupitiyage, “The Need for Dietary Mineral Supplementation for Nile Tilapia, Oreochromis niloticus, Cultured in a Semi-Intensive System,” Aquaculture, vol. 144, No. 1-3, 1996, pp. 227-237. doi:10.1016/S0044-8486(96)01292-6
- T. Watanabe, T. Takeuchi, A. Murakami and C. Ogino, “The Availability to Tilapia nilotica of Phosphorus in White Fish Meal,” Bulletin of the Japanese Society of Scientific Fisheries, vol. 46, No. 7, 1980, pp. 897-899. doi:10.2331/suisan.46.897
- J. S. Haylor, M. C. M. Beveridge and K. Jauncey, “Phosphorus Nutrition of Juvenile Oreochromis niloticus,” In: R. S. V. Pullin, T. Bhukaswan, K. Tonguthai and J. L. Maclean (Eds.), The Second International Symposium on Tilapia in Aquaculture. ICLARM Conference Proceedings 15, Department of Fisheries, Bangkok and ICLARM, Manila, 1988, pp. 341-345.
- J.-C. Micha and V. Leonard, “Digestibility of the Aquatic Fern Azolla filiculoides Lamarck in Two Species of Tilapia: The Phytoplanktonophagous Oreochromis niloticus (L.) and the macrophytophagous Tilapia Rendalli (Boulenger),” Bulletin des Séances de l’Académie Royale des Sciences d’- Outre-Mer, vol. 47, 2001, pp. 147-157.
- A. B. Patel and A. Yakupitiyage, “Mixed Feeding Schedules in Semi-Intensive Pond Culture of Nile Tilapia, Oreochromis niloticus, L.: Is It Necessary to Have Two Diets of Differing Protein Contents?” Aquaculture Research, Vol. 34, No. 14, 2003, pp. 1343-1352. doi:10.1046/j.1365-2109.2003.00957.x
- O. Schneider, A. K. Amirkolaie, J. Vera-Cartas, Ep. H. Eding, J. W. Schrama and J. A. J. Verreth, “Digestibility, Faeces Recovery, and Related Carbon, Nitrogen and Phosphorus Balances of Five Feed Ingredients Evaluated as Fishmeal Alternatives in Nile Tilapia, Oreochromis niloticus L.,” Aquaculture Research, vol. 35, No. 14, 2004, pp. 1370-1379. doi:10.1111/j.1365-2109.2004.01179.x
- V. Pouomogne, G. Takam and J.-B. Pouemegne, “A Preliminary Evaluation of Cacao Husks in Practical Diets for Juvenile Nile Tilapia (Oreochromis niloticus),” Aquaculture, Vol. 156, No. 3-4, 1997, pp. 211-219. doi:10.1016/S0044-8486(97)00091-4
- M. A. Hossain, U. Focken and K. Becker, “Evaluation of an Unconventional Legume Seed, Sesbania aculeata, as a Dietary Protein Source for Common Carp, Cyprinus carpio L.,” Aquaculture, Vol. 198, No. 1-2, 2001, pp. 129-140. doi:10.1016/S0044-8486(00)00574-3
- M. A. Hossain, U. Focken and K. Becker, “Nutritional Evaluation of Dhaincha (Sesbania aculeata) Seeds as Dietary Protein Source for Tilapia Oreochromis niloticus,” Aquaculture Research, vol. 33, 2002, pp. 653-662. doi:10.1046/j.1365-2109.2002.00690.x
- P. Siddhuraju and K. Becker, “Preliminary Nutritional Evaluation of Mucuna Seed Meal (Mucuna pruriens var. utilis) in Common Carp (Cyprinus carpio L.): An Assessment by Growth Performance and Feed Utilization,” Aquaculture, vol. 196, No. 1-2, 2001, pp. 105-123. doi:10.1016/S0044-8486(00)00577-9
- P. Siddhuraju and K. Becker, “Comparative Nutritional Evaluation of Differentially Processed Mucuna Seeds [Mucuna pruriens (L.) DC. Var. utilis (Wall ex Wight) Baker ex Burck)] on Growth Performance, Feed Utilization and Body Composition in Nile Tilapia (Oreochromis niloticus L.),” Aquaculture Research, vol. 34, No. 6, 2003, pp. 487-500. doi:10.1046/j.1365-2109.2003.00836.x
- W. Afuang, P. Siddhuraju and K. Becker, “Comparative Nutritional Evaluation of Raw, Methanol Extracted Residues and Methanol Extracts of Moringa (Moringa oleifera Lam.) Leaves on Growth Performance and Feed Utilization in Nile Tilapia (Oreochromis niloticus L.),” Aquaculture Research, vol. 34, No. 13, 2003, pp. 1147-1159. doi:10.1046/j.1365-2109.2003.00920.x
- R. E. Olsen, R. J. Henderson and B. J. McAndrew, “The Conversion of Linoleic Acid and Linolenic Acid to Longer Chain Polyunsaturated Fatty Acids by Tilapia (Oreochromis niloticus) in Vivo,” Fish Physiology and Biochemistry, vol. 8, 1990, pp. 261-270. doi:10.1007/BF00004465
- T. Takeuchi, K. Watanabe, W. Y. Yong and K. Watanabe, “Essential Fatty Acids of Grass Carp (Ctenopharyngodon idella),” Bulletin of the Japanese Society of Scientific Fisheries, vol. 57, No. 3, 1991, pp. 467-473. doi:10.2331/suisan.57.467
- A. J. Anderson and A. H. Arthington, “Influence of Diet on the Biosynthesis of Lipid Classes and Fatty Acids in Silver Perch, Bidyanus bidyanus,” In: G. L. Allan and W. Dall, Eds., Proceeding of Aquaculture Nutrition Workshop, Salamander Bay, 1992, pp. 41-45.
- B. S. Dosanjh, D. A. Higgs, D. J. McKenzie, D. J. randall, J. G. Eales, M. Rowshandili and G. Deacon, “Influence of Dietary Blends of Menhaden Oil and Canola Oil on Growth, Muscle Lipid Composition, and Thyroidal Status of Atlantic Salmon (Salmo salar) in Sea Water,” Fish Physiology and Biochemistry, vol. 19, No. 2, 1998, pp. 123-134. doi:10.1023/A:1007727618179
- G. Mourente and D. R. Tocher, “The Invo Incorporation and Metabolism of (1-14C) Linoleate (18:3n-3) in Liver, Brain and Eyes of Juveniles of Rainbow Trout Onchorhynchus mykiss L. and Gilthead Sea Bream Sparua auratus L.,” Fish Physiology and Biochemistry, vol. 18, 1998, pp. 149-165. doi:10.1023/A:1007717312480
- O. M. Bahurmiz and W-K. Ng, “Effects of Dietary Palm Oil Source on Growth, Tissue Fatty Acid Composition and Nutrient Digestibility of Red Hybrid Tilapia, Oreochromis sp., Raised from Stocking to Marketable Size,” Aquaculture, vol. 262, No. 2-4, 2007, pp. 382-392. doi:10.1016/j.aquaculture.2006.11.023
- J. G. Bell, R. J. Henderson, D. R. Tocher, F. McGhee, J. R.Dick, A. Porter, R. P. Smullen and J. R. Sargent, “Substituting Fish Oil with Crude Palm Oil in the Diet of Atlantic Salmon (Salmo salar) Affects Muscle Fatty Acid Composition and Hepatic Fatty Acid Metabolism,” Journal of Nutrition, vol. 132, No. 2, 2002, pp. 222-230.
- M. J. Caballero, A. Obach, G. Rosenlund, D. Montero, M. Gisvold and M. S. Izquierdo, “Impact of Different Dietary Lipid Sources on Growth, Lipid Digestibility, Tissue Fatty Acid Composition and Histology of Rainbow Trout, Onchorhynchus mykiss,” Aquaculture, vol. 214, No. 1-4, 2002, pp. 253-271. doi:10.1016/S0044-8486(01)00852-3
- D. S. Francis, G. M. Turchini, P. L. Jones and S. S. De Silva, “Effects of Dietary Oil Source on Growth and Fillet Fatty Acid Composition of Murray Cod, Maccullochella peelii,” Aquaculture, vol. 253, No. 1-4, 2006, pp. 547- 556. doi:10.1016/j.aquaculture.2005.08.008
- T. Zenebe, G. Ahlgren, I.-B. Gustafsson and M. Boberg, “Fatty Acid and Lipid Content of Oreochromis niloticus L. in Ethiopian Lakes—Dietary Effects of Phytoplankton,” Ecology of Freshwater Fish, vol. 7, No. 3, 1998, pp. 146- 158. doi:10.1111/j.1600-0633.1998.tb00181.x
- G. M. Hallegraeff, P. D. Nichols, J. K. Volkman, S. I. Blackburn and D. A. Everitt, “Pigments, Fatty Acids, and Sterols of the Toxic Dinoflagellate Gymnodinium catenatum,” Journal of Phycology, vol. 27, No. 5, 1991, pp. 591-599. doi:10.1111/j.0022-3646.1991.00591.x
- J. R. Sargent, M. V. Bell and R. J. Henderson, “Protists as Sources of (n-3) Polyunsaturated Fatty Acids for Vertebrate Development,” In: G. Brugerolle and J. P. Mignot, Eds., Proceedings of the Second European Congress of Protistology, Clermont-Ferrand, 1995, pp. 54-64.
- A. Awaïss and P. Kestemont, “Dynamique de Production et Qualité Nutritive du Rotifère d’Eau Douce Brachionus calyciflorus,” Aquatic Living Resources, vol. 10, No. 2, 1997, pp. 111-120. doi:10.1051/alr:1997012
- J. G. Bell, C. Ghioni and J. R. Sargent, “Fatty Acid Compositions of 10 Freshwater Invertebrates Which Are Natural Food Organisms of Atlantic Salmon parr (Salmo salar): A Comparison with Commercial Diets,” Aquaculture, vol. 128, No. 3-4, 1994, pp. 301-313. doi:10.1016/0044-8486(94)90319-0
NOTES
*Tissue fatty acid of Nile tilapia fed Azolla.