Food and Nutrition Sciences
Vol. 3 No. 8 (2012) , Article ID: 21563 , 8 pages DOI:10.4236/fns.2012.38143
Optimization of Incorporation Conditions of Renealmia battenbergiana Extract in Refined Bleached Deodorized (RBD) Palm Olein
![]()
Department of Food Science and Technology, College of Science, Kwame Nkrumah University of Science and Technology, Kumasi, Ghana.
Email: *ofosuiw.sci@knust.edu.gh
Received May 18th, 2012; revised June 21st, 2012; accepted June 29th, 2012
Keywords: Palm Olein; Optimization; Aromatic Extract
ABSTRACT
Incorporation of R. battenbergiana extract in refined bleached deodorized (RBD) palm olein was optimized using a full factorial design. The treatment included three factors (i.e. extracting temperature, time and extract-oil concentration) varied at three levels each (i.e. 25˚C - 65˚C, 0.5 - 1.5 h and 1% - 5%). The responses used to optimize the design runs were antioxidant properties as well as the red and blue color content of the residual oils. The results from the preliminary RBD palm olein analyses showed that the product was fresh in terms of the quality indices % FFA, peroxide value, iodine value and color. There was a significant difference (p < 0.05) in terms of the extract-RBD palm olein concentrations used as well as the treatment temperatures, however, there was no significant difference (p < 0.05) in treatment times. The optimum treatment condition was found to be at extract-RBD palm olein concentration of 1%, temperature of 25˚C and reaction time of 0.5 h.
1. Introduction
R. battenbergiana is an aromatic plant which belongs to the ginger family Zingiberaceae [1] and it is commonly found in the tropical regions of Africa [2]. The Akan speaking people of Ghana refer to this plant as Atiegya and serves as a main source of livelihood for the women and children in the rural wild areas of Ghana who engage in its gathering. It has traditionally been used as condiment in various food preparations such as soups and sauces among others to enhance flavor [3]. In the crude vegetable oil industries, the extract from the plant is applied at the clarification stage to impact aroma to the vegetable oil before storage and the extracts have been used as such since ancient times in food flavoring, pharmaceuticals, cosmetics and perfumery. The work done [4] has shown that beyond aromatic properties of such extracts, they exhibit several physiological activities including antimicrobial and antioxidant properties. In addition, these characteristics have been applied in some extracts-Thyme and Lavender to improve the quality parameters of frying oils and consequently extending their frying-life [5].
Refined palm olein obtained from refining and fractionating crude palm oil, is the main source of edible vegetable oil for most people in Ghana. However, vegetable oil quality and stability are the main factors that influence its acceptability and market value. Oxidative stability is one of the most important indicators of the keeping quality of vegetable oils [6]. The crude palm oil used as raw material for manufacturing olein contains naturally occurring antioxidants which impart certain amount of protection against thermolytic and oxidative reactions. However, these antioxidants are lost during the refining process and as a result, most frying olein cannot be used repeatedly for longer periods of time, necessitating the addition of exogenous antioxidants [7]. Well refined palm olein usually has a low FFA level (≤0.1%), a golden yellow color (≤4 R, 40 Y), does not foam and a bland odor and taste and has peroxide value of less than 1 Meq/kg [8].
Research has shown that the quality of frying oils deteriorate during continuous and repeated heating at elevated temperatures of between 160˚C - 180˚C in the presence of air and moisture [9]. During the frying process, a number of changes take place which involves a complex pattern of thermolytic and oxidative reactions [10] which lead to the formation of new compounds such as acrylamide, diacylglycerols, monoacylglycerols, free fatty acids, monomers, polymers and other degradative products which are harmful to the human body and often lead to the rejection of used vegetable oil [11].
One very important parameter is acrylamide formation in cooking oils and some work has been done on additives that modulate acrylamide formation in fried foods [12]. Some research [13] aimed at finding conditions that might reduce or prevent the formation of acrylamide in foods, concluded that adding the ground aromatic rosemary to olive oil resulted in a 25% reduction in acrylamide formation in fried potato slices. Acid treatments have also been found to be effective in preventing acrylamide formation since they lower pH into the range where acrylamide formation is minimized (<pH 5) [14]. Thus, by incorporating R. battenbergiana extract in refined bleached deodorized (RBD) palm olein, the quality of the frying oil is expected to be preserved even during repeated frying, thereby extending the frying life of the treated oil. The objective of the research therefore was to determine the optimum extract incorporated refined palm olein (EIRPO) based on the processing standards of RBD palm olein, color and antioxidant properties the treated oil can offer.
2. Materials and Method
2.1. Materials
R. battenbergiana was harvested at maturity (between 3 to 4 months when the leaves were browned) by a local out grower at Juaben-Ashanti. A mass of 5 kg of R. bat = tenbergiana were washed under 5 L of running tap water, cut into pieces and air dried for over 24 h. A quantity of 10 L of refined bleached deodorized palm olein (RBDPO) was obtained from Juaben Oil Mills Limited in JuabenAshanti. Tert-butylhydroquinone (TBHQ), n-hexane, potassium ferricyanide, trichloroacetic acid, ferric chloride and all other chemicals used for extraction and analyses were purchased from Sigma-Aldrich Chemicals.
Preparation of Dry R. battenbergiana Extract
Samples of air dried R. battenbergiana were milled through a 1 mm mesh using a hammer mill (Model ED-5). The milled extract (4.8 kg) was stored in a sealed plastic container at a cool, dry shelf prior to use.
2.2. Methods
2.2.1. Extract Incorporation Research Design
In order to formulate the extract incorporated refined palm olein (EIRPO), three factors were varied at three levels each as presented in the Table 1 and modeled [15] to give a total of 27 extract incorporation runs (Table 2).
After the extract-oil preparations, the mixtures were agitated with an orbital shaker (Gallenkamp, England) at 100 rpm according to the conditions set for each of the 27 runs. At the end of the shaking, the samples were centrifuged with a bench top centrifuge (MSE, USA) at a speed of 3000 rpm for 15 min after which the clear supernatants were collected and stored in sealed plastic containers and kept frozen for subsequent analyses.
2.2.2. Determination of Chemical Characteristics of Native and Treated Oils Native Oils
For the native oils such analysis as free fatty acid (FFA) content, peroxide value (PV) and iodine value (IV) were determined by official methods [16] whereas the color and antioxidants properties were run on the treated oils.
2.2.2.1. Color Determination
The color was measured using a tintometer (Lovibond F, England) with a 21/4 inch glass cuvette at room temperature of 27˚C. In its operation, the sample was placed in sample cell and the viewing tube was focused until a sharp image of the aperture of the sample oil was obtained. The tabs controlling the colored filters were then adjusted until the proportions of red, yellow and blue combinations that matched the sample color readings.
2.2.2.2. Antioxidant Properties Determination
Reducing power analysis based on the reduction of Fe3+ to Fe2+ [17] was used in assessing the antioxidant activity of the EIRPO. A mass of 5 g of each EIRPO sample were dissolved in 25 ml hexane and thoroughly agitated to uniform mixture and left overnight. An aliquot of 1 ml of each clear supernatant were mixed with 2.5 ml of 0.2 M sodium phosphate buffer (pH 6.6) and 2.5 ml of 1% potassium ferricyanide solution (K3Fe[CH]6(aq)) in a test tube. The mixtures were incubated at 50˚C in an incubator for 20 min after which 1.5 ml of 10% trichloroacetic acid solution (TCA) was added and left for 10 min at room temperature (27˚C). An aliquot of 2.5 ml of each clear supernatant were then mixed with 2.5 ml distilled water and 0.5 ml of 0.1% ferric chloride solution (FeCl3 (aq)) in a test tube. The absorbance was then measured at
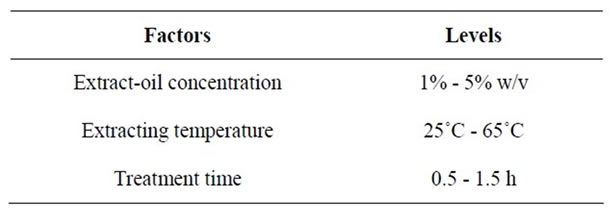
Table 1. Treatment factors; extract-oil concentration, extracting temperature and treatments times and their levels of variations used for the incorporation.
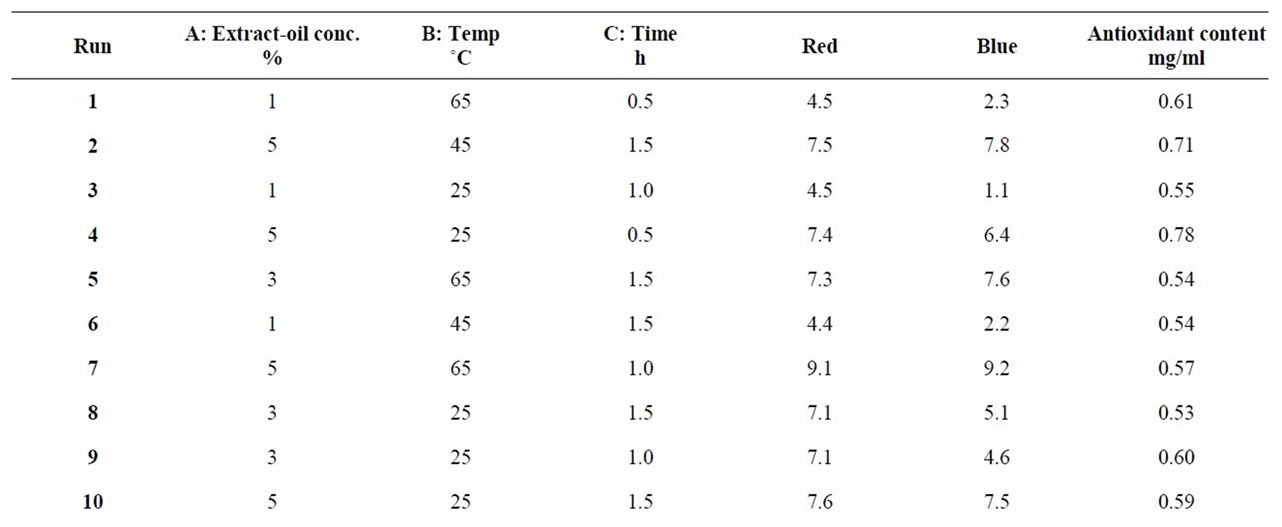
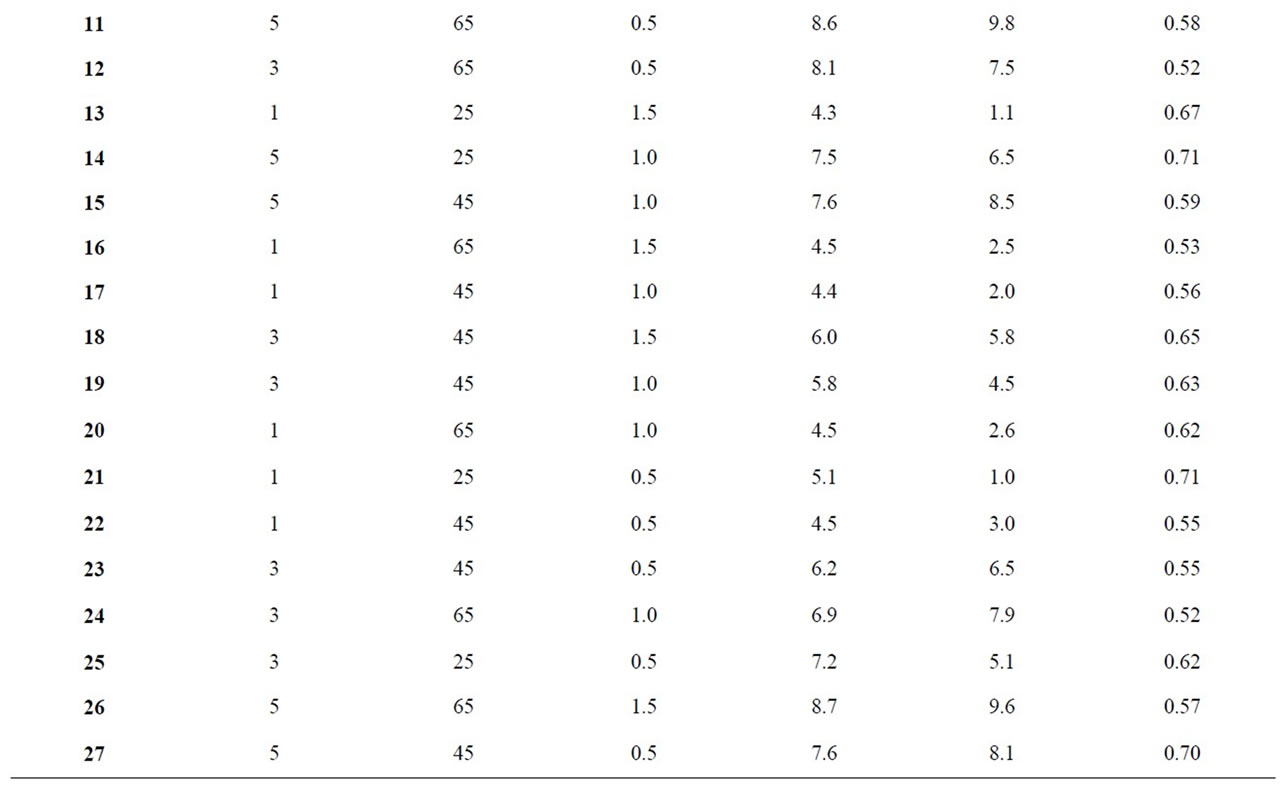
Table 2. Extract incorporation and treatment conditions with responses for antioxidant activity, red and blue colors.
700 nm using a MSE 700 series spectrophotometer. A blank determination was done using 1 ml distilled water. A standard curve was plotted using eight different concentrations (0.01, 0.05, 0.1, 0.3, 0.5, 0.7, 0.9 and 1.2 mg/ml) yielding the regression;
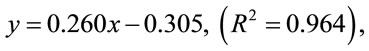
with tert-butyl hydroquinone as standard antioxidant for the analysis which was used to measure the amount of antioxidant activity in the EIRPO.
2.2.2.3. Statistical Analysis
The EIRPO formulation response data collected were loaded and run and the variations in the data collected such as coefficients of regression-(R2), adjusted regression-(adj R2), prediction regression-(pred R2), and adequate precision-(adeq precision) were studied. After ANOVA studies the adequacy of the model was assessed as well as any interactions that occurred among the factors that were varied. When all the model statistics and diagnostic plots were evaluated to be good, the model graphs were plotted and optimization of the factors and responds made.
3. Results and Discussion
3.1. Physicochemical Characteristics of Fresh RBD Palm Olein
The initial physicochemical properties of RBD palm olein used for the study are given in Table 3. The results showed that the RBD palm olein was of good quality, as indicated by its initial low PV of 0.8 Meq/kg and FFA content of 0.1%. The result was within the range for standard RBD palm olein [8]. This implies that the fresh RBD palm olein can suitably be applied as frying fat. The results obtained were comparable to that had been reported [18] upon analyzing the characteristics of fresh RBD palm olein.
3.2. The Red and Blue Color Responses
The responses for the different EIRPO are shown in Table 2. The minimum red color unit achieved was 4.3 R under the condition of 1% extract-oil concentration, 25˚C, 1.5 h. The maximum red color unit obtained was 9.1 R under the treatment condition of 5% extract-oil concentration, 65˚C and 1 h. From the statistical analysis, the variations in the % extract as well temperature of the agitations were significant (p < 0.05) and the model which was given as;
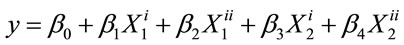
was also significant (p < 0.05), and the red unit color as well as that of the blue, followed this regression model where Y represented the red or blue color unit; β0 to β4 representing the coefficient of variation and X1 and X2 representing % extract and Temperature of agitation respectively.
For the red color unit, statistical analysis showed that the “pred R2” of 0.94 was in reasonable agreement with the “adj R2” of 0.95. Since the “adeq precision” measured the signal to noise ratio of 26.87 which is above 4, it indicates an adequate signal. Similarly, the blue color unit had “pred R2” of 0.96 which was also in agreement with the “adj R2” of 0.97 and the “adeq precision” of 36.53 made the model adequate and hence the model could be used to navigate the design space and subsequently be able to make predictions.
The red color response was found to be significant (p < 0.05) for both treatment temperature (˚C) and extract-oil concentration (%), but insignificant (p < 0.05) for the treatment time. This suggest that time variation did not contribute significantly to differences in the red color. In comparison to the study time selected by some workers [19] in an optimization conditions for the extraction of phenolic compounds from Citrus hystrix peels, however, the extracting time was 60 - 420 min. Under optimized formulation condition of 1% extract-oil concentration and 0.5 h, the inverse of red color was studied in relation to the treatment temperature and extract-oil concentration.
Refined oil processing standard select low red color unit in the range of 2.5 - 4.5 R for consumer appeal in the oil industry [20]. From Figure 1, it can be deduced that the red color unit was least at 45˚C and most at 65˚C under optimized condition of 1% extract-oil concentration and 0.5 h. At 25˚C, the red color was expected to be lowest because temperature rapidly increase the extract incurporation treatment due to faster diffusion rate and increased mass transfer [21]. All the red color responses measured for the different EIRPO formulations were generally above the native RBDPO (i.e. 3.5 R) and this is possibly due to the presence of chlorophyll and β-carotene pigment. In the absorption spectra, chlorophyll absorbs
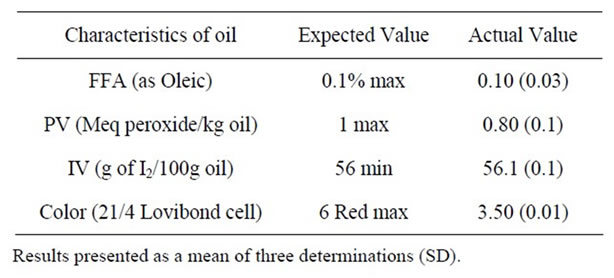
Table 3. The actual and expected values obtained for the physicochemical properties of the fresh RBD palm olein used for the study.
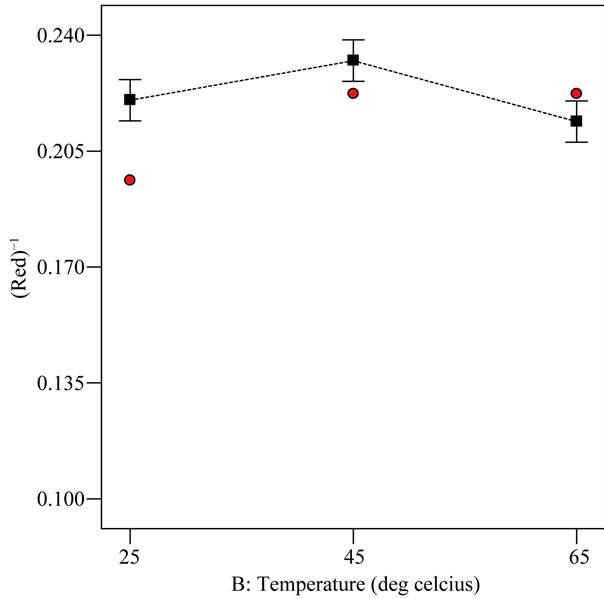
Figure 1. Relationship between treatment temperature and inverse red color response under optimized condition of 1% extract-oil concentration and 0.5 h.
light in the red (long wavelength) and the blue (short wavelength) regions of the visible light spectrum [22]. At 65˚C, the extract incorporation was highest and this could explain the greater red light absorption at that high temperature.
From Figure 2, the three extract-oil concentrations (i.e. 1%, 3% and 5%) were found to differ statistically from one another for the red color response at optimized condition of 25˚C and 0.5 h. The increasing order of red color for the extract-oil concentration was 1% followed by 3% and lastly 5%. As the extract-oil concentration increased, the red color measured also increased. This trend was expected because the R. battenbergiana extract that were incorporated could possibly contain color pigment that absorbed in the red wavelength [23]. However, high red color in refined palm olein is not consumer appealing therefore at 1% extract-oil concentration, the red color for EIRPO was most desirable while at 5% extract-oil concentration, the red color for EIRPO was least desirable. According to some workers [23], aromatic spices contain numerous phenolic diterpenes and β-carotene and these might have absorbed energy of the magnitude of visible light leading to high red color at higher extract concentration. Generally, the red color unit increased for both increasing temperature and extract-oil concentrations.
Blue color measured in refined olein samples is descriptive of the darkness or dullness attribute of the refined olein and is indicative of incomplete degumming or the presence of contaminants [24]. The response for blue color unit has the minimum and maximum units to be 1.0
Figure 2. Relationship between inverse red color response and extract-oil concentration (%) at optimized condition of 25˚C and agitated for 0.5 h.
and 9.8 respectively (Table 2). These were measured under the respective formulation conditions of 1% extractoil concentration at 25˚C, 0.5 h and 5% extract-oil concentration at 65˚C for 0.5 h. This implies high extracting temperature coupled with high extract-oil concentration is very likely to cause dullness and darkness in treated refined palm olein.
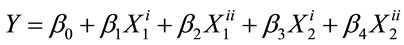
The extract-oil concentration and temperature showed significant differences (p < 0.05) for blue color unit. The treatment time did not vary significantly (p < 0.05) for blue color unit. The extracting time (i.e. from 0.5 to 1.5 h) therefore did not produce significant differences among the different EIRPO formulations. Under optimized formulation condition of 1% extract-oil concentration, 25˚C and 0.5 h, the square root of the blue color was studied in relation to the treatment temperature and extract-oil concentration.
All the three extract-oil concentrations and temperatures were statistically different with respect to blue color. This suggests that each extract-oil concentration as well as temperature produced a blue color reading that differ significantly from each other. From Figures 3 and 4, the blue color was increased from 1% extract-oil concentration to 5% extract-oil concentration and also in terms of extracting temperature from 25˚C to 65˚C. This trend is comparable to work done by other workers [23] who established that increase in temperature enhances pigment extraction from spices. It has also been identified [23] that aromatic plants contain secondary metabolites such as phenolics, diterpenes, β-carotene and chlorophilic compounds which are responsible for color development.
The square root of the blue color measured at increasing extract-oil concentration was found to be higher than that of increasing temperature. This trend shows that the extract-oil concentration has a much more significant effect on the overall color of the treated samples. All the blue color responses measured for all the different EIRPO formulations were generally greater than that of the fresh native RBD palm olein which did not contain any blue unit. It is suggested that the blue unit measured in the EIRPO formulations could be due to the components of incorporated R. battenbergiana extract.
3.3. Antioxidant Property Response
From the statistical analysis, the variations in the % extract was not significant but the temperature of the agitations were significant (p < 0.05) as well as the model which was given as;
Similar to the red and blue unit colors, the antioxidant property also followed this regression model where Y represented the anti oxidant property. In this case, the
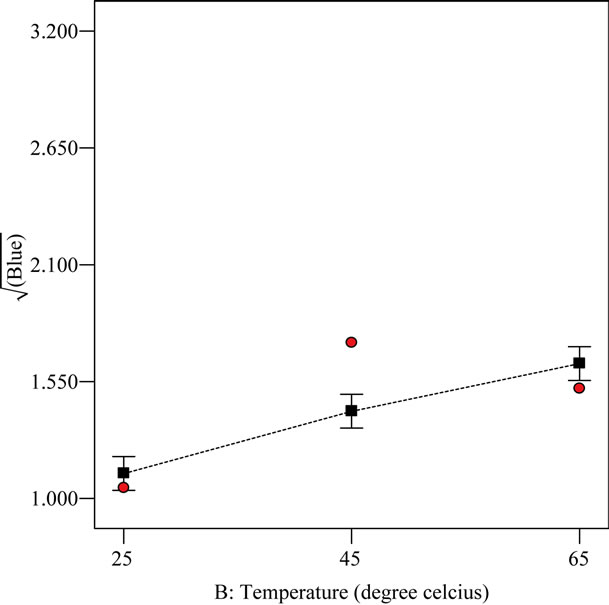
Figure 3. The relationship between the square root of the blue color and the temperature (˚C) at optimum condition of 1% extract-oil concentration and agitated for 0.5 h.
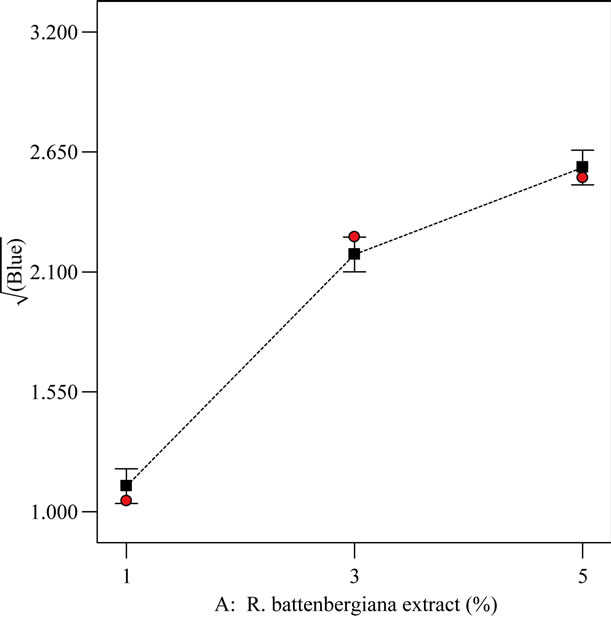
Figure 4. The relationship between the square root of blue color and extract-oil concentration at optimum condition of 25˚C and agitated for 0.5 h.
statistical analysis showed that the “pred R2” of 0.0875 was in reasonable agreement with the “adj R2” of 0.2840. Since the “adeq precision” measured the signal to noise ratio of 5.73 which is above 4, it indicated an adequate signal and hence the model could be used to navigate the design space and subsequently be able to make predictions during optimization.
The results for antioxidant properties ranged from 0.52 to 0.78 mg/ml under the treatment conditions of 3% extract-oil concentration, 65˚C, 1 h and 5% extract-oil concentration, 25˚C, and 0.5 h respectively. Research [17] has shown that the antioxidant activity is a function of the resultant formulation power to reduce Fe3+ to Fe2+. The antioxidant activity of the EIRPO formulations is paramount to its ability to increase stability of the treated oil especially during frying. From the studies, the antioxidant property response varied statistically with both treated extract-oil concentration (%) and temperature (˚C) but not with time. Under optimized formulation condition of 1% extract-oil concentration, 25˚C and 0.5 h, the antioxidant activity was studied in relation to the treatment temperature and extract-oil concentration as shown in Figures 5 and 6.
It can be deduced from Figure 5 that antioxidant response at the varying temperatures was statistically (p < 0.05) different from one another. This implies that the effect of each varying temperature on antioxidant property was mutually exclusive. The antioxidant property is in the decreasing order of 25˚C followed by 45˚C and lastly 65˚C. At elevated temperatures, it has been suggested [19] that there could be a break down of phenolic compounds and this might explain the trend observed.
From Figure 6, the antioxidant activity was highest at 5% extract-oil concentration and lowest at 3% extract-oil concentration. The lowest antioxidant activity measured at 3% extract-oil concentration was unusual since it had been reported [25] that the antioxidative effect of the
Figure 5. The relationship between varying temperatures (˚C) and antioxidant property response (mg/ml) at optimized condition of 1% extract-oil concentration and agitated for 0.5 h.
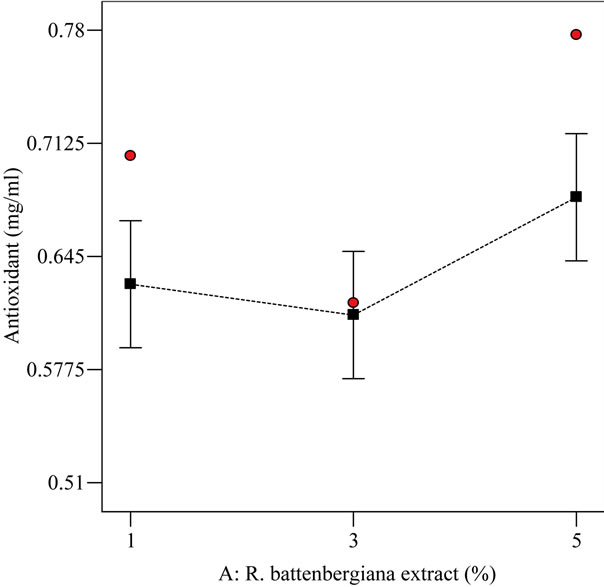
Figure 6. The relationship between varying extract-oil concentrations (%) and antioxidant property (mg/ml) at optimized condition of 25˚C and agitated for 0.5 h.
species, Phlomis bruguieri and Stachys laxa, increased as their concentrations increased in sunflower oil. However, the antioxidant activity measured at 3% and 1% in this research do not show statistical difference (p < 0.05).
The antioxidant activity measured could be probably ascribed to the presence of aromatic compounds such as phenols, terpenic alcohols in thyme [26] and linaloyl acetate, b-ocimene and caproic acid in Lavender [27]. The suggestive presence of natural active substances in R. battenbergiana extract may help to inhibit oxidation to a certain extent in RBD-palm olein as seen in the application of aromatic plants to extend frying life in sunflower oil [28]. Also it has been established [29] that RBD palm olein samples treated with turmeric extract generally lowered the peroxide value significantly. In this study, tertiary butyl hydroquinone (TBHQ) was used as the standard due to its exceptional stabilizing antioxidant effect in unsaturated fats [30].
3.4. Optimization of Formulations
The constraints factors were based on optimum set specifications which included a minimum red and blue color units as well as maximum antioxidant activity of 1.2 mg/ml. The optimized treatment condition was conesquently found to be 1% extract-oil concentration and 25˚C at agitation contact time of 0.5 h and the corresponding responses are as presented in Table 4.
4. Conclusion
The incorporation of R. battenbergiana extract into RBD
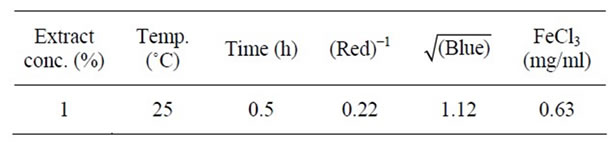
Table 4. Optimized condition of extract-oil concentration, extracting temperature and time for selected EIRPO formulation.
palm olein has been optimized for the red and blue color units as well as antioxidant properties. The optimum treatment condition was found to be at an extract-RBD palm olein concentration of 1%, temperature of 25˚C and time of agitation of 0.5 h.
REFERENCES
- P. J. M. Maas, “Renealmia (Zingiberaceae-Zingiberoideae). Costoideae (Additions) (Zingiberaceae) , In: Flora Neotropica Monograph, 18, 1977, S. 138.Costoideae (Addition) (Zingiberaceae),” Flora Neotropica Monograph, Vol. 18, 1977, p. 138.
- J. B. Grantler, “Renealmia battenbergiana Cummins (Family-Zingiberaceae),” Flora of Tropical Africa, Vol. 7, 1998, p. 293.
- FAO, “Traditional Food Plants,” FAO Food and Nutrition, Vol. 42, 1990, pp. 1-593
- A. Loo and H. Richard, “Nature, Origine et Proprietes des Epices et des Aromates Bruts,” In: H. Richard, Ed., Epices et Aromates, TEC and DOC, Lavoisier, Paris, 1992, pp. 18-22.
- M. Bensmira, B. Jiang, C. Nsabimana and T. Jian, “Effect of Lavender and Thyme Incorporation in Sunflower Seed Oil on Its Resistance to Frying Temperatures,” Food Research International, Vol. 40, No. 3, 2006, pp. 341-346. doi:10.1016/j.foodres.2006.10.004
- C. P. Tan and Y. B. Che-Man, “Recent Developments in Differential Scanning Calorimetry for Assessing Oxidative Deterioration of Vegetable Oil,” Trends in Food Science and Technology, Vol. 13, No. 9, 2002, pp. 312-318. doi:10.1016/S0924-2244(02)00165-6
- P. P. Coppen, “The Use of Antioxidants,” In: J. C. Allen and R. J. Hamilton, Rancidity in Foods, 3rd Edition, Blackie Academic and Professional, New York, 1994, p. 84.
- H. A. T. Azmil and I. Razali, “Comparison of the Frying Stability of Standard Palm Olein and Special Quality Palm Olein,” Journal of American Oil Chemists’ Society, Vol. 85, No. 3, 2008, pp. 245-251.
- M. Maskan, “Change in Color and Rheological Behavior of Sunflower Seed Oil during Frying and after Adsorbent Treatment of Used Oil,” European Food Research and Technology, Vol. 218, No. 1, 2003, pp. 20-25. doi:10.1007/s00217-003-0807-z
- R. Demir and M. Bashan, “A Study on the Investigation of Fatty Acids in Pulps and Seeds of Olea Europae L. (Hirhali) and Olea Europae L. (Zoncuk),” Biochemical Achives, Vol. 14, 1998, pp. 187-191.
- P. J. White, “An Overview of Methods for Measuring Changes in Deep-Fat Frying Oils,” Food Technology, Vol. 45, No. 8, 1991, pp. 75-80.
- K. Grob, M. Biedermann, S. Biedermann-Brem, A. Noti, D. Imhof, T. Amrein, A. Pfefferle and D. Bazzocco, “French Fries with Less than 100 Ug/Kg Acrylamide. A Collaboration between Cooks and Analysts,” European Food Research and Technology, Vol. 217, No. 2, 2003, pp. 185-194. doi:10.1007/s00217-003-0753-9
- A. Becalski, B. P. Y. Lau, D. Lewis and S. W. Seaman, “Acrylamide in Foods: Occurrence, Sources, and Modeling,” Journal of Tropical Agriculture and Food Chemistry, Vol. 51, 2003, pp. 802-808. doi:10.1021/jf020889y
- M. Y. Jung, D. S. Choi and J. W. Ju, “A Novel Technique for Limitation of Acrylamide Formation in Fried and Baked Corn Chips and in French Fries,” Journal of Food Science, Vol. 68, No. 4, 2003, pp. 1287-1290. doi:10.1111/j.1365-2621.2003.tb09641.x
- “Design Expert,” Stat-Ease, Inc., Minneapolis, 2007.
- AOAC, “Official Methods of Analysis of the Association of Official Analytical Chemists,” 17th Edition, 2002.
- G. K. Jayaprakash, R. P. Singh and K. K. Sakariah, “Antioxidant Activity of Grape Seed Extracts on Peroxidation Models in Vitro,” Journal of Agriculture and Food Chemistry, Vol. 55, 2001, pp. 1018-1022.
- H. L. Gan, C. P. Tan, Y. B. C. Man, I. NorAini and S. A. H. Nazimah, “Monitoring the Storage Stability of RBD Palm Olein Using the Electronic Nose,” Food Chemistry, Vol. 89, No. 2, 2005, pp. 271-282. doi:10.1016/j.foodchem.2004.02.034
- S. W. Chan, C. Y. Lee, C. F. Yap, W. M. W. Aida and C. W. Ho, “Optimization of Extraction Conditions for Phenolic Compounds from Limau purut (Citrus hysterix) Peels,” International Food Research Journal, Vol. 16, 2009, pp. 203-213.
- B. K. Tan and F. C. H. Oh, “Oleins and Stearins from Malaysian Palm Oil—Chemical and Physical Characteristics,” PORIM Technology, Vol. 4, 1981, pp. 1-6.
- T. Juntachote, E. Berghofer, F. Bauer and S. Siebenhandl, “The Application of Response Surface Methodology to the Production of Phenolic Extracts of Lemon Grass, Galangal, Holy Basil and Rosemary,” International Journal of Food Science and Technology, Vol. 41, No. 2, 2006, pp. 121-133. doi:10.1111/j.1365-2621.2005.00987.x
- P. Matile, H. Stefan and T. Haward, “Chlorophyll Degradation,” Plant Molecular Biology, Vol. 50, 1999, pp. 67- 95. doi:10.1146/annurev.arplant.50.1.67
- C. Kaur and H. Kapoor, “Antioxidant Activity and Total Phenolic Content of Some Asian Vegetables,” International Journal of Food Science and Technology, Vol. 37, 2002, pp. 153-161. doi:10.1046/j.1365-2621.2002.00552.x
- E. F. Sipos and B. F. Szuhaj, “Bailey’s Industrial Oil and Fat Products,” 5th Edition, In: Y. H. Hui, Ed., John Wiley, New York, Vol. 2, 1996, pp. 497-601.
- K. Morteza-Semnani, Saeedi and S. Shanani, “Antioxidant Activity of the Methanolic Extracts of Some Species of Phlomis and Stachys on Sunflower Oil,” African Journal of Biotechnology, Vol. 5, No. 24, 2006, pp. 2428- 2432.
- E. Stahl-Biskup, “The Chemical Composition of Thymus Oils: A Review of the Literature 1960-1989,” Journal of Essential Oil Research, Vol. 3, No. 2, 1991, pp. 61-82. doi:10.1080/10412905.1991.9697915
- N. L. Bisset, “Lavandulae Floes Herbal Drugs and Phytopharmaceuticals,” CRC Press, Stuttgart, 1994, pp. 292- 294.
- S. J. Lee, K. Umano, T. Shibamoto and K. G. Lee, “Identification of Volatile Compounds in Basil (Ocimum basilicum L.) and Thyme Leaves (Thymus vulgaris L.) and Their Antioxidant Properties,” Food Chemistry, Vol. 91, 2005, pp. 131-137. doi:10.1016/j.foodchem.2004.05.056
- A. I. Nar, M. N. Fatihanim, I. Razali, M. Suhaila and Z. H. Chek, “Antioxidative Activity of Malaysian Herb Extracts in Refined Bleached Deodorized Palm Olein,” Journal of Oil Palm Research, Vol. 20, 2008, pp. 517- 526.
- R. D. O’Brien, “Fats and Oils Formulations and Processing for Application,” 5th Edition, John Wiley and Sons, Inc., New York, 2000, p. 168.
NOTES
*Corresponding author.