Food and Nutrition Sciences
Vol. 2 No. 6 (2011) , Article ID: 6615 , 11 pages DOI:10.4236/fns.2011.26081
A Study of the Enzymatic Hydrolysis of Fish Frames Using Model Systems
![]()
1Technological Educational Institute, Thessaloniki, Greece; 2University of Lincoln, Minerva House, Holbeach, United Kingdom.
Email: *thimoni@teithe.gr
Received May 16th, 2011; revised June 30th, 2011; accepted July 7th, 2011.
Keywords: enzymatic hydrolysis, papain, bromelain, pancreatin, fish frames, cod, fish protein hydrolysates
ABSTRACT
A model system was employed to study the operating conditions and primary parameters of enzymic hydrolysis of cod proteins. Pancreatin, papain, and bromelain were used to hydrolyse minced cod fillets under controlled conditions and with the rate of hydrolysis being continually monitored via both the pH-stat and TNBS method. The two methods were compared and evaluated. The rate of protein solubilisation was plotted against the degree of hydrolysis (DH). Dry fish protein hydrolysate (FPH) powders having short, medium and high degrees of hydrolysis (DH of approximately 8%, 11% and 16% respectively) were produced and analysed for their molecular weight distribution, using size exclusion chromatography. Almost complete protein solubilisation (75 g soluble protein per kg hydrolysis solution) could be achieved within an hour, at 40˚C, at 1% enzyme/substrate ratio (w/w) with papain and bromelain. The pH-stat was found capable of continuously following the rate of hydrolysis but only at low DH. The TNBS could be accurately used even at high DH to estimate the percentage of the peptide bonds cleaved, but required chemical analysis of withdrawn samples.
1. Introduction
Applications and uses of proteolytic enzymes for the hydrolysis of fish substrates are vast and varied in purpose. What started unknowingly with ancient practises such as the use of fruit extracts to tenderize hard textured fish flesh, and brined fermentations (autolytic hydrolyses) for sauce production [1], is now a deliberate and systematic practise.
There is considerable interest in the use of enzymes as an alternative to present mechanical methods for recovering high quality protein from fish processing waste, or under-utilised fish species [1,2].
Intended uses of such hydrolysates range from nutritional and functional additives with emulsi-fication, aeration, bio-active and anti-oxidative properties [3-11], to animal feeds [12-16] and microbial growth media [17-20].
Animal and plant derived enzymes were initially used almost exclusively. Most commonly these were: papain [15,21-24], bromelain [21,24,25], ficin [21,23,26], pepsin [13,21,27], trypsin [21,28,29] and pancreatin [30-32].
Hale [21] compared 23 commercially available peptidases for their ability to hydrolyse fish protein and found that ficin was most active in short hydrolysis experiments and that pronase—a microbial protease—had the overall greater activity per unit weight. Jacobsen et al. [33], Yu et al. [3], Quaglia et al. [34], Baca et al. [35], have all successfully use microbial enzymes for the hydrolysis of various fish protein substrates. The most common are: alkalase® [6,7,18,24,29,36,37], nutrase® [24,29,-38], protamex® [24,29,39], flavourzyme® [5,6,38,40,41] and kojizyme® [40].
Adler-Niessen [42] thoroughly investigated the subject of enzymatic hydrolysis (with particular reference to soya substrates) introducing and/or improving upon previous concepts and methods of analysis, for standardising and accurately describing enzymatic hydrolysis of proteins.
A common problem arising from the hydrolysis of protein substrates is the development of bitterness. This is reported by many workers on the subject, some of which tried to identify the nature of the bitter taste compounds and either avoid their formation, remove, or chemically manipulate the compounds reducing their bitterness [26,40,42-46].
The control of the functional properties of protein hydrolysates, has been yet another challenge to overcome by many workers [4,8,37,42,47].
The degree of hydrolysis (DH) is clearly one of the most important variables affecting the attributes of the protein hydrolysates of a given enzyme/substrate system. It is generally agreed that with endopeptidases, lower DH produced hydrolysates with higher molecular weight fractions, which exhibited better emulsification and aeration properties but showed greater hydrophobicity [36, 37]. The relation between DH and bitterness, antioxidative and/or other peptide bio-activities is enzyme dependant and generally more intricate [6,11].
Fractionation of the hydrolysates through the use of membrane technology was used successfully be many workers, in an attempt to produce fractions of specific molar mass, enriched in bio-active peptides [4,10,48-51].
This investigation is using a model system to study the hydrolysis of cod proteins. This will be the basis for following pilot scale hydrolysis experiments using cod and haddock frames. Ultimately this work is aimed to the description of a simplified, commercially viable process for the utilisation of fish frames through enzymatic hydrolysis.
2. Experimental
Fresh, skinned cod fillets were purchased locally (J. W. Moores Ltd., Grimsby). Samples were prepared by freezing 350 g portions of cod fillets into polyethylene bags.
Proteolytic enzymes were supplied by Sigma. These were: papain from papaya latex (EC 3.4.22.2, p.n. P-3250) bromelain from pineapple stem (EC 3.4.22.32, p.n. B-4882) and pancreatin from porcine pancreas (p.n. P-1500).
2.1. pH-Stat
The pH-stat apparatus (figure 1) provides a means of continuously following the rate of hydrolysis under controlled conditions and at a constant pH.
The pH meter is connected with the peristaltic pump through an electronic switch, which is set to trigger the pump on when the pH of the hydrolysis mixture is changed.
The pump is fed from the burette containing the alkali (or acid) which is added in the reaction mixture, until the initial pH value (switch-off point) is achieved and the pump is stopped. The degree of hydrolysis DH can be easily estimated, at any stage during the enzymatic breakdown of a protein substrate, through the titrant consumption [42].
Laboratory scale experiments were carried out as batch reactions on a 1L scale.
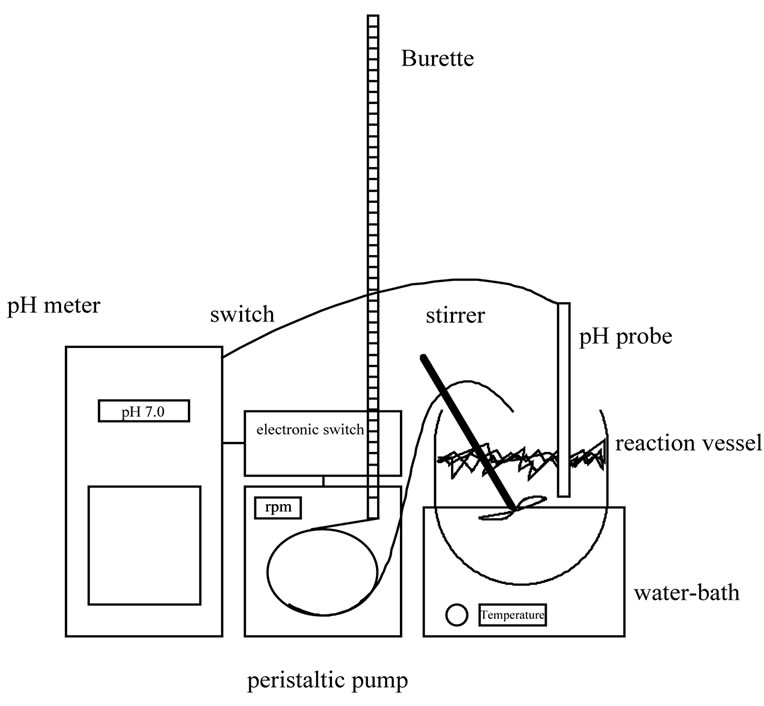
Figure 1. Equipment for the proteolytic hydrolysis in the laboratory and the application of the pH-stat technique.
2.2. Preparation of the Reaction Mixture
After thawing at 4˚C - 5˚C for 24 hours, the 350 g fish samples were weighed directly into a blending cup, which was then filled with warm (approximately 50˚C) tap water to a total of 750 g in order to bring the temperature of the hydrolysis mixture close to 40˚C. The mixture was blended for 30 sec (using a domestic high speed blender) and transferred into the reaction vessel until 731 ± 1 g were collected (M).
The substrate concentration S w/w (were S = Kjeldahl protein) was estimated (approx. 75 g protein Kg−1 mixture) and used for the calculation of the weight of the enzyme preparation necessary to produce a certain enzyme/substrate ratio w/w (E/S). Protein content determinations were carried out on 500 g representative samples collected from each initial batch of fish fillets. This was used as the protein content of each smaller sample (350 g) deriving from the same batch.
Unless specified otherwise a 1% (E/S, crude dry enzyme/protein) ratio was used in all experiments. Prior to the addition into the mixture, the dry enzyme preparation was dissolved into 5 ml of distilled water.
2.3. Determination of the Rate of Hydrolysis, Using the pH-Stat Method
The alkali consumption (ml) from the burette of the pH-stat apparatus revealed the rate of protein hydrolysis.
2.4. Calculation of the Degree of Hydrolysis, Using the pH-Stat Method
The degree of hydrolysis DH represents the percentage of peptide bonds cleaved during a hydrolytic process and was calculated as given by Adler-Niessen [42].
2.5. Determination of Free Amino Groups, Using the TNBS Method
This was carried out using the method of Adler-Niessen [52]. Hydrolysate samples weighing 2 g were drawn at regular intervals from the reacting mixture. Standard L-leucine solutions were prepared fresh before each experiment.
The percentage of the peptide bonds cleaved (DH) was estimated. Complete cleavage of the peptide bonds in the substrate was achieved by acid hydrolysis [53].
2.6. Determination of FPH Molecular Weight Distribution
Two sephadex gel beds were used, a G-15 fine and a G-50 fine (Pharmacia Biotech) with fractionation ranges able to separate proteins/peptides within the range of 0 - 1500 Daltons and 1500 - 30000 Daltons respectively.
The eluent was phosphate buffer (0.0325M K2HPO4/ 0.0026 M KH2PO4/0.40 NaCl) of pH 7.6 and ionic strength 0.5 [29] and had a flow rate of 30 ml·h−1.
The two columns had an internal diameter of 26mm (G-50) and 16 mm (G-15). The length of both gel beds was approximately 54cm.
The column was in series with a flow-through UV spectrophotometer. Absorbance was measured at 206 nm.
FPH powder containing 10mg of Kjeldahl protein (N × 6.25) had 1g of NaCl added and then was dissolved into 10ml of eluent. The mixture was filtered through a fast Watman paper and collected with a disposable syringe.
A sample of 0.5ml was injected into the columns (sephadex G-15 and G-50).
Standards of known molecular weight were chromatographed in order to construct a calibration curve, used to identify the molecular weight distribution of the protein hydrolysates.
2.7. Production of FPH Powders of Specific DH, Using Model Systems
Protein hydrolysates were produced from cod fillets, hydrolysed with papain and bromelain, using the model system of hydrolysis. The hydrolysis experiments were carried out without any pH adjustment (pH-drop) at 1% E/S and 41˚C ± 1˚C.
A short, medium and long hydrolysis experiment was performed for each enzyme, producing three samples each having a different degree of hydrolysis (approximately 8%, 11% and 16% DH). The duration of hydrolysis in each case was 20, 60 and 120 min respectively. Duplicate experiments were performed, thus producing two triads of samples for each enzyme.
At the end of each experiment the extent of hydrolysis was monitored by the TNBS method. With the short and medium hydrolysis experiments, enzymic reaction was arrested prior to the TNBS analysis, using H2O2 (6 g·litre–1 of mixture).
The liquid hydrolysates were pasteurised using a lab scale heat exchanger (78˚C for 18 sec).
Prior to spray-drying the pasteurised hydrolysates were centrifuged, using a bench top centrifuge (1700 × g i.e. 3000 rpm for 30 min) in order to remove the insoluble matter.
Finally dry protein powders were produced by spraydrying.
3. Results and Discussion
The enzymatic hydrolysis of a complicated and non-pure food protein such as the fish flesh cannot be accurately described, or predicted solely by the application of existing kinetic models and laws [42]. The hydrolysis is influenced by many parameters, which interact with each other, thus making their isolated study very difficult.
The enzymatic hydrolysis should be regarded as a combination of parallel and consecutive occurring reactions [42]. Although from a purely kinetic point of view the study of each reaction as well as the investigation of the dynamics between parallel and consecutive reactions is meaningful, these studies are far from being able to completely describe the process and also rather unnecessary for the purpose of the present work.
3.1. Hydrolysis Parameters
The degree of hydrolysis DH (i.e. percentage of peptide bond cleaved) is a true reflection of the progress of hydrolysis and thus its selection as the primary indicator for the controlling of hydrolysis is very appropriate [42,44].
For a given substrate and enzyme at a given pH, the comparison of different hydrolysates was based on the DH as it is the primary determinant of the properties of the hydrolysates. Adler-Niessen [42] (p. 315) stated that the hydrolysis parameters (E, E/S, and T) can be varied freely in most cases, without affecting the hydrolytic process (and thus the properties of the hydrolysates) in a qualitative way.
However he determined that the pH was naturally found to exert an independent influence [42] (p. 189, p. 315) on the properties of the hydrolysates and so recommended that the pH should be controlled and in most cases maintained constant during hydrolysis processes.
3.2. Measurement of the Rate of Hydrolysis, Using the pH-Stat
During the hydrolytic breakdown of proteins, the degree of ionisation of the free carboxyland aminogroups formed will depend on the initial pH of hydrolysis. At pH values above the area given by the pK of the amino and carboxyl groups (around the region of pH 5 - 6) the amino groups will be only partially protonated (or entirely unprotonated) whilst the carboxyl groups would be fully dissociated. As a consequence the pH would tend to decrease with the progress of hydrolysis, if left uncontrolled. In order for the hydrolysis to proceed at constant pH, alkali must be added so as to titrate the liberated carboxyl groups [42] (p. 11, p. 132).
It was found that the pH-stat technique was highly dependent on the pH of hydrolysis and thus the pH meter was calibrated prior to each experiment, accompanied by daily cleaning and maintenance of the probe.
3.3. Measurement of the Rate of Hydrolysis, Using the TNBS Method
Each hydrolysis experiment carried out and measured by the pH-stat technique was also assessed using the TNBS method.
A TNBS standard calibration curve was prepared using L-leucine and was found to be linear (R2 = 0.991) [54].
3.4. Temperature
One of the variables eliminated from the investigation using model systems was the temperature of hydrolysis. The lowest temperature at which complete solubilisation of the fish flesh occurred within 2 - 3 hours (at the given conditions) was found to be approximately 40˚C, consequently this was the temperature used in all the model experiments.
3.5. Effect of the pH on the Rate of Hydrolysis (pH Stat and TNBS)
The hydrolysis experiments were carried out at different pH values (namely 6.5, 7.0, 7.5, and 8.0) and were monitored both with the pH-stat and the TNBS technique, in order to measure the rates of hydrolysis with the three enzymes and also compare the methods.
The duration of all hydrolysis experiments was 3.5 hours and the temperature was 41˚C ± 1˚C.
With the pH-stat, plots of the alkali consumption during the hydrolysis experiments versus time (duration of hydrolysis) were created for all the experiments, in order to provide an easy way of comparing the hydrolytic effect of the different enzymes. However, since the alkali consumption is strongly related to the pH of the reaction, only experiments carried out at the same pH can be compared by this way (in order to compare hydrolysis carried out at different pH, it is necessary to estimate the DH values and construct the “DH vs duration of hydrolysis” graphs). Alternatively, such comparisons can be carried out using the TNBS method which is not affected by the pH.
Figure 2 shows the pH-stat plots (from repeated experiments) for the three enzymes, at pH 7.5.
Figure 3 shows the comparison of the TNBS absorbances for the 3.5 hours hydrolysis experi-ments, at different pH values, at 41˚C ± 1˚C, for papain.
The rate of hydrolysis (both the initial and the overall rate) both for bromelain and papain is highest at pH 6.5 and decreases with the increase of the pH. Although the effect of further pH reduction (e.g. below 6.5) was not investigated, it is believed that, since both enzymes are neutral proteases [37] maximum rates of hydrolysis are observed in the region of pH 6.5. Pancreatin showed its highest rate of hydrolysis at pH 8.0. However, the effect of pH on the activity of pancreatin is small compared to the previous enzymes and almost negligible in the region between pH 6.5 and 7.5.
The highest rates of hydrolysis achieved with pancreatin (at pH 8.0) are still significantly lower compared to the maximum rates recorded with papain and bromelain (at pH 6.5).
From an industrial point of view, hydrolysis carried out without any pH adjustment would be economically desirable, and hence the investigation of the increase in E/S for pancreatin (at pH 8.0) was not performed.
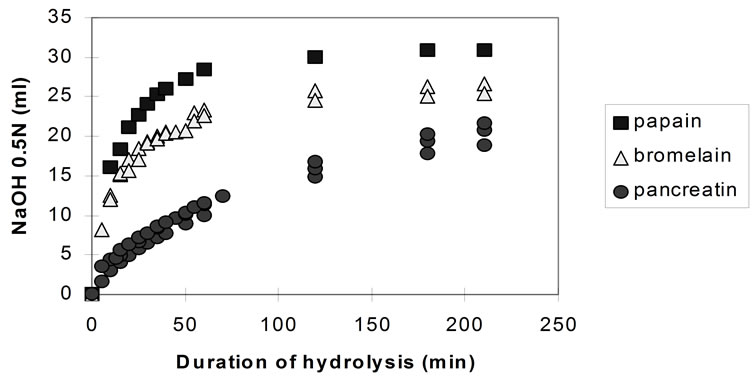
Figure 2. pH-stat controlled hydrolysis of homogenised fish flesh using papain, bromelain and pancreatin at pH 7.5 (40˚C, 1% E/S i.e. crude dry enzyme/protein).
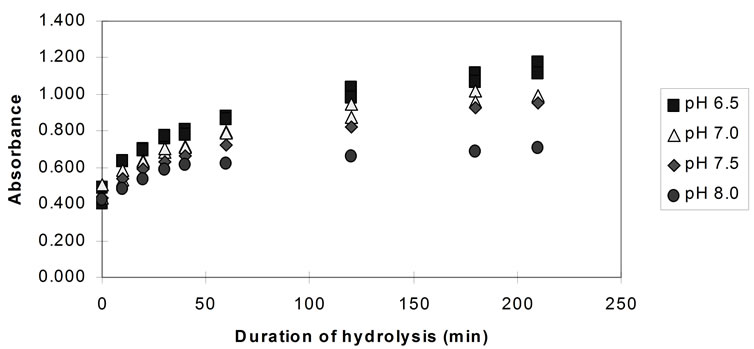
Figure 3. Hydrolysis of homogenised fish flesh, at different pH values using papain (measured by the TNBS) (40˚C, 1% E/S).
Figure 4 shows the results of hydrolysis experiments carried out at different pH values and also without any pH adjustment (pH drop, initial pH ~ 6.7) for bromelain.
Very similar rates of hydrolysis were recorded for papain and bromelain at pH 7.0 to 6.5, and with no pH adjustment. This was expected since the natural pH of the hydrolysis mixture would be approximately 6.8 and the progress of hydrolysis (without any pH adjustment) would “drop” the pH from 6.8 to a minimum of pH 6.4.
3.6. Effect of Enzyme Concentration on the Rate of Hydrolysis (Only pH-Stat)
Figure 5 shows the hydrolysis rates for the three enzymes at 0.1% and 1% E/S concentration at pH 7.0, measured by the pH-stat technique.
At 0.1% enzyme to substrate ratio pancreatin seemed inactive, whereas with papain and bromelain the hydrolytic rate was greatly reduced (compared to the 1% E/S). After 3 hours, the degree of hydrolysis with the plant proteases was only 1/3 of that attained at 1% E/S at the same time. However, the enzymes were still active (in
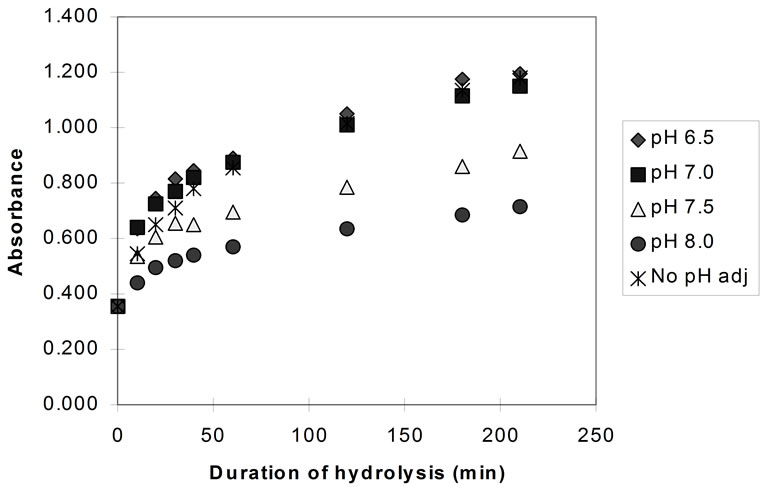
Figure 4. Hydrolysis of homogenised fish flesh, at different pH values using bromelain (measured by TNBS) (40˚C, 1% E/S).
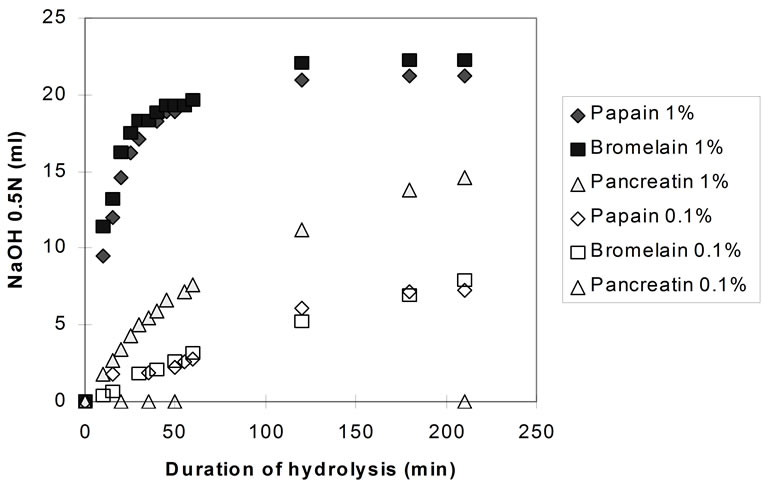
Figure 5. Hydrolysis of homogenised fish flesh (measured by the pH-stat) using papain, bromelain, and pancreatin, both at 1% and 0.1% E/S (40˚C, pH 7.0).
contrast to the experiments carried out at 1% E/S, in which hydrolysis had entered into a stationary phase after approximately 100min) and it can be assumed that similar DHmax would have been achieved if hydrolyses were prolonged.
3.7. Comparison of the pH-Stat and TNBS Method
Prior to the estimation of the degree of dissociation for the calibration of the pH-stat and consequently for the determination of the degree of hydrolysis DH, values from the pH-stat method were compared to these deriving from the TNBS method.
In a hydrolysis experiment in which the pH-stat and the TNBS method are applied in order to determine the rate of hydrolysis, the pH-stat technique measures the rate of peptide bond breaking through the consumption of alkali, whilst the TNBS through the measurement of the absorbance of the chromophore complex of TNBS and alpha amino groups. It is evident that the plot of the alkali consumption (in ml) versus the increase in the TNBS absorbance should be linear. However, in this current work, such a plot (figure 6) shows a deviation from linearity.
This was consistent throughout the work, always commencing at absorbances of approximately 0.7 AU. The portion of all the graphs that lies below this absorbance, is consistently linear. The pancreatin plots did not markedly exceed the 0.7 (AU) TNBS absorbance and hence showed linearity with excellent regression coefficients.
The TNBS method performs a direct assay of the alpha amino groups released during protein hydrolytic breakdown. On the other hand, the pH-stat technique is restricted more by the degree of hydrolysis. This is primarily because the pK of the alpha amino groups (i.e. the average pK value) used for the determination of the DH throughout the hydrolysis experiment, in addition to the nature of the terminal amino-acid and the temperature,
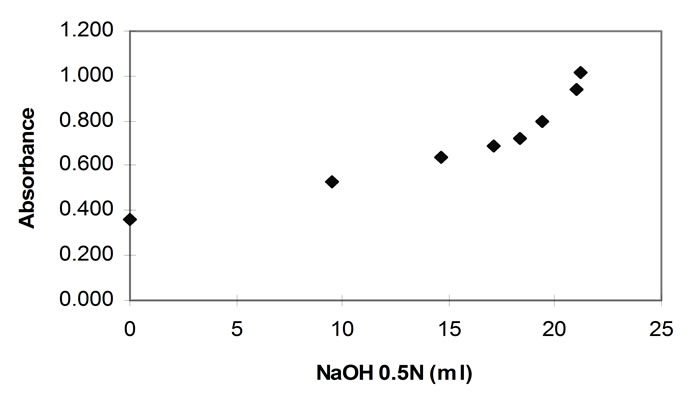
Figure 6. TNBS absorbance plotted against NaOH consumed during hydrolysis with papain (40˚C, 1% E/S, pH 7.0).
varies also with the chain length of the constituents of the hydrolysate (proteins, peptides, amino-acids). The variation is considerable, with di/tri-peptides having pK values approximately half a pH unit higher than polypeptides. This means that at very high degrees of hydrolysis the average pK value (and hence the degree of dissociation) will differ significantly from the value given for larger polypeptides.
However, at moderate DH (below 20%) and particularly when using endo-peptidases—where the content of free amino-acids and di/tri-peptides in the hydrolysate is expected to be low—the error introduced by the variation of the pK was found to be negligible [42].
3.8. Effect of pK Shift upon Hydrolysis, on pH-Stat Operability
The poor correlation between the pH-stat and the TNBS method observed over a certain degree of hydrolysis (that corresponded to TNBS absorbance of approximately 0.7 AU) is attributed to the pH-stat. It was shown [54] that the amount of alkali required per peptide bond cleaved was less at the latter than the initial stages of hydrolysis.
3.9. Estimation of the DH, Using the TNBS Method
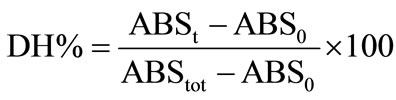
The percentage of the peptide bonds cleaved DH can be also estimated at any stage of hydrolysis (e.g. at a given time t, after the start of hydrolysis) by the following equation:
where:
ABSt = absorbance at time (t) of hydrolysis, in LeuNH2 meq/g
ABS0 = absorbance of the unhydrolysed substrate (t0) in Leu-NH2 meq/g
ABStot = absorbance of the completely hydrolysed fish substrate, in Leu-NH2 meq/g
Figure 7 shows the increase in the degree of hydrolysis (DH) using papain, bromelain and pancreatin, as it was calculated using the TNBS method.
The DH values deriving from the pH-stat were more than 50% lower than those calculated by using the TNBS technique. It is thought that the DH values deriving from the measurement of the rate of hydrolysis by the TNBS method are closer to the true values of peptide bonds cleaved.
The accurate determination of the absolute DH value of hydrolysis is not of great importance to industrial applications as in this current study, but it would be useful for comparisons with literature data.
3.10. Determination of the Rate of Protein Solubilisation upon Hydrolysis
Figure 8 shows the rate of protein solubilisation upon hydrolysis with the three different enzymes.
Even prior to hydrolysis almost 30% of the homogenised protein substrate was found to be soluble, as it would pass through the sintered glass crucible. This can be ascribed primarily to the sarcoplasmic proteins (myogen) which are water soluble and can be easily extracted from the homogenised flesh. Suzuki [56] reports that the total content of the sarcoplasmic proteins in cod flesh is only 21%. Thus, it is likely that some myofibrillar proteins (myosin most likely) were also extracted and/or that the filter’s pore index (16 - 40 microns) allowed some solid protein particles to migrate through the filter. However, Kristinsson and Rasco [1] reported that sarcoplasmic proteins can account for up to 30% of fish muscle.
With bromelain and papain, almost complete protein solubilisation was observed after 60 min of hydrolysis (TNBS approximately 0.8 AU) whereas with pancreatin, this was achieved after a duration of more than 2 hours.
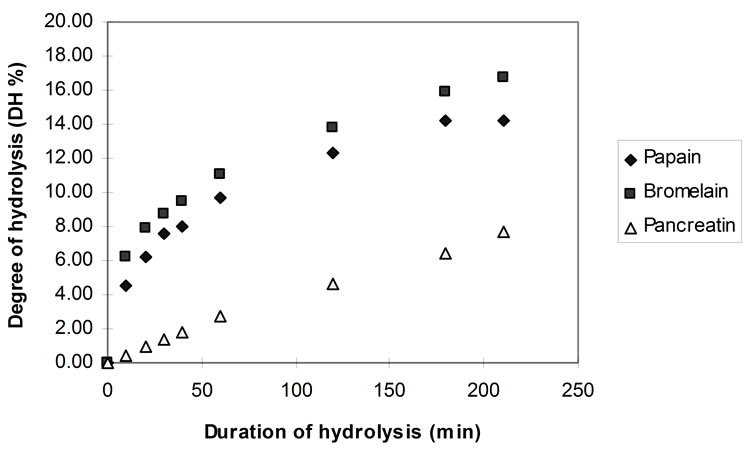
Figure 7. DH during hydrolysis of homogenised fish flesh, using papain, bromelain and pancreatin at pH 7.0 (40˚C, 1% E/S).
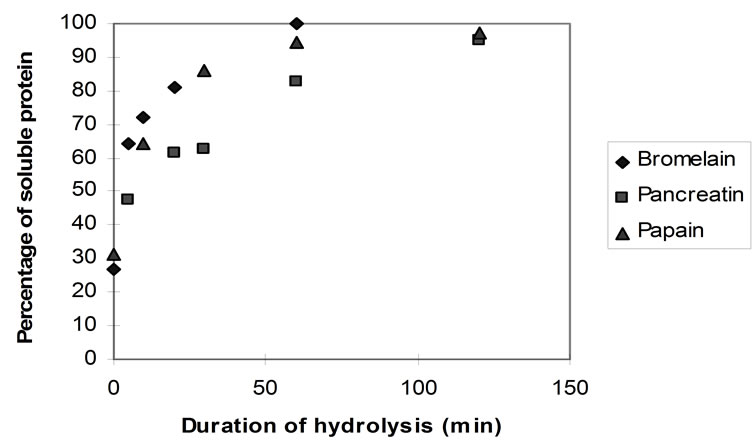
Figure 8. Rate of protein solubilisation of homogenised fish flesh using papain, bromelain and pancreatin (40˚C, 1% E/S, pH-drop).
Comparison with DH charts shows that the hydrolytic breakdown continues even after the protein substrate is rendered completely soluble.
This phenomenon is anticipated since the hydrolysed peptides which become soluble can still act as a substrate for further hydrolysis. This probably occurs from the beginning of hydrolysis where the bulk of the substrate is still intact. The latter is influenced by substrate-enzyme saturation phenomena and it could even affect the hydrolysis qualitatively (substrate saturation/hypothesis of narrowing specificity) [42].
The knowledge of the rate of protein solubilisation under specified hydrolysis conditions (as well as the hydrolysis curve) is very significant from an industrial point of view because this is what denotes the productivity of the process i.e. the amount of recovered (solubilised) protein at a certain time of hydrolysis. Knowledge of the DH may also be important as it was found that at higher DH values, certain functional properties were reduced.
3.11. Production of FPH at Specific DH, Using Model Systems
In order to produce dry protein powders having different DH values, the duration of hydrolysis using papain and bromelain was varied, by arresting at a selected time.
The selection of the three DH values at which hydrolysis was ceased and protein powders were produced (approx. DH: 8, 11 and 16%, after 20, 60 and 120 min respectively) was decided after taking into consideration the hydrolytic curves (showing the rate of hydrolysis) and the curves showing the rate of protein solubilisation, for the two enzymes of greatest industrial potential (papain and bromelain).
Hydrolysis up to 120 minutes and DH 16% (at the given conditions) represented the process at which maximum hydrolysis and protein solubilisation have been achieved, without the need of following the DH and eventually arresting hydrolysis. From an industrial point of view, this is desirable due to high recovery of soluble protein combined with simplicity of operation.
Hydrolysis for 60 min at 11% DH, was selected because almost complete protein solubilisation has also been achieved, but at a slightly lower DH, which might be beneficial to certain functional properties -if such properties are essential for the potential application of the products. However this would be at the expense of simplicity of operation due to the need of accurately controlling hydrolysis and finally employing a method of arresting hydrolysis at a specific DH.
With the 20 min hydrolysis, a substantial amount of protein has been solubilised (approximately 70%) but still retaining a relatively low DH of 8% (larger peptide fragments). This is thought to increase certain functional properties, whilst reducing bitter peptide formation.
3.12. Size Exclusion Chromatography
Figure 9 shows the chromatograms for the three papain FPH, hydrolysed for 20, 60 and 120 min. The samples were chromatographed through a sephadex G-50 gelfiltration column, with a declared fractionation range between 1500 - 30000 Daltons, for proteins and peptides.
Figure 10 shows the elution of the same papain hydrolysates through a sephadex G-15 gel bed, with fractionation limits ranging between 1500 - 0 Daltons.
The chromatograms produced by the samples hydrolysed with bromelain were very similar to those hydrolysed by papain, indicating a similarity in enzyme specificity.
Fractionation using the G-50 gel-bed revealed that the bulk of the hydrolysed peptides lay within the fractionation range of the column (1500 - 30000 Daltons). After 20 min of hydrolysis only a small fraction of solutes was totally excluded from the column, indicating a MW greater than 30000. A significant portion of the hydrolysate however was already smaller than 1500 Daltons, and thus was eluted as one band at the total permeation volume. Upon further hydrolysis, a shift is observed towards smaller molecules with complete elimination of any totally excluded molecules and a marginal increase in the very small molecules (<1500 Daltons). The remaining fractionated portion of solutes is shown to have a fairly broad distribution, with the bulk of solutes having molecular weights between 1500 - 6000 Daltons.
Further analysis using the G-15 gel bed was necessary in order to fractionate and characterise the smaller of the molecules (oligopeptides and free amino-acids).The band eluted first comprised the totally excluded solutes and accounted for the greater part of the injected samples.
Upon continued hydrolysis the shape of this peak decreased in height and became broader, indica-ting the continuing breakdown into smaller molecules. However, this band of molecules remained to be totally excluded (>1800 Dalton).
Two distinctive peaks appeared towards the end of the G-15 chromatograms. These consist of free amino-acids and di/tripeptides. It was shown that from 20 min to 60 min of hydrolysis there is only a small increase in free amino-acids and di/tripeptides. After 120 min of hydrolysis there is almost negligible further increase in these small molecules. This is particularly significant from the point of view of the relation between the production of oligopeptides and the development of bitterness. It has been widely accepted that bitterness is related to the production of certain “bitter” oligopeptides. The negligible increase in the production of oligopeptides
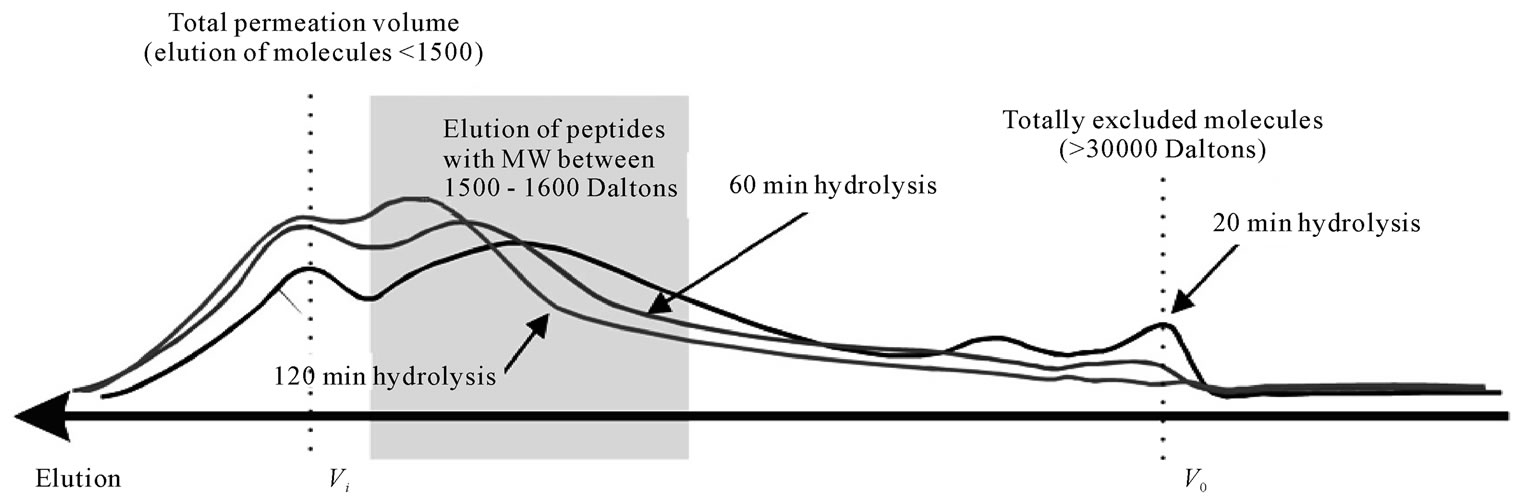
Figure 9. Elution of fish protein powders after hydrolysis with papain for 20, 60 and 120 min through a Sephadex G-50 (ABS 206nm) (40˚C, 1% E/S, pH-drop).
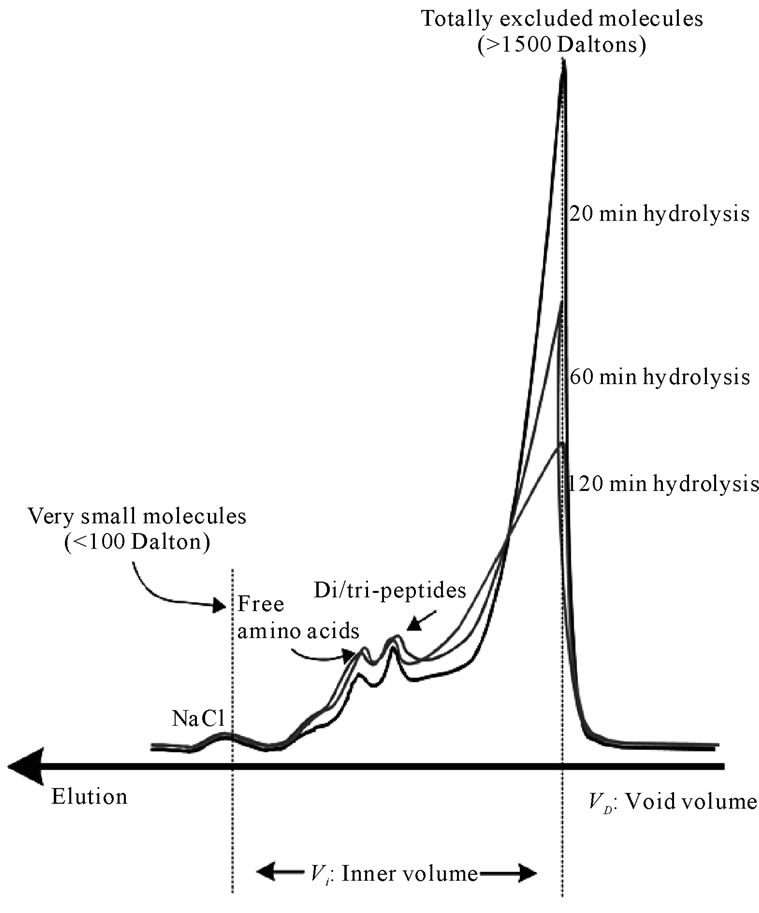
Figure 10. Elution of fish protein powders after hydrolysis with papain for 20, 60 and 120 min through a Sephadex G-15 (ABS 206 nm) (40˚C, 1% E/S, pH-drop).
between 60 and 120 min infers that the development of bitterness may not be exacerbated by the progress of hydrolysis. This differs from the observations on hydrolysis of carp skin using alcalase ® (a broad specificity microbial peptidase) where small peptide increase (150 - 500 Daltons) progressed constantly with the increase of DH [37].
4. Conclusions
Papain and bromelain can be used successfully to hydrolyse cod flesh, at conditions that are envisaged to be applicable at a production scale (i.e. low energy consumption, no pH adjustment, control of degree and duration of hydrolysis).
The pH-stat method provides means of continuously following the rate of hydrolysis (except pH-drop experiments) albeit at prolonged hydrolyses the DH is underestimated by the method.
The TNBS can be used more accurately to estimate the percentage of the peptide bonds cleaved, but requires chemical analysis of a withdrawn sample.
Almost complete protein solubilisation (at approx. 75 g·kg−1 protein concentration) can be easily achieved within an hour, at 40˚C, at 1% E/S, with papain.
Even at low DH, there is di/tri peptide production (to which bitter taste has been ascribed).
In order to avoid excessive peptide cleavage and maintain desired protein functionality, tight control of the DH is required. The use of membrane technology for the continuous removal of peptides from the hydrolysis mixture is thought to be very promising.
The results of this model system have been successfully applied for the production of FPH on a pilot plan scale, using cod frame waste as the substrate.
5. Acknowledgements
The authors greatly acknowledge funding of this research as a European Community RECRAFT project. The Authors also thank Five Star fish Ltd and William Hobson Ltd for collaboration and supply of materials.
REFERENCES
- H. G. Kristinsson and B. A. Rasco, “Fish Protein Hydrolysates: Production, Biochemical, and Functional Properties,” In: F. M. Clydesdale, Ed., Critical Reviews in Food Science and Nutrition, Vol. 40, No. 1, 2000, pp. 43-81. doi:10.1080/10408690091189266
- V. Mohr, “Fish Protein Concentrate Production by Enzymic Hydrolysis,” In: J. Adler-Nissen, B. O. Eggum, L. Munlic and H. S. Olsen, Eds., Biochemical aspects of new protein food, Proceedings of the 11th FEBS meeting, Federation of European Biochemical Societies, Pergamon Press, Oxford, 1978.
- S. Y. Yu and L. K. Tan, “Acceptability of Crackers (‘Keropok’) with Fish Protein Hydrolysate,” International Journal of Food Science and Technology, Vol. 25, No. 2, 1990, pp. 204-208. doi:10.1111/j.1365-2621.1990.tb01075.x
- Y. J. Jeon, H. G. Byun and S. K. Kim, “Improvement of Functional Properties of Cod Frame Protein Hydrolysates Using Ultrafiltration Membranes,” Process Biochemistry, Vol. 35, No. 5, 1999, pp. 471-478. doi:10.1016/S0032-9592(99)00098-9
- Y. Thiansilakul, S. Benjakul and F. Shahidi, “Compositions, Functional Properties and Antioxidative Activity of Protein Hydrolysates Prepared from Round Scad (Decapterus maruadsi),” Food Chemistry, Vol. 103, No. 4, 2007, pp. 1385-1394. doi:10.1016/j.foodchem.2006.10.055
- V. Klompong, S. Benjakul, D. Kantachote and F. Shahidi, “Antioxidative Activity and Functional Properties of Protein Hydrolysate of Yellow Stripe Trevally (Selaroides leptolepis) as Influenced by the Degree of Hydrolysis and Enzyme Type,” Food Chemistry, Vol. 102, No. 4, 2007, pp. 1317-1327. doi:10.1016/j.foodchem.2006.07.016
- R. P. Aguilar, M. A. Mazorra-Manzano and J. C. Ramírez-Suárez, “Functional Properties of Fish Protein Hydrolysates from Pacific Whiting (Merluccius productus) Muscle Produced by a Commercial Protease,” Food Chemistry, Vol. 109, No. 4, 2008, pp. 782-789. doi:10.1016/j.foodchem.2008.01.047
- S. Šližytė, R. Mozuraitytė, O. Martínez-Alvarez, E. Falch, M. Fouchereau-Peron and T. Rustad, “Functional, Bioactive and Antioxidative Aroperties of Hydrolysates Obtained from Cod (Gadus morhua) Backbones,” Process Biochemistry, Vol. 44, No. 6, 2009, pp. 668-677.
- J. Salampessy, M. Phillips, S. Seneweera and K. Kailasapathy, “Release of Antimicrobial Peptides through Bromelain Hydrolysis of Leatherjacket (Meuchenia Sp.) Insoluble Proteins,” Food Chemistry, Vol. 120, No. 2, 2010, pp. 556-560. doi:10.1016/j.foodchem.2009.10.054
- S. Zhong, C. Ma, Y. C. Lin and Y. Luo, “Antioxidant Properties of Peptide Fractions from Silver Carp (Hypophthalmichthys molitrix) Processing by-Product Protein Hydrolysates Evaluated by Electron Spin Resonance Spectrometry,” Food Chemistry, Vol. 126, No. 4, 2011, pp. 1636-1642. doi:10.1016/j.foodchem.2010.12.046
- S. Nalinanon, S. Benjakul, H. Kishimura and F. Shahidi, “Functionalities and Antioxidant Properties of Protein Hydrolysates from the Muscle of Ornate Threadfin Bream Treated with Pepsin from Skipjack Tuna,” Food Chemistry, Vol. 124, No. 4, 2011, pp. 1354-1362. doi:10.1016/j.foodchem.2010.07.089
- I. M. Mackie, “Proteolytic Enzymes in Recovery of Proteins from Fish Waste,” Process Biochemistry, Vol. 9, No. 10, 1974, pp. 12-14.
- W. Tarky, O. P. Agarwala and G. M. Pigott, “Protein Hydrolysate from Fish Waste,” Journal of Food Science, Vol. 38, No. 6, 1973, pp. 917-918. doi:10.1111/j.1365-2621.1973.tb02113.x
- M. Hale and P. E. Bauersfeld, “Preparation of Menhaden Hydrolysate for Possible Use in a Milk Replacer,” Marine Fisheries Review, Vol. 40, No. 8, 1978, pp. 14-18.
- I. M. Mackie, “Fish Protein Hydrolysates,” Process Biochemistry, Vol. 17, No. 1, 1982, pp. 26-27.
- M. Diaz-Castañeda and G. J. Brisson, “Replacement of Skimmed Milk with Hydrolyzed Fish Protein and Nixtamal in Milk Substitutes for Dairy Calves,” Journal of Dairy Science, Vol. 70, No. 1, 1987, pp. 130-140. doi:10.3168/jds.S0022-0302(87)79988-3
- L. R. Beuchat, “Preparation and Evaluation of a Microbiological Growth Medium Formulated from Catfish Waste Peptone,” Journal of Milk and Food Technology, Vol. 37, No. 5, 1974, pp. 277-281.
- F. Guérard, L. Dufossé, D. De La Broise and A. Binet, “Enzymatic Hydrolysis of Proteins from Yellowfin Tuna (Thunnus albacares) Wastes Using Alcalase,” Journal of Molecular Catalysis B: Enzymatic, Vol. 11, No. 4-6, 2001, pp. 1051-1059. doi:10.1016/S1381-1177(00)00031-X
- C. B. Martone, O. P. Borla and J. J. Sánchez, “Fishery by-Product as a Nutrient Source for Bacteria and Archaea Growth Media,” Bioresource Technology, Vol. 96, No. 3, 2005, pp. 383-387. doi:10.1016/j.biortech.2004.04.008
- S. I. Aspmo, S. J. Horn and V. G. H. Eijsink, “Hydrolysates from Atlantic Cod (Gadus morhua L.) Viscera as Components of Microbial Growth Media,” Process Biochemistry, Vol. 40, No. 12, 2005, pp. 3714-3722. doi:10.1016/j.procbio.2005.05.004
- M. B. Hale, “Relative Activities in CommerciallyAvailable Enzymes in the Hydrolysis of Fish Protein,” Food Technology, Vol. 23, No. 1, 1969, pp. 107-110.
- D. P. Sen, N. V. Sripathy, N. L. Lahiry, A. Sreenivasan and V. Subrahmanyan, “Fish Hydrolysates. No. 1: Rate of Hydrolysis of Fish Flesh with Papain,” Food Technology, Vol. 16, No. 5, 1962, pp. 138-142.
- C. G. Beddows and A. G. Ardeshir, “The Production of Soluble Fish Protein Solution for Use in Fish Sauce Manufacture. No. 1: The Use of Added Enzymes,” Journal of Food Technology, Vol. 14, No. 6, 1979, pp. 603-612. doi:10.1111/j.1365-2621.1979.tb00907.x
- S. I. Aspmo, S. J. Horn and V. G. H. Eijsink, “Enzymatic Hydrolysis of Atlantic Cod (Gadus morhua L.) Viscera,” Process Biochemistry, Vol. 40, No. 5, 2005, pp. 1957- 1966. doi:10.1016/j.procbio.2004.07.011
- C. G. Beddows, M. Ismail and K. H. Steinkraus, “The Use of Bromelain in the Hydrolysis of Mackerel and the Investigation of Fermented Fish Aroma,” Food Technology, Vol. 11, No. 4, 1976, pp. 379-388. doi:10.1111/j.1365-2621.1976.tb00736.x
- P. Hevia and S. Olcott, “Flavour of Enzyme-Solubilized Fish Protein Concentrate Fractions,” Journal of Agricultural and Food Chemistry, Vol. 25, No. 4, 1977, pp. 772- 775. doi:10.1021/jf60212a044
- J. Montecalvo, S. M. Constandinides and S. T. Yang, “Enzymatic Modification of Fish Frame Protein Isolate,” Journal of Food Science, Vol. 49, No. 5, 1984, pp. 1305-1309. doi:10.1111/j.1365-2621.1984.tb14975.x
- S. Bhumiratana, C. G. Hill jr. and C. H. Amundson, “Enzymatic Solubilization of Fish Protein Concentrate in Membrane Reactors,” Journal of Food Science, Vol. 42, No. 4, 1977, pp. 1016-1021. doi:10.1111/j.1365-2621.1977.tb12657.x
- A. Gildberg, J. A. Arnesen and M. Carlehög, “Utilisation of Cod Backbone by Biochemical Fractionation,” Process Biochemistry, vol. 38, No. 4, 2002, pp. 475-480. doi:10.1016/S0032-9592(02)00103-6
- M. B. Hale, “Using Enzymes to Make Fish Protein Concentrates,” Marine Fisheries Review, Vol. 36, No. 2, 1974, pp. 15-18.
- G. Lalasides, S. Bostrom and L. B. Sjoberg, “Low Molecular Weight Enzymatic Fish Protein Hydrolysates: Chemical Composition and Nutritive Value,” Journal of Agricultural and Food Chemistry, Vol. 26, No. 2, 1978, pp. 751-756. doi:10.1021/jf60217a045
- G. Lalasides and L. B. Sjorberg, “Two New Methods of Debittering Protein Hydrolyzates and a Fraction of Hydrolyzates with Exceptionally High Contents of Essential Amino-Acids,” Journal of Agricultural and Food Chemistry, Vol. 26, No. 3, 1978, pp. 742-749. doi:10.1021/jf60217a056
- F. Jacobsen and O. lykke-Rasmussen, “Energy-Savings through Enzymatic Treatment of Stickwater in the Fishmeal Industry,” Process Biochemistry, Vol. 19, No. 5, 1984, pp. 165-169.
- G. B. Quaglia and E. Orban, “Influence on Enzymatic Hydrolysis on Structure and Emulsifying Properties of Sardine (Sardina pilchardus) Protein Hydrolysates,” Journal of Food Science, Vol. 55, No. 6, pp. 1990-1571.
- D. R. Baca, M. T. Pena-Vera, M. Diaz-Castaneda, “Production of Fish Protein Hydrolysates with Bacterial Proteases; Yield and Nutritional Value,” Journal of Food Science, Vol. 56, No. 2, 1991, pp. 309-314. doi:10.1111/j.1365-2621.1991.tb05268.x
- G. A. Gbogouri, M. Linder, J. Fanni and M. Parmetier, “Influence of Hydrolysis Degree on the Functional Properties of Salmon by Products Hydrolysates,” Journal of Food Science, Vol. 69, No. 8, 2004, pp. 615-622. doi:10.1111/j.1365-2621.2004.tb09909.x
- J. Wasswa, J. Tang, X.-H. Gu and X.-Q. Yuan, “Influence of the Extent of Enzymatic Hydrolysis on the Functional Properties of Protein Hydrolysates from Grass Carp (Ctenopharyyngodon idella) Skin,” Food Chemistry, Vol. 104, No. 4, 2007, pp. 1698-1704. doi:10.1016/j.foodchem.2007.03.044
- S. Šližyte, E. Daukšas, E. Falch, I. Storrø and T. Rustad, “Yield and Composition of Different Fractions Obtained after Enzymatic Hydrolysis of Cod (Gadus morhua) by-Products,” Process Biochemistry, Vol. 40, No. 3-4, 2005, pp. 1415-1424. doi:10.1016/j.procbio.2004.06.033
- B. Liaset, K. Julshamn and M. Espe, “Chemical Composition and Theoretical Nutritional Evaluation of the Produced Fractions from Enzymic Hydrolysis of Salmon Frames with ProtamexTM,” Process Biochemistry, Vol. 38, No. 12, 2003, pp. 1747-1759. doi:10.1016/S0032-9592(02)00251-0
- S. Nilsang, S. Lertsiri, M. Suphantharika and A. Assavanig, “Optimization of Enzymatic Hydrolysis of Fish Soluble Concentrate by Commercial Proteases,” Journal of Food Engineering, Vol. 70, No. 4, 2005, pp. 571-578.
- S. Šližyte, E. Daukšas, E. Falch, I. Storrø and T. Rustad, “Characteristics of Protein Fractions Generated from Hydrolysed Cod (Gadus morhua) by-Products,” Process Biochemistry, Vol. 40, No. 6, 2005, pp. 2021-2033. doi:10.1016/j.procbio.2004.07.016
- J. Adler-Nissen, “Enzymic Hydrolysis of Food Proteins,” Elsevier Applied Science Publishers Ltd., London, 1986.
- M. Tamura, N. Mori, T. Miyoshi, S. Koyama and H. Kohri, “Practical Debittering Using Model Peptides and Related Compounds,” Agricultural and Biological Chemistry, Vol. 54, No. 1, 1990, pp. 41-51. doi:10.1271/bbb1961.54.41
- J. Adler-Nissen, “Control of the Proteolytic Reaction and of the Level of Bitterness in Protein Hydrolysis Processes,” Journal of Chemical Technology and Biotechnology, Vol. 34, No. 2, 1984, pp. 215-222.
- B. C. Saha and K. Hayashi, “Debittering of Protein Hydrolyzates,” Biotechnology Advances, Vol. 19, No. 5, 2001, pp. 355-370. doi:10.1016/S0734-9750(01)00070-2
- H. Hou, B. Li, X. Zhao, Z. Zhang and P. Li, “Optimization of Enzymatic Hydrolysis of Alaska Pollock Frame for Preparing Protein Hydrolysates with Low-Bitterness,” LWT—Food Science and Technology, Vol. 44, No. 2, 2011, pp. 421-428.
- S. Sathivel, S. M. Smiley, W. Prinyawiwatkul and P. C. Bechel, “Functional and Nutritional Properties of Red Salmon (Oncorhynchus nerka) Enzymatic Hydrolysates,” Journal of Food Science, Vol. 70, No. 6, 2005, pp. 401- 406. doi:10.1111/j.1365-2621.2005.tb11437.x
- P. Bourseau, L. Vandanjon, P. Jaouen, M. ChaplainDerouiniot, A. Massé, F. Guérard, A. Chabeaud, M. Fouchereau-Péron, Y. Le Gal, R. Ravallec-Plé, J. P. Bergé, L. Picot, J. M. Piot, I. Batista, G. Thorkelsson, C. Delannoy, G. Jakobsen and I. Johansson, “Fractionation of Fish Protein Hydrolysates by Ultrafiltration and Nanofiltration: Impact on Peptidic Populations,” Desalination, Vol. 244, No. 1-3, 2009, pp. 303-320. doi:10.1016/j.desal.2008.05.026
- L. Vandanjon, M. Grignon, E. Courois, P. Bourseau and P. Jaouen, “Fractionating White Fish Fillet Hydrolysates by Ultrafiltration and Nanofiltration,” Desalination, Vol. 244, No. 1-3, 2009, pp. 303-320. doi:10.1016/j.desal.2008.05.026
- A. Chabeaud, L. Vandanjon, P. Bourseau, P. Jaouen, M. Chaplain-Derouiniot and F. Guerard, “Performances of Ultrafiltration Membranes for Fractionating a Fish Protein Hydrolysate: Application to the Refining of Bioactive Peptidic Fractions,” Separtation and Purification Technology, Vol. 66, No. 3, 2009, pp. 463-471. doi:10.1016/j.seppur.2009.02.012
- A. Chabeaud, L. Vandanjon, P. Bourseau, P. Jaouen and F. Guérard, “Fractionation by Ultrafiltration of a Saithe Protein Hydrolysate (Pollachius virens): Effect of Material and Molecular Weight Cut-off on the Membrane Performances,” Journal of Food Engineering, Vol. 91, No. 3, 2009, pp. 408-414. doi:10.1016/j.jfoodeng.2008.09.018
- J. Adler-Nissen, “Determination of the Degree of Hydrolysis of Food Protein Hydrolysates by Trinitrobenzenesulphonyc Acid,” Journal of Agricultural and Food Chemistry, Vol. 27, No. 6, 1979, pp. 1256-1262. doi:10.1021/jf60226a042
- P. L. Pellett and V. R. Young, “Nutritional Evaluation of Protein Foods,” The United Nations university world hunger programme food and nutrition bulletin, supplement 4, 1980.
- A. Himonides, “The Improved Utilisation of Fish Waste, with Particular Reference to the Enzymatic Hydrolysis of Fish Frames for the Production of Fish Protein Hydrolysates,” PhD Thesis, Lincoln University, Lincoln-Shire, 2001.
- E. Mihalyi, “Application of Proteolytic Enzymes to Protein Structure Studies,” Vol. 2, 2nd Edition, CRC Press, Boca Raton, 1978.
- T. Suzuki, “Fish and Krill Protein: Processing Technology,” Applied Science Publishers Ltd., Essex, 1981.