American Journal of Plant Sciences
Vol. 4 No. 12C (2013) , Article ID: 41191 , 10 pages DOI:10.4236/ajps.2013.412A3008
Gene Expression: A Review on Methods for the Study of Defense-Related Gene Differential Expression in Plants
![]()
1Universidade de Passo Fundo, Passo Fundo, Brazil; 2Brazilian Agricultural Research Corporation, Passo Fundo, Brazil; 3Universidade Federal do Rio Grande do Sul, Porto Alegre, Brazil.
Email: *alicecasassola@yahoo.com.br
Copyright © 2013 Alice Casassola et al. This is an open access article distributed under the Creative Commons Attribution License, which permits unrestricted use, distribution, and reproduction in any medium, provided the original work is properly cited.
Received October 29th, 2013; revised December 1st, 2013; accepted December 12th, 2013
Keywords: Transcriptomics; cDNA; Metabolic Routes; Plant Defense; Gene Expression; Molecular Biology
ABSTRACT
The plant genes involved in cellular signaling and metabolism have not been fully identified, while the function(s) of many of those which have are as yet incompletely characterized. Gene expression analysis allows the identification of genes and the study of their relationship with cellular processes. There are several options available for studying gene expression, including the use of cDNA and microarray libraries and techniques such as suppression subtractive hybridization (SSH), differential display (DD), RNA fingerprinting by arbitrary primed PCR (RAP), expressed sequence tags (EST), serial analysis of gene expression (SAGE), representational difference analysis (RDA), cDNA-amplified fragment length polymorphism (cDNA-AFLP) and RNA sequencing (RNA-Seq). Focusing on defense-related processes in plants, we present a brief review and examples of each of these methodologies and their advantages and limitations regarding the study of plant gene expression.
1. Introduction
It is known that defense mechanisms in plants are complex. During infection, cellular metabolism can be subverted by the pathogen towards its own survival, suppressing the defense responses of the host and favoring compatibility [1,2]. Although the molecular aspects of the defense responses and infection process in plants are not well characterized, it is known that the defense mechanisms included not only physical barriers, such as trichomes and the closure of stomata, but also the accumulation of antimicrobial compounds and defense-related proteins as well as the hypersensitive response and increased activity of peroxidases [3].
The activation of defense processes in plants is initiated by the recognition by host cells of molecules either within the membrane of pathogens or produced by them. This interaction involves protein phosphorylation, ion fluxes, formation of reactive oxygen species, activation of transcription factors and endogenous signals, such as hormones, and the expression of several genes related to defense [4,5]. The survival of the pathogen in the host not only involves several specific gene products but also depends on the regulation of virulence genes, in that for a successful infection it is necessary that avirulence (avr) genes be expressed at specific stages of infection [6,7].
Understanding the cellular and molecular mechanisms involved in resistance and susceptibility assists in the development of control strategies, identification of pathogens and factors implicated in the progress of a disease. New methods of disease control must be developed, which requires a better understanding of the interactions between pathogens and their hosts, especially the genes expressed during the course of infection [8]. One of the strategies for analysis and study of plant-pathogen interaction is the determination of differential gene expression [9]. Gene regulation via extracellular signals is essential for development, homeostasis, defense and adaptation in plants [10].
The first stage of gene expression is the transcription of genes to produce RNA, the complete set of RNA transcripts produced by the genome at any one time being known as the transcriptome. In the context of this paper, plant transcriptomics refers to the study of differential gene expression and the molecular mechanisms involved in plant-pathogen interactions. Such interactions may enable, disable, increase or decrease the expression of several defense-response related genes, the products of which may be involved in different cellular pathways [9,11-13]. The differences in RNA expression during infection can be determined at both the host and pathogen level [9].
There are several methodologies and strategies that can be used to study gene expression, the most important of which are as follows: complementary DNA (cDNA) libraries; cDNA-amplified fragment length polymorphism (cDNA-AFLP) analysis; microarray analysis; suppressive subtractive hybridization (SSH); differential display (DD); RNA fingerprinting by arbitrary primed PCR (RAP-PCR); expressed sequence tag (EST) sequencing; serial analysis of gene expression (SAGE); representational difference analysis (RDA); and RNA sequencing (RNA-Seq).
2. Methodologies
2.1. Complementary DNA (cDNA) Libraries
Reverse transcriptase is used to convert RNA to cDNA (Figure 1) to create cDNA libraries for use in gene expression studies based on complementarity, in which messenger RNA (mRNA) serves as a template for the identification of a coding gene and the study of its regulation and function [14,15].
This conversion makes use of a mRNA template, dNTPs, reverse transcriptase and oligo dT primers, which anneal to the poly-A tail of the mRNA and start the conversion process. The fragments obtained by this process are then linked to vectors, cloned and sequenced. These sequences can be analyzed for homology by searching existing databases or can be used in microarrays or differential display techniques for the evaluation of differential expression [16]. The sequences can also be used in gene cloning experiments or for the construction of peptide libraries [17,18]. Specific primers which anneal to
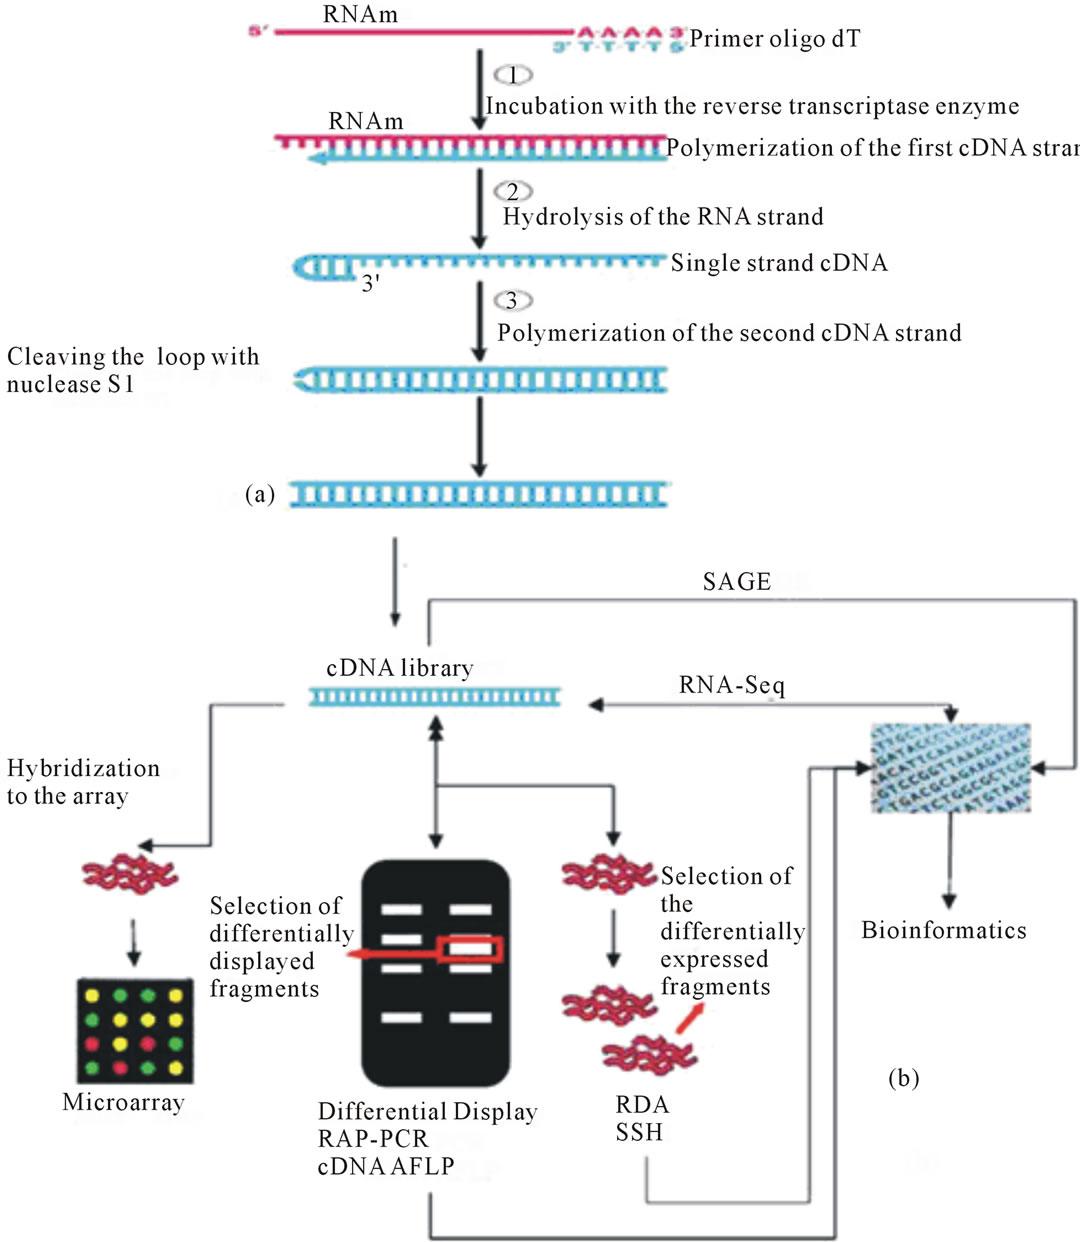
Figure 1. (a) Scheme of the conversion of mRNA into cDNA. Adapted from Addison Wesley Longman, Inc.; (b) Strategies and methodologies to obtain cDNA libraries and perform gene expression studies.
specific regions of the transcript can also be used, but this requires knowledge of the target sequence to be amplified [19].
Various cDNA libraries have been used in the identification and study of gene structure and the elucidation of molecular mechanisms [20]. The differential expression of these sequences allows analysis of the spatial and temporal distribution of gene products in both the pathogen and the host [21].
A study of the compatible and incompatible interactions between wheat and Puccinia striiformis (Pst) produced a cDNA library of 5793 expressed sequences, 2743 of which were unique sequences related to the wheat-Pst compatible interaction [8]. This study also showed that differential expression of genes occurred during different stages of the infection and that these differences were highly dependent on the plant-pathogen interaction type being compatible or incompatible.
Differential gene expression in soybean infected with Phakopsora pachyrhizi has been investigated using cDNA libraries obtained by mRNA sequencing (mRNASeq), with this methodology detecting, among other things, increased expression of Clostridium stercorarium subsp. stercorarium (CSS) copper chaperones, cytochrome P450, O-methyltransferases and reductases, class IV chitinase, β-1,3-glucanases, glutathione S-transferase, lipoxygenase 2, ATP-binding cassette transporters (ABC transporters), dienelactone hydrolases and EF-hand proteins [22]. Most of these genes are directly or indirectly related to defense mechanisms in plants.
For example, chaperones are metal receptor proteins that carry copper to the cytoplasm and intracellular compartments or to specific sites such as copper-dependent enzymes. In plants, three members (CCH, CCS and COX17) of this family have been identified and classified [23]. Copper is involved in several physiological processes, including those related to defense, such as oxidative stress and the synthesis of receptors for the plant hormone ethylene [24,25]. Another example is cytochrome P450, which is involved in cellular detoxification processes such as the detoxification of herbicides and the biosynthesis of cutin and hormones such as brassinosteroids [26]. Class IV chitinases act as fungicides by cleaving glycosidic linkages in fungal walls [27].
2.2. cDNA-Amplified Fragment Length Polymorphism (cDNA-AFLP)
In this technique, RNA is converted to cDNA and subsequently digested with two restriction enzymes, one with rare and the other with frequent cutting. Synthetic linkers are attached to the ends of the cDNA and primers complementary to these synthetic linkers are used to amplify the fragments, which are then visualized and compared on a gel (tester × control). Different sized fragments, representing differentially expressed genes, can then be isolated and sequenced [28].
In a study in which wheat was infected with P. striiformis cDNA-AFLP produced 255 transcripts with expression changes after infection, of which 161 classified as basal because they were induced in both compatible and incompatible interactions while 94 were preferentially expressed in the incompatible interaction [29]. These sequences showed homology to genes related to metabolism and photosynthesis, defense and signal transduction, transcription, transport, protein metabolism and cell structure.
2.3. Microarrays
Microarray hybridization technology allows the study of a large number of genes from different species. Oligonucleotides can be classified into high density microelectronics, macroarray and microarray [30]. Microarrays are based on a glass, plastic or nylon matrix to which specific gene probes are attached in such a manner that complementarity can be obtained between the attached nucleic acid (RNA or DNA) probes and free target complementary nucleic acid labeled with a fluorescent probe, low-intensity or high-intensity fluorescence indicating the low or high expression of a particular gene within a pathosystem or in plants subjected to a specific stress [31,32]. This method allows the simultaneous analysis of thousands of genes of interest, and the identification of both their presence and differential expression, the latter allowing inferences to be made regarding the possible function of specific genes [11].
In diverse wheat tissues infected with Fusarium graminearum this methodology found 185 up-regulated and 16 down-regulated genes, with the up-regulated sequences showing homology to stress and the defense responses related plant genes such as β-1,3-glucanase and class I chitinase as well as oxidative reactions, regulatory functions, protein synthesis and the phenylpropanoid pathway [33].
A study of wheat cultivars infected with F. graminearum was based on a cDNA microarray library of wheat expressed sequence tags (ESTs) obtained using suppressive subtractive hybridization and found 25 differentially expressed wheat UniGenes [34]. The authors reported that the chromosomal segments of wheat cultivars Sumai-3, 2AL and 3BS were important in the activation of the defense mechanisms against F. graminearum, whereas, for example, the loss of segment 3BS reduced the activity of genes encoding the defense-related proteins PR-2 (β-1,3-glucanase), PR-4 (wheatwins) and PR-5 (thaumatin-like proteins).
The expression profile of wheat responding to Puccinia triticina leaf rust was studied by contrasting compatible and incompatible interactions with the isogenic wheat line RL6003, the most contrasting time-points being 6 hours and 24 hours post-inoculation [35]. Several genes associated with photosynthesis, oxidative reactions, signal transduction, ubiquitination and precursors to the shikimate-phenylpropanoid pathway showed differential expression between the compatible and incompatible interactions and appeared to represent key genes in the metabolism of defense [35]. The time-points coincided with the intracellular growth of the fungus and the formation of the septum that separates the infective hyphae from the newly-formed primary haustorial mother cell, which had been described in a previous study [36].
Microarrays have been used in a study to assess differential expression in two barley cultivars (L94, susceptible, Vada, partially resistant) infected or uninfected with Puccinia hordei, with the identification of 802 fragments related to plant genes responsive to this fungus being present in inoculated plants but absent from uninoculated controls [37]. Of the genes detected, 584 were common to both cultivars, 34 were specific to L94, 24 were specific to Vada and 160 showed no homology to genes described in the literature and thus represented potential genes to be studied. When the authors compared the differential expression between the two cultivars they found that 1411 genes were differentially expressed, including, among others, genes for transcription factors, PR proteins, protein receptors, R genes, hormones and protein carriers.
2.4. Suppressive Subtractive Hybridization (SSH)
This method separates differentially expressed genes using hybridization between sequences taken from a sample under study (the “tester”) as compared to a control sample (the “driver”). In other words, tester sequences with no homology with the driver are separated from the pool as differentially expressed [38].
A study of genes involved in the pathogenicity mechanisms of F. graminearum identified four genes (Abc2, Lyp1, Rrr1 and Zbc1) potentially involved in the pathogenesis and development of this fungus in wheat [39].
Another study involving F. graminearum found that 24 genes were differentially expressed in the interaction between this fungus and wheat, of which 8 showed homology with genes from the pathogen and 16 with wheat genes, including those encoding cytochrome P450, actin depolymerizing factors, chitinase, histone H4, pyruvate decarboxylase and S-adenosylmethionine decarboxylase [40].
In a study of the drought response of Leymus secalinus (wikdrye, wheatgrass) 16 sequences were differentially expressed in response to drought, 13 of which showed homology to genes previously described in the literature such as betaine aldehyde dehydrogenase, rice heat shock protein 70, barley ribulose 1,5-bisphosphate carboxylase activator protein and maize ubiquitin conjugating enzyme E2-17Ka [41].
2.5. Differential Display (DD) and RNA Fingerprinting by Arbitrary Primed PCR (RAP-PCR)
Differential display and RAP-PCR are methodologies that involve the conversion of RNA to cDNA followed by PCR amplification using arbitrary (RAP-PCR) or 3’ oligo dT (DD) primers. After this step, the transcribed cDNAs are amplified with a set of arbitrary primers that anneal to the 3’ oligo dT or to the arbitrary primers previously used in the conversion step to cDNA [42]. The amplified products are separated on a gel, with differentially expressed sample and control bands being visualized, extracted and sequenced. The differential expression of such sequences can be confirmed by the real time polymerase chain reaction (RT-PCR) or microarray analysis [43,44].
A study of differential expression in wheat in response to yellow rust using DD showed the differential expression of 14 gene fragments, some of which showed homology with genes involved in the synthesis of antifungal cyclophilins and ubiquitins (Rad6) [45]. These authors also showed that these sequences were involved in the process of programmed cell death and defense and resistance mechanisms.
2.6. Expressed Sequence TAG (EST) Sequencing and Serial Analysis of Gene Expression (SAGE)
The differential expression in these techniques is evaluated by the number of times of a particular sequence randomly selected from a cDNA library/EST or a specific SAGE sequence appears and/or is present or absent in a given library(s) [42]. In SAGE the RNA is converted to cDNA using biotin-linked 3’ oligo dT primers, which are subsequently cleaved with restriction enzymes. The fragments generated are attached to adapters, linked and amplified using PCR. The resulting fragments are concatamers, generated as a result of the joining of various fragments, which are then cloned and sequenced for the analysis of differential expression [46,47].
Research using EST libraries indicates that wheat responding to infection with Blumeria graminis f. sp. tritici showed differential expression of genes coding for the enzymes ferulate 5-hydroxylase (F5H), phenylalanine ammonia lyase (PAL), cinnamoyl-CoA reductase (CCR), caffeic acid O-methyltransferase (CAOMT) and caffeoyl-CoA3-O-methyltransferase (CCOAMT), plus the multifunctional protein with carbamoylphosphate synthetase, aspartate carbamoyltransferase and dihydroorotase activity (CAD). These enzymes are involved in the synthesis of monolignols during different stages of infection, indicating that biosynthesis is an important step in the wheat defense process [48].
2.7. Representational Difference Analysis (RDA)
The RDA technique combines the subtractive libraries, as described by Lisitsyn et al. [49], with PCR amplification, resulting in the enrichment of differentially expressed fragments. In other words, the RNA is converted to cDNA and digested by restriction enzymes. Adapters are attached to the fragments and amplified by PCR. The tester sample is again digested and linked to new adapters, complementary to those previously applied, and only the driver sample is digested with restriction enzymes. The two samples are placed in contact and the hybridization tester-tester only (with additional adapters) is then exponentially amplified [50,51].
A study to evaluate the non-host interaction of Polymyxa graminis on beet confirmed that about 17 genes are up-regulated in this interaction [52]. These genes are related to metabolism (e.g. NADP-isocitrate dehydrogenase), synthesis and protein processing (e.g. ubiquitin extension protein), oxidative stress (e.g. class VII chitinase precursor), cell wall structure and development (e.g. glycine-rich protein) and signal transduction (e.g. serine/ threonine protein kinase). A study to identify differentially expressed genes from Xanthomonas axonopodis pv. citri growing under various conditions on the leaves of sweet orange (Citrus sinensis) plants identified the differential expression of genes related to protein synthesis, cell metabolism, pathogenicity and mobile gene elements [53].
2.8. RNA Sequencing (RNA-Seq)
The sequencing of RNA enables the entire transcriptome of a species to be studied using only small amounts of RNA. The data obtained by RNA-Seq analysis can be analyzed using bioinformatics tools, and it has been reported that this methodology, coupled with real-time PCR (RT-PCR), is one of the most effective strategies to discover new genes [54]. Sequencing-based RNA methodology is a related technique used in gene expression studies where the numerical frequency of a given sequence is determined in the library.
The RNA-Seq technique has several advantages over other methods for a variety of reasons, the most important of which are that it does not rely on prior knowledge of an organisms genes, it can reveal the precise location of the connections between the transcripts and the connectivity between the exons, reveals the existence of single nucleotide polymorphisms (SNPs) and has high sensitivity and reproducibility [55]. However, this technology also has limitations, such as the size of the transcript, where larger transcripts are detected more easily than smaller ones, and the size/type of sequencing for the detection of genes showing lower expression [56]. Statistical programs capable of storing, evaluate and processing this huge amount of data, have also become one of the major challenges encountered when applying this methodology [29,57].
3. Advantages and Limitations
Differential expression analysis is based on gene regulation, that is, under different physiological situations, or when experiencing different stimulation, the regulation of gene expression is increased or decreased. Construction of cDNA libraries is one of the strategies used to obtain differentially expressed sequences and is useful for the identification of genes involved in contrasting situations [8]. The construction of such libraries by differential analysis can be performed using the total RNA and/or fragments obtained by subtractive hybridization techniques, such as always comparing the test sample with a control sample. These sequences are then used in a microarray or subjected to RT-PCR to confirm the differential expression of genes (tester × control) [22].
Microarrays enable the study of many genes simultaneously, in a semi-quantitative way, and have been widely used to address several biological, genetic and biochemical issues [37,58]. Normally this analysis is performed with previously known gene sequences inserted into an array. Nevertheless, this array can be supplied with sequences derived from RNA libraries constructed specifically for the situation under study. In this case the selected sequences should be informative and amenable to physiological or interaction study [58]. However, this type of analysis depends on a prior knowledge of the genetic content of a species, although this information may be often available in existing databases. Furthermore, the sequences available in databases are usually cultivar non-specific and are not PCR amplified, decreasing the sensitivity of this method [29].
The association between microarray methodology and RDA has the potential to increases the efficiency of both obtaining and analyzing differentially expressed sequences because the RNA sequences used are amplified and non-redundant. In addition, they are definitely related to the situation under study since they represent the result of enriched subtraction between the two contrasting situations (tester × control) [58]. This combination simplifies the interpretation of the results and the identification of differentially expressed genes, while allowing rare transcripts to be identified by amplification [29,59].
The cDNA-RDA technique allows the detection of relative (greater than 3 to 5 times) and absolute expression differentials. The caveat is that this methodology requires not only representative and high quality mRNA but is also dependent on the affinity of the oligo (dT), requires cleavage with a varying number of restriction enzymes and can generate false positives if the proportion of the tester × driver is inadequate and the number of amplification cycles are suboptimal [29,59].
Suppressive subtractive hybridization, as with the cDNA-RDA technique, involves the separation of differentially expressed sequences, simplifying the evaluation of the library and reducing costs [60,61]. Studies using the SSH method permit comparisons not only of the function of genes involved in a particular disease but also in the development of plants and/or pathogens and the differential expression of tissue-specific proteins etc. [38]. However, this method only allows the collection of sequences with increased expression or unisequences in a given population, requires a large amount of good quality RNA and involves multiple and repetitive steps [11].
Analyses of RNA fingerprinting using arbitrary primed PCR and differential display is less laborious and has the potential for identifying differentially expressed genes, however there is a high chance of false positives [62,63]. This is because not only are gel bands difficult to analyze but the size of the fragment is not directly associated with a gene. In addition, a single band may represent more than one cDNA or may not be representative of the gene because, among other reasons, a primer may produce sequences with only a small portion of the coding region. Not only this, but there is also the possibility of contamination between samples when the fragment is cut from the gel. All these factors have been discussed in more detail elsewhere [58,64].
A further consideration is that rare transcripts may not be adequately amplified, thus reducing the sensitivity of the test [65]. Nevertheless, the DD technique is simple and relatively sensitive compared to other available methodologies, detects genes with increased and decreased expression and allows you to compare more than two samples at the same time [11,44].
The cDNA-AFLP method functions as a global analysis of differential expression because it requires no prior visual identification of differentially expressed transcripts, broadly covers the transcripts and is a tool for the simultaneously study of genes in both members (pathogen-host) of a pathosystem, thus allowing the characterization and study of the gene expression profile over time [9,28,29,66,67]. However, this technique has the same limitations inherent to DD and RNA fingerprinting by arbitrary primed PCR.
The SAGE methodology enables the assessment of differential gene expression based on the identification and quantification of SAGE sequences in a library. This technique allows the quantitative and cumulative evaluation of plants, pathogens and pathosystems and also generates a large amount of data. Nevertheless, this methodology requires an extensive input of both time and work [58]. Furthermore, SAGE requires a next-generation sequencing platform; it can generate unreliable results due to sequencing errors or by the use of inadequate restriction enzymes or by a specific gene being represented by multiple SAGE sequences [42].
4. Final Considerations
The analysis of differential expression is an effective and efficient strategy for the study of biological cellular pathways, because it allows the detection of genes and the elucidation of molecular mechanisms related to physiological events, signal transduction, primary and secondary metabolism, defense mechanisms, the stress response and other genetic and physiological factors.
There are various methodologies and strategies that can be applied to study differential expression and all the techniques discussed in this article can be used in this type of study, taking into account the limitations inherent to each (Table 1). The choice of technique and/or strat-
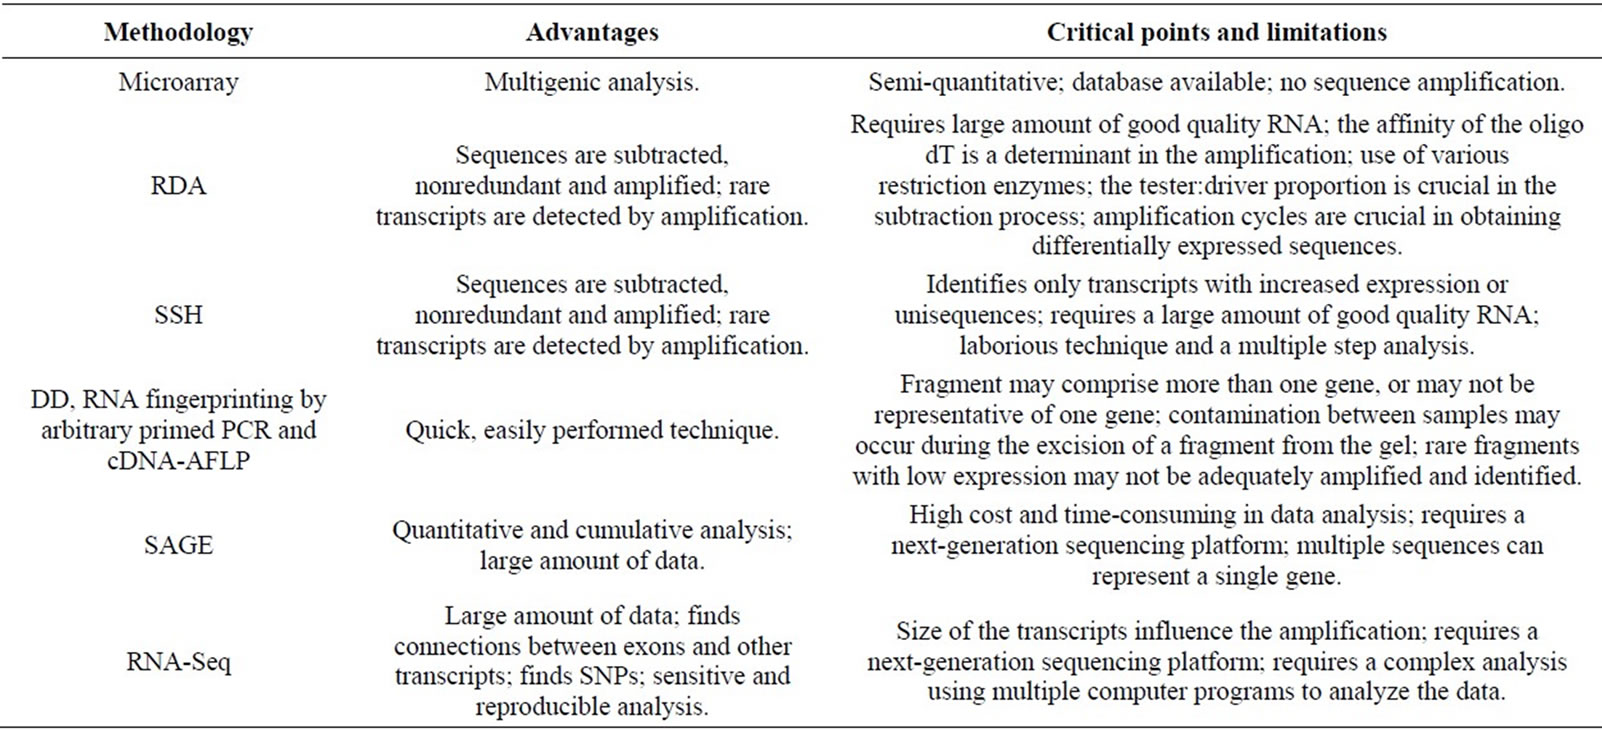
Table 1. Advantages, critical points and inherent limitations of differential expression analysis methodologies.
egy to be used is determined by the available technology plus the cost and the limitations of the analysis. When choosing the techniques used in a particular investigation, these limitations should be minimized methodologically or statistically so that the results are reliable and representative of the situation under study.
REFERENCES
- L. J. Grenville-Briggs and P. Van West, “The Biotrophic Stages of Oomycete-Plant Interactions,” Advances in Applied Microbiology, Vol. 57, 2005, pp. 217-243. http://dx.doi.org/10.1016/S0065-2164(05)57007-2
- R. J. O'Connell and R. Panstruga, “Tête à Tête inside a Plant Cell: Establishing Compatibility between Plants and Biotrophic Fungi and Oomycetes,” New Phytologist, Vol. 171, No. 4, 2006, pp. 699-718. http://dx.doi.org/10.1111/j.1469-8137.2006.01829.x
- J. T. Greenberg and N. Yao, “The Role and Regulation of Programmed Cell Death in Plant-Pathogen Interactions,” Cellular Microbiology, Vol. 6, No. 3, 2004, pp. 201-211. http://dx.doi.org/10.1111/j.1462-5822.2004.00361.x
- R. A. Dixon, M. J. Harrison and C. J. Lamb, “Early Events in the Activation of Plant Defense Responses,” Annual Review of Phytopathology, Vol. 32, 1994, pp. 479-501. http://dx.doi.org/10.1146/annurev.py.32.090194.002403
- L. D. Jeffery and J. D. Jones, “Plant Pathogens and Integrated Defense Responses to Infection,” Nature, Vol. 411, 2001, pp. 826-833. http://dx.doi.org/10.1038/35081161
- J. J. Mekalanos, “Enrironmental Signals Controlling Expression of Virulence Determinants in Bacteria,” Journal of Bacteriology, Vol. 174, No. 1, 1992, pp. 1-7.
- J. F. Miller, J. J. Mekalanos and S. Falkow, “Coordinate Regulation and Sensory Transduction in the Control of Bacterial Virulence,” Science, Vol. 243, No. 4893, 1989, pp. 916-922. http://dx.doi.org/10.1126/science.2537530
- J. Ma, X. Huang, X. Wang, X. Chen, Z. Qu, L. Huang and Z. Kang, “Identification of Expressed Genes during Compatible Interaction between Stripe Rust (Puccinia striiformis) and Wheat Using a cDNA Library,” BMC Genomics, Vol. 10, 2009, pp. 586-597. http://dx.doi.org/10.1186/1471-2164-10-586
- M. Polesani, F. Desario, A. Ferrarini, A. Zamboni, M. Pezzoti, A. Kortekamp and A. Polverari, “cDNA-AFLP Analysis of Plant and Pathogen Genes Expressed in Grapevine Infected with Plasmopara viticola,” BMC Genomics, Vol. 9, 2008, pp. 142-155. http://dx.doi.org/10.1186/1471-2164-9-142
- E. J. Nestler and S. E., “Hyman Regulation of Gene Expression,” In: K. L. Davis, D. Charney, J. T. Coyle and C. B. N., Eds., Neuropsychopharmacology: The Fifth Generation of Progress, Philadelphia, 2002, Chapter 17. http://www.acnp.org/asset.axd?id=38de5fb3-17ef-47f2-a203-57080417d4ec
- K. Al-Taweel and W. G. D. Fernando, “Differential Gene Expression Is a Promising Tool for Understanding of Host-Pathogen Interactions,” The Americas Journal of Plant Science and Biotechnology, Vol. 5, Special Issue, No. 1, 2011, pp. 1-10. http://www.globalsciencebooks.info/JournalsSup/11AmJPSB_5_SI1.html
- P. Moy, D. Qutob, B. P. Chapman, I. Atkinson and M. Gijzen, “Patterns of Gene Expression upon Infection of Soybean Plants by Phytophthora sojae,” Molecular PlantMicrobe Interactions, Vol. 17, No. 10, 2004, pp. 1051- 1062. http://dx.doi.org/10.1094/MPMI.2004.17.10.1051
- H. Yamane, Y. Kashima, T. Ooka, R. Tao and K. Yonemori, “Suppression Subtractive Hybridization and Differential Screening Reveals Endodormancy-Associated Expression of an SVP/AGL24-Type MADS-Box Gene in Lateral Vegetative Buds of Japanese Apricot,” Journal of the American Society for Horticultural Science, Vol. 133, No. 5, 2008, pp. 708-716.
- L. B. Klickstein, “Production of a Subtracted cDNA Library,” Current Protocols in Molecular Biology, Vol. 55, 2001, 25B.1.1-25B.1.8.
- S. Nascimento, E. R. Suarez and M. A. S. Pinhal, “Real Time PCR and RT-PCR Technology and Its Applications in the Medicine Field,” Revista Brasileira de Medicina, Vol. 67, 2010, pp. 7-19. http://www.moreirajr.com.br/revistas.asp?id_materia=4499&fase=imprime
- G. Malone, P. D. Zimmer, G. E. Meneghello, E. Binneck and S. T. Peske, “Prospecção de Genes em Bibliotecas de cDNA,” Revista Brasileira de Agrociências, Vol. 12, 2006, pp. 7-13.
- J. DeRisi, L. Penland, P. O. Brown, M. L. Bittner, P. S. Meltzer, M. Ray, Y. Chen, Y. A. Su and J. M. Trent, “Use of cDNA Microarray to Analyse Gene Expression Patterns in Human Cancer,” Nature Genetics, Vol. 14, No. 4, 1996, pp. 457-460. http://dx.doi.org/10.1038/ng1296-457
- S.-Y. Ying, “Complementary DNA Libraries: An Overview,” Molecular Biotechnology, Vol. 27, No. 3, 2004, pp. 245-252. http://dx.doi.org/10.1385/MB:27:3:245
- L. B. Klickstein, R. L. Neve, E. A. Golemis and J. Gyuris, “Conversion of mRNA into Double-Stranded cDNA,” Current Protocols in Molecular Biology, Vol. 29, 2001, pp. 5.5.1-5.5.14.
- R. P. Wise, M. J. Moscou, A. J. Bogdanove and S. A. Whitham, “Transcript Profiling in Host-Pathogen Interactions,” Annual Review of Phytopathology, Vol. 45, 2007, pp. 329-369. http://dx.doi.org/10.1146/annurev.phyto.45.011107.143944
- R. Guigo, P. Agarwal, J. F. Abril, M. Burset and J. W. Fickett, “An Assessment of Gene Prediction Accuracy in Large DNA Sequences,” Genome Research, Vol. 10, No. 10, 2000, pp. 1631-1642. http://dx.doi.org/10.1101/gr.122800
- A. Tremblay, P. Hosseini, N. W. Alkharouf, S. Li and B. F. Matthews, “Gene Expression in Leaves of Susceptible Glycine max during Infection with Phakopsora pachyrhizi Using Next Generation Sequencing,” Sequencing, Vol. 2011, 2011.
- I. Yruela, “Copper in Plants,” Brazilian Journal of Plant Physiology, Vol. 17, No. 1, 2005, pp. 145-156. http://dx.doi.org/10.1590/S1677-04202005000100012
- T. Balandin and C. Castresana, “AtCOX17, an Arabdopsis Homolog of Yeast Copper Chaperone COX17,” Plant Physiology, Vol. 129, No. 4, 2002, pp. 1852-1857. http://dx.doi.org/10.1104/pp.010963
- P. Company and C. González-Bosch, “Identification of a Copper Chaperone from Tomato Fruits Infected with Botrytis cinerea by Differential Display,” Biochemical and Biophysical Research Communications, Vol. 304, No. 4, 2003, pp. 825-830. http://dx.doi.org/10.1016/S0006-291X(03)00680-6
- A. Morant, S. Bak, B. L. Moller and D. Werck-Reichhart, “Plant Cytochromes P450: Tools for Pharmacology, Plant Protection and Phytoremediation,” Current Opinion in Biotechnology, Vol. 14, No. 2, 2003, pp. 151-162. http://dx.doi.org/10.1016/S0958-1669(03)00024-7
- N. R. Tharanathan and F. S. Kitter, “Chitin-the Undisputed Biomolecule of Great Potential,” Critical Reviews in Food Science and Nutrition, Vol. 43, No. 1, 2003, pp. 61-87. http://dx.doi.org/10.1080/10408690390826455
- C. W. Bachem, R. S. Hoeven Van Der, S. M. de Bruijn, D. Vreugdenhil, M. Zabeau and R. G. Visser, “Visualization of Differential Gene Expression Using a Novel Method of RNA Fingerprinting Based on AFLP: Analysis of Gene Expression during Potato Tuber Development,” The Plant Journal, Vol. 9, No. 5, 1996, pp. 745-753. http://dx.doi.org/10.1046/j.1365-313X.1996.9050745.x
- X. Wang, W. Liu, X. Chen, C. Tang, Y. Dong, J. Ma, X. Huang, G. Wei, Q. Han, L. Huang and Z. Kang, “Differential Gene Expression in Incompatible Interaction between Wheat and Stripe Rust Fungus Revealed by cDNA-AFLP and Comparison to Compatible Interaction,” BMC Plant Biology, Vol. 10, 2010, pp. 9-23. http://dx.doi.org/10.1186/1471-2229-10-9
- C. Guindalini and S. Tufik, “Use of Microarrays in the Search of Gene Expression Patterns—Application to the Study of Complex Phenotypes,” Revista Brasileira de Psiquiatria, Vol. 29, No. 4, 2007, pp. 370-374. http://dx.doi.org/10.1590/S1516-44462007000400014
- W. P. Kuo, T. K. Jenssen, A. J. Butte, L. Ohno-Machado and I. S. Kohane, “Analisys of Matched mRNA Measurements from Two Different Microarray Technologies,” Bioinformatics, Vol. 18, No. 3, pp. 405-412. http://dx.doi.org/10.1093/bioinformatics/18.3.405
- W. P. Kuo, E. Y. Kim, J. Trimarchi, T. K. Jenssen, S. A. Vinterbo and L. Ohno-Machado, “A Primer on Gene Expression and Microarrays for Machine Learning Researchers,” Journal of Biomedical Informatics, Vol. 37, No. 4, 2004, pp. 293-303. http://dx.doi.org/10.1016/j.jbi.2004.07.002
- S. Golkari, J. Gilbert, S. Prashar and D. Procunier, “Microarray Analysis of Fusarium graminearum-Induced Wheat Genes: Identification of Organ-Specific and Differentially Expressed Genes,” Plant Biotechnology Journal, Vol. 5, 2007, pp. 38-49. http://dx.doi.org/10.1111/j.1467-7652.2006.00213.x
- S. Golkari, J. Gilbert, T. Ban and J. D. Procunier, “QTLSpecific Microarray Gene Expression Analysis of Wheat Resistance to Fusarium Head Blight in Sumai-3 and Two Susceptible NILs,” Genome, Vol. 52, No. 5, 2009, pp. 409-418. http://dx.doi.org/10.1139/G09-018
- B. Fofana, T. W. Banks, B. McCallum, S. E. Strelkov and S. Cloutier, “Temporal Gene Expression Profiling of the Wheat Leaf Rust Pathosystem Using cDNA Microarray Reveals Differences in Compatible and Incompatible Defence Pathways,” International Journal of Plant Genomics, Vol. 2007, 2007, p. 17542. http://dx.doi.org/10.1155/2007/17542
- G. Hu and F. H. J. Rijkenberg, “Scanning electron Microscopy of Early Infection Structure Formation by Puccinia recondita f. sp. tritici on and in Susceptible and Resistant Wheat Lines,” Mycological Research, Vol. 102, No. 4, 1998, pp. 391-399. http://dx.doi.org/10.1017/S0953756297005054
- X. Chen, R. E. Niks, P. E. Hedley, J. Morris, A. Druka, T. C. Marcel, A. Vels and R. Waugh, “Differential Gene Expression in Nearly Isogenic Lines with QTL for Partial Resistance to Puccinia hordei in Barley,” BMC Genomics, Vol. 11, No. 1, 2010, pp. 629-641. http://dx.doi.org/10.1186/1471-2164-11-629
- L. Diatchenko, S. Lukyanov, Y. F. Lau and P. D. Siebert, “Suppressive Subtraction Hybridization: A Versatile Method for Identifying Differentially Expressed Genes,” Methods in Enzymology, Vol. 303, 1999, pp. 349-380. http://dx.doi.org/10.1016/S0076-6879(99)03022-0
- R. S. Goswami, J. R. Xu, F. Trail, K. Hilburn and H. C. Kistler, “Genomic Analysis of Host-Pathogen Interaction between Fusarium graminearum and Wheat during Early Stages of Disease Development,” Microbiology, Vol. 152, No. 6, 2006, pp. 1877-1890. http://dx.doi.org/10.1099/mic.0.28750-0
- L. Kong, J. M. Anderson and H. W. Ohm, “Induction of Wheat Defense and Stress-Related Genes in Response to Fusarium graminearum,” Genome, Vol. 48, No. 1, 2005, pp. 29-40. http://dx.doi.org/10.1139/g04-097
- M. Yang, M. Jiang, Y. Cai, Y. Ye and W. Lihuan, “Construction and Analysis of Suppression Subtractive Hybridization Library for Leymus secalinus Exposed to Drought Stress,” African Journal of Biotechnology, Vol. 11, No. 73, 2012, pp. 13775-13781. http://dx.doi.org/10.5897/AJB12.319
- D. E. Moody, “Genome Techniques: An Overview of Methods for the Study of Gene Expression,” Journal of Animal Science, Vol. 79, 2001, pp. 128-135. http://www.journalofanimalscience.org/content/79/E-Suppl/E128
- J. D. Alves, T. T. Vantoai and N. Kaya, “Differential Display: A Novel PCR-Based Method for Gene Isolation and Cloning,” Revista Brasileira de Fisiologia Vegetal, Vol. 10, No. 2, 1998, pp. 161-164. http://www.cnpdia.embrapa.br/rbfv/pdfs/v10n2p161.pdf
- P. Liang and A. B. Pardee, “Differential Display of mRNA by PCR,” In: F. M. Ausubel, R. Brent, R. E. Kingston, D. D. Moore, J. G. Seidman, J. A. Smith and K. Struhl, Eds., Current Protocols in Molecular Biology, John Wiley and Sons, New York, 1994, pp. 15.8.1-15.8.8.
- O. Bozkurt, T. Unver and M. S. Akkaya, “Genes Associated with Resistance to Wheat Yellow Rust Disease Identified by Differential Display Analysis,” Physiological and Molecular Plant Pathology, Vol. 71, No. 4-6, 2007, pp. 251-259. http://dx.doi.org/10.1016/j.pmpp.2008.03.002
- V. E. Velculescu, L. Zhang, B. Vogelstein and K. W. Kinzler, “Serial Analysis of Gene Expression,” Science, Vol. 270, No. 5235, 1995, pp. 484-487. http://dx.doi.org/10.1126/science.270.5235.484
- M. Yamamoto, T. Wakatsuki, A. Hada and A. Ryo, “Use of Serial Analysis of Gene Expression (SAGE) Technology,” Journal of Immunological Methods, Vol. 250, No. 1-2, 2001, pp. 45-66. http://dx.doi.org/10.1016/S0022-1759(01)00305-2
- N. H. Bhuian, G. Selvaraj, Y. Wei and J. King, “Gene Expression Profiling and Silencing Reveal that Monolignol Biosynthesis Plays a Critical Role in Penetration Defense in Wheat against Powdery Mildew Invasion,” Journal of Experimental Botany, Vol. 60, No. 2, 2009, pp. 509-521. http://dx.doi.org/10.1093/jxb/ern290
- N. Lisitsyn, N. Lisitsyn and M. Wigler, “Cloning the Differences between Two Complex Genomes,” Science, Vol. 259, No. 5097, 1993, pp. 946-951. http://dx.doi.org/10.1126/science.8438152
- L. D. Bowler, M. Hubank and M. G. Spratt, “Representational Difference Analysis of cDNA for the Detection of Differential Gene Expression in Bacteria; Development Using a Model of Iron-Regulated Gene Expression in Neisseria meningitides,” Microbiology, Vol. 145, No. 12, 1999, pp. 3529-3537.
- M. Hubank and D. G. Schatz, “Identifying Differences in mRNA Expression by Representational Difference Analysis of cDNA,” Nucleic Acids Research, Vol. 22, No. 25, 1994, pp. 5640-5648. http://dx.doi.org/10.1093/nar/22.25.5640
- G. R. D. McGrann, L. D. Martin, C. S. Kingsnorth, M. J. C. Asher, M. J. Adams and E. S. Mutasa-Göttgens, “Screening for Genetic Elements Involved in the Nonhost Response of Sugar Beet to the Plasmodiophorid Cereal Root Parasite Polymyxa graminis by Representational Difference Analysis,” Journal of General Plant Pathology, Vol. 73, No. 4, 2007, pp. 260-265. http://dx.doi.org/10.1007/s10327-007-0024-x
- A. Mehta and Y. B. Rosatto, “Identification of Differentially Expressed Genes of Xanthomonas axonopodis pv. citri by Representational Difference Analysis of cDNA,” Genetics and Molecular Biology, Vol. 28, No. 1, 2005, pp. 140-149. http://dx.doi.org/10.1590/S1415-47572005000100024
- C. Howlad, A. Tanzer, J. Chrast, F. Kokocinski, T. Derrien, N. Walters, J. M. Gonzales, A. Frankish, B. L. Aken, T. Hourlier, J.-H. Vogel, S. White, S. Searle, J. Harrow, T. J. Hubbard, R. Guigo and A. Reymond, “Combining RT-PCR-seq and RNA-Seq to Catalog All Genic Elements Encoded in the Human Genome,” Genome Research, Vol. 22, 2012, pp. 1698-1710. http://dx.doi.org/10.1101/gr.134478.111
- Z. Wang, M. Gerstein and M. Snyder, “RNA-Seq: A Revolutionary Tool for Transcriptomics,” Nature Reviews Genetics, Vol. 10, No. 1, 2009, pp. 57-63. http://dx.doi.org/10.1038/nrg2484
- S. Tarazona, F. García-Alcalde, J. Dopazo, A. Ferrer and A. Conesa, “Differential Expression in RNA-seq: A Matter of Depth,” Genome Research, Vol. 21, No. 12, 2011, pp. 2213-2223. http://dx.doi.org/10.1101/gr.124321.111
- M. A. Busby, C. Stewart, C. A. Miller, K. R. Grzeda and G. T. Marth, “Scotty: A Web Tool for Designing RNASeq Experiments to Measure Differential Gene Expression,” Bioinformathics, Vol. 29, No. 5, 2013, pp. 656- 657. http://dx.doi.org/10.1093/bioinformatics/btt015
- E. J. Kok, N. L. W. Franssen-Van Hal, L. N. W. Winnubst, E. H. M. Kramer, W. T. P. Dijksma, H. A. Kuiper and J. Keijer, “Assessment of Representational Difference Analysis (RDA) to Construct Informative cDNA Microarrays for Gene Expression Analysis of Species with Limited Transcriptome Information, Using Red and Green Tomatoes as a Model,” Journal of Plant Physiology, Vol. 164, No. 3, 2007, pp. 337-349. http://dx.doi.org/10.1016/j.jplph.2006.02.013
- M. Hubank and D. G. Schatz, “cDNA Representational Difference Analysis: A Sensitive and Flexible Method for Identification of Differentially Expressed Genes,” Methods in Enzymology, Vol. 303, 1999, pp. 325-349. http://dx.doi.org/10.1016/S0076-6879(99)03021-9
- A. Bernardo, G. Bai, P. Guo, K. Xiao, A. C. Guenzi and P. Ayoubi, “Fusarium graminearum-Induced Changes in Gene Expression between Fusarium Head Blight-Resistant and Susceptible Wheat Cultivars,” Functional & Integrative Genomics, Vol. 7, No. 1, 2007, pp. 69-77. http://dx.doi.org/10.1007/s10142-006-0028-1
- D. V. Rebrikov, S. M. Desai, P. D. Siebert and S. A. Lukyanov, “Supression Subtractive Hybridization,” Methods in Molecular Biology, Vol. 258, 2004, pp. 107-134.
- D. Bauer, P. Warthoe, M. Rohde and M. Stauss, “Detection and Differential Display of Expressed Genes by DDRT-PCR,” PCR Methods and Applications, Vol. 4, No. 2, 1994, pp. 97-108. http://dx.doi.org/10.1101/gr.4.2.S97
- L. Sompayrac, S. Jane, T. C. Burn, D. G. Tenen and K. J. Danna, “Overcoming Limitations of the mRNA Differential Display Technique,” Nucleic Acids Research, Vol. 23, No. 22, 1995, pp. 4738-4739. http://dx.doi.org/10.1093/nar/23.22.4738
- D. Callard, B. Lescure and L. Mazzolini, “A Method for Elimination of False Positives Generated by mRNA Differential Display Technique,” Biotechniques, Vol. 16, No. 6, 1994, pp. 1096-1103.
- D. J. Bertioli, U. H. A. Schlichter, M. J. Adams, P. R. Burrows, H. H. Steinbin and J. F. Antoniw, “An Analysis of Differential Display Shows a Strong Bias Towards High Copy Number mRNAs,” Nucleic Acids Research, Vol. 23, No. 21, 1995, pp. 4520-4523. http://dx.doi.org/10.1093/nar/23.21.4520
- W. E. Durrant, O. Rowland, P. Piedras, K. E. HammondKosack and J. D. Jones, “cDNA-AFLP Reveals a Striking Overlap in Race-Specific Resistance and Wound Response Gene Expression Profiles,” Plant Cell, Vol. 12, No. 6, 2000, pp. 963-977.
- L. Zhang, H. Meakin and M. Dickinson, “Isolation of Genes Expressed during Compatible Interactions between Leaf Rust (Puccinia triticina) and Wheat Using cDNAAFLP,” Molecular Plant Pathology, Vol. 4, No. 6, 2003, pp. 469-477. http://dx.doi.org/10.1046/j.1364-3703.2003.00192.x
NOTES
*Corresponding author.