American Journal of Plant Sciences
Vol.3 No.2(2012), Article ID:17558,8 pages DOI:10.4236/ajps.2012.32028
Evaluation of Expression Stability of Candidate References Genes among Green and Yellow Pea Cultivars (Pisum sativum L.) Subjected to Abiotic and Biotic Stress
![]()
1Department of Crop and Soil Sciences, Washington State University, Pullman, USA; 2Grain Legume Genetics and Physiology Research Unit, United States Department of Agriculture-Agricultural Research Service, Washington State University, Pullman, USA.
Email: gopesh_saha@wsu.edu
Received October 25th, 2011; revised December 26th, 2011; accepted January 4th, 2012
Keywords: RT-qPCR; Reference Genes; Sclerotinia sclerotiorum; Cold Treatment; Pisum sativum
ABSTRACT
Dry pea (Pisum sativum L.) is grown as human and animal feed throughout the world. Large yield losses in pea due to biotic and abiotic stresses compel an improved understanding of mechanisms of stress tolerance and genetic determinants conditioning these tolerances. The availability of stably expressed reference genes is a prerequisite for examining differential gene expression. The objective of this study was to examine the expression profile of several candidate reference genes across a broad range of commercial pea cultivars. Expression profiles of five candidate reference genes; 18s rRNA, actin, TIF, β tubulin-2 and β tubulin-3 were examined. Relative quantifications of candidate reference genes were estimated from control plants, plants after 48 h of cold treatment, and plants 24 and 48 h after inoculation with Sclerotinia sclerotiorum, the causal agent of white mold disease of pea. RT-qPCR was performed on cDNA synthesized from three food grade spring peas, Ariel, Aragorn, and Sterling, and two spring yellow peas, Delta and Universal, which are used as animal feed. Analysis of variance (ANOVA) of CT values demonstrated significant variation between varieties and treatments under cold and disease conditions. The most abundant transcripts among tested reference genes were for 18s rRNA. Stability analysis indicated that TIF and β tubulin-3 genes were the most stably expressed candidate genes under both cold and disease stress and could serve as reference genes across a wide range of pea cultivars.
1. Introduction
Dry pea (Pisum sativum L.; 2N = 2X = 14) is a highly nutritious cool season food legume grown throughout the temperate regions of the world, often as a rotational crop in small grain-legume production systems. During 2007- 2009, global dry pea production averaged nearly 10 million MT/yr on over 6 million Ha [8]. Of all nations, Canada annually has the highest production value of dry pea, followed by India, US, and France [8].
Although the inheritance of traits in pea has been examined since the emergence of the field of transmission genetics, the genetic control of many important traits, including resistance to various diseases and abiotic stresses, is not well understood. Traits that continue to be the focus of breeding efforts in dry pea include resistance to numerous diseases caused by viruses and fungi, tolerance to cold and drought stress, seed characteristics and processing qualities.
The development of improved pea varieties will be accelerated by a greater understanding of the genetic factors conditioning trait expression. Associating the differential expression of specific genes with distinct phenotypic states may suggest involvement of the genes in the expression of a trait in differential levels. Differences in gene expression are usually detected by quantitative analysis of the production of specific mRNA transcripts. Advances in plant molecular biology have allowed for a continual technical evolution in gene expression studies in pea. Bai et al. (2005; 2006) [1,2] examined the expression of PsPK2, a kinase involved in auxin transport in pea, in response to treatment with several different plant hormones. Northern blots were simultaneously hybridized to a probe specific for PsPK2 and a probe for the control DEAD box (RNA helicase) gene. The intensity of hybridization signals on Northern blots was quantified by densitometry and differences in gene expression among treatments were observed as the ratio of the signal intensities of PsPk2/DEAD box. However, numerous technical challenges associated with this method, including the requirement for large quantities of RNA and standardization of blotting, probe labeling, hybridization and blot washing conditions limits its application for gene expression analysis in terms of both sensitivity and sample size.
Fondevilla et al. (2011) [9] used microarrays to examine differential gene expression in pea in response to infection by Mycosphaerella pinodes. Unlike Northern Blot analysis, which allows for at best the examination of only a few transcripts at a time, microarray analysis allows for the simultaneous examination of thousands of genes in a single reaction. A total of 346 transcripts were differenttially expressed between the partially resistant line P665 and the susceptible cultivar Messire. Reverse transcripttase quantitative real time PCR (RT-qPCR) was used to validate the expression profile of 10 selected genes that were determined to be differentially regulated by microarray analysis. Genes corresponding to peroxidase, disease resistance response protein 39 (DRR230-b), and glutathione S-transferase were found to be up-regulated in the resistant line P665. Down-regulated genes in P665 in response to inoculation with M. pinodes included 12-oxophytodienoate reductase, ferredoxin-NADP+ reductase, and chlorophyll a/b binding protein.
RT-qPCR is considered the most precise method for quantifying gene expression and verifying differential transcription profiles identified by microarray analysis [19]. Variation in results of gene expression analysis may arise from biological variation in gene expression among samples and also from technical variation encountered during processes of RNA extraction, cDNA synthesis, real time PCR and sample loading. Researchers typically attempt to account for this variation by normalizing expression levels relative to levels observed for “reference” genes [18]. Broadly applicable reference genes should be equally expressed in a wide range of genetic backgrounds, tissue types, and treatments.
Reference genes used to examine gene expression in plants have been primarily “housekeeping” genes, which code for proteins or ribosomal RNAs that function in basic cellular processes such as cytoskeleton formation, glycolysis, transcription, and translation. These reference genes, which include actin, ubiquitin, 18s rRNA, tubulin, and glyceraldehyde-3-phosphate dehydrogenase (GAPDH) were initially chosen based on their historical usage as reference genes for northern blot analysis [11]. However, several studies have shown that expression profiles of housekeeping genes vary across tissues and experimental conditions in several plant species, including Arabidopis [4,17], potato (Solanum tuberosum L.) [13], ryegrass (Lolium temulentum L.) [7,12] and maritime pine (Pinus pinaster L.) [10]. Inappropriate use of reference genes to normalize RT-qPCR data can adversely impact results and conclusions [5].
The use of RT-qPCR to examine gene expression in pea is limited. Panda and Matsumoto (2010) [14] used the 18s rRNA gene as a reference gene to examine differential gene expression in roots and leaves of the green pea cultivar Alaska in response to aluminum stress. Die et al. (2010) [6] examined several reference genes for stable expression in the yellow pea cultivar Athos in response to osmotic stress, exposure to the auxin 2,4-D, and colonization by the parasitic plant Orobanche crenata Forssk. Over all treatments, β tubulin and phosphoprotein phosphatase 2A (PP2A) were the most stable reference genes, while the least stable were genes coding for 18s rRNA and GAPDH. It was recommended that GAPDH not be used for analysis of leaf samples while elongation factor-1α (ef-1α) only should be used for the examination of leaf tissue. Subsequently, Fondevilla et al. (2011) [9] subsequently used β tubulin, histone H3 and GAPDH as reference genes to examine gene expression in response to infection by M. pinodes in the winter pea cultivar Messire and P665, a wild P. sativum spp. syriacum.
Yellow pea cultivars, such as Athos, are primarily intended for use as animal feed. The focus of the pea breeding efforts by the USDA-ARS in both spring and winter green peas is to develop food grade cultivars suitable for human consumption. The objectives of this study were to evaluate several different candidate reference genes among three food grade spring green cultivars and two animal feed spring yellow cultivars. The reference genes were validated in replicated experiments using leaf tissue obtained from three treatments: 1) non-treated control; 2) after 48 h of cold stress (4˚C); and 3) 24 and 48 h after inoculation with Sclerotinia sclerotiorum.
2. Materials and Methods
2.1. Plant Materials and Stress Conditions
Two experiments were set up in sixty 8 × 8 cm2 pots in perlite soil with five pea varieties, which included three food grade spring green peas, Ariel, Aragorn, and Sterling, and two spring yellow peas, Delta and Universal, which are used as animal feed. In the first experiment, each cultivar was grown in three replicated pots with four plants/pot for both control and cold treatments. Plants were grown under normal growing conditions (14 h day length, 20˚C - 24˚C) for two weeks. Plants were then placed in a dark cold room (4˚C) for 48 h, while control plants were maintained under normal growing conditions.
The second experiment consisted of two sets of plants with each set including three replicated pots for each cultivar with four plants/pot. Plants were grown for two weeks (14 h day length, 20˚C - 24˚C). An isolate of S. sclerotiorum obtained from pea was grown in the dark at 25˚C on potato dextrose agar (PDA). 14 day old plants were inoculated with S. sclerotiorum by placing a mycelial plug of the pathogen, taken from the margin of an actively growing culture, on the 4th node. The mycelial plug was attached to the stem with parafilm at the attachment point where the leaf branches from the main stem [15]. One set of plants (SWM 24) was harvested 24 h after inoculation and the other set (SWM 48) was harvested 48 h after inoculation.
2.2. RNA Extraction
Total RNA was extracted from the entire leaf and stem tissues above the 4th node collected from two randomly selected plants from each of the treated and control pots using the RNA Fast Kit (MP Biomedicals; Solon, OH) according to manufacturer’s instruction. Briefly, 250 mg - 300 mg tissue samples were processed using the “Fast prep” instrument for 120 s at a setting of 6.0., and were centrifuged at 12,000 × g for 5 min at 4˚C. The supernatant was transferred to a new tube and extracted with an equal volume of chloroform. The upper (aqueous) phase was transferred to a new tube and RNA was precipitated with absolute ethanol. Samples were centrifuged at 12,000 × g for 15 min at 4˚C, RNAs were washed with 75% cold ethanol, dissolved in DEPC-H2O and stored at –80˚C. RNA was quantified by spectrophotometry and diluted in DEPC-H2O to a final concentration of 200 ng/μl.
2.3. cDNA Synthesis
cDNA was synthesized using the “iScript cDNA synthesis kit” (Bio-Rad, Hercules, CA) according to manufacturer’s instructions. Briefly, cDNA was synthesized in 20 μl reactions containing 4 μl of 5× iScript reaction mix, 1 μl iScript reverse transcriptase, 10 μl of nuclease free water and 1 μg RNA. The following thermocycling profile was used for cDNA synthesis: 25 min at 25˚C, 30 min at 42˚C and 5 min at 85˚C. cDNAs were quantified by spectrophotometry and diluted in ddH2O to 100 ng/μl.
2.4. Design of Primers for Amplifying Candidate Reference Genes
Partial or total mRNA sequences from P. sativum for 18s rRNA, actin, translation initiation factor (TIF), β tubulin-2, and β tubulin-3 were obtained from the NCBI database. Forward and reverse primers were designed by analyzing each sequence with Primer Express® Software v3.0 (Table 1). Primer pairs produced amplicons ranging in size from 58 - 65 bp with a Tm value ranging from 58˚C to 60˚C. Tm value was calculated based on nearest neighbor method where thermodynamic relationship between entropy, enthalpy, free energy and temperature were considered.
2.5. Relative Quantification and Analysis
Relative quantification was performed using the “CFX 96 Real Time PCR system” (Bio-Rad). Preliminary experiments were conducted for normalization using temperature gradients with different primer and template concentrations. PCR efficiency was also calculated for each gene by10 fold dilution of cDNA (five dilution series for 18s rRNA and four series for all other genes) in 3 replicate reactions per dilution. The PCR efficiency of each primer pair was calculated based on the following formula: % Efficiency = (10–1/slope – 1)100 [16].
cDNA samples from six individual plants of each cultivar were examined for each treatment (control, cold stress, 24 h and 48 h after inoculation with S. sclerotiorum). Each cDNA sample was amplified in two separate qPCR reactions for each candidate reference gene. qPCR was performed in 20 μl reactions containing 10 μl sso fast evagreen supermix (Bio-Rad). For 18s rRNA and β tubulin-2, final PCR conditions included 18.75 nM forward and reverse primer (Table 1), while reactions to amplify actin, TIF and β tubulin-3 contained 37.5 nM forward and reverse primers. 25 ng cDNA was used as
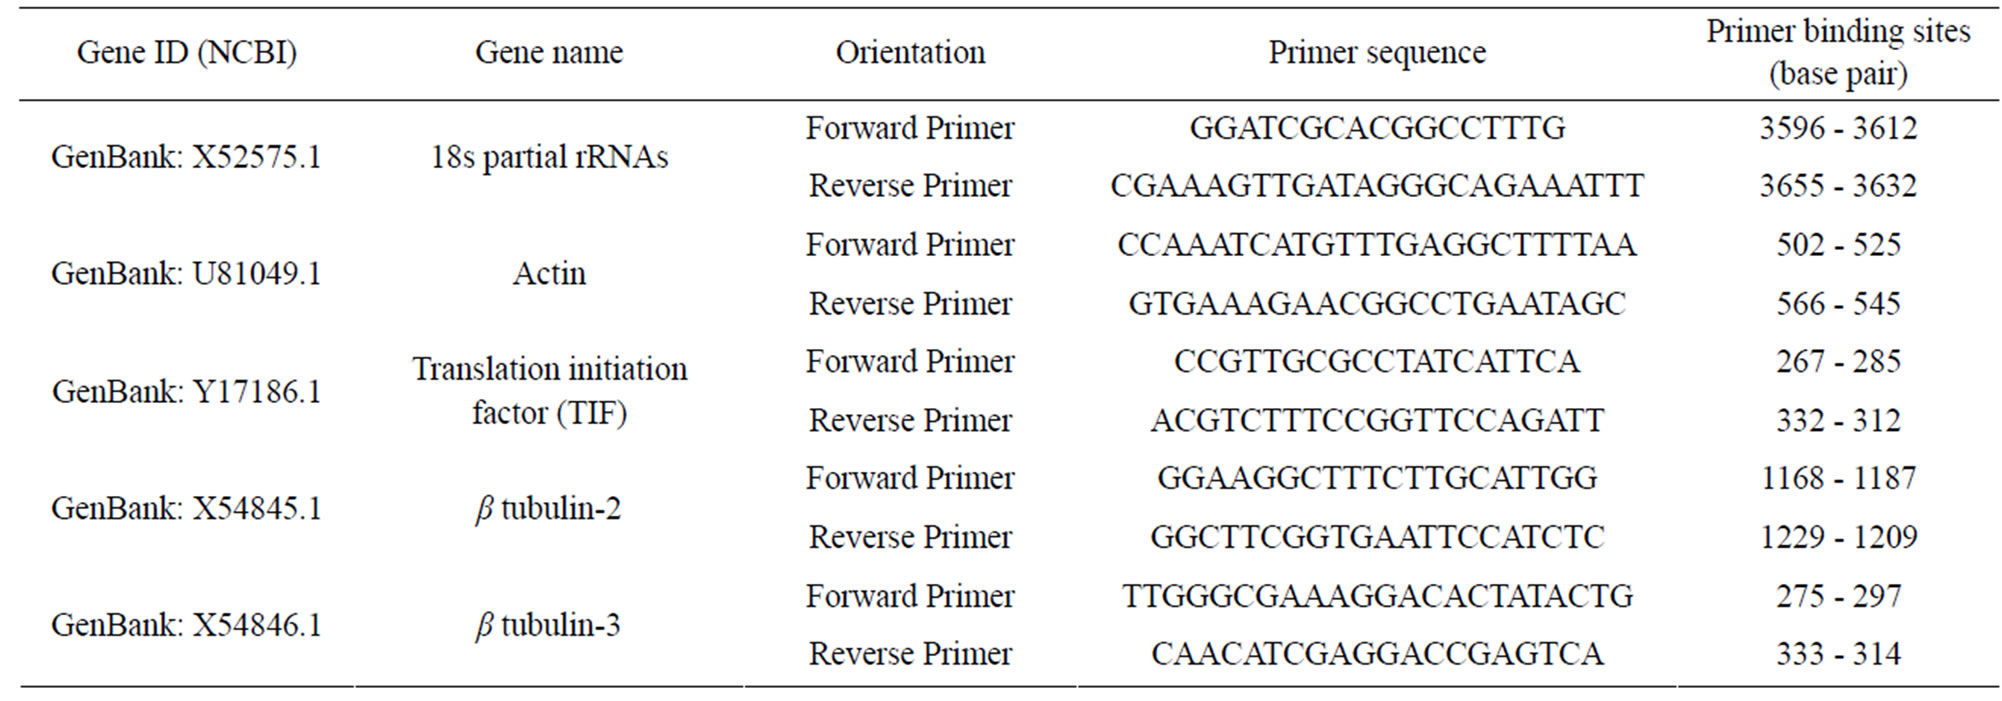
Table 1. Gene ID and primer sequences of housekeeping genes in peas.
template in PCR to amplify 18s rRNA, while 250 ng cDNA was used as template to amplify actin, TIF, β tubulin-2 and β tubulin-3. PCR thermocycling conditions consisted of a single step at 95˚C for 60 s for enzyme activation, followed by 39 cycles consisting of 95˚C for 5 s followed by 60˚C for 20 s for annealing and extension. At the end of the final extension step, a melting curve analysis was conducted within a temperature range from 65˚C to 95˚C at an incremental increase of 0.5˚C for 5 s, where melting temperature (Tm) of PCR product were calculated to discriminate between specific product, primer-dimer and any other artifacts (Table 2). CT values (the cycle at which fluorescence crosses the threshold) were transformed to relative quantities using the comparative CT method described by Vandesompele et al. (2002) [18]. The expression stability (M) of each reference gene was determined using geNorm 3.5 software [18].
3. Results
We examined expression profiles of five different genes: 18s rRNA, actin, β tubulin-2, β tubulin-3 and translation initiation factor (TIF) (Table 1) across five different pea cultivars. The pea cultivars included three food grade green peas, Ariel, Aragorn, and Sterling, and two yellow peas used as animal feed, Delta and Universal. Melting curve analysis indicated that all five primer pairs (Table 1) amplified a single product (data not shown). The five primer pairs amplified their respective targets at efficiencies ranging from 96.6% (β tubulin-2) to 115.6% (TIF) (Table 2). Correlation coefficients between fluorescence and DNA quantity varied between primer pairs from 0.971 (Actin) to 0.999 (18s rRNA). Melting temperatures of amplicons ranged between 75.5 (Actin) to 84.5˚C (18s rRNA) (Table 2).
3.1. Analysis of Variance of CT
The combined analysis of variance of CT of control versus cold and control versus SWM (S. sclerotiorum treated pea plants) was calculated from data obtained for 12 RTqPCR reactions for each cultivar for each reference gene (6 plants/cultivar; 2 RT-qPCR/plant). ANOVA showed significant variation in CT value between varieties and treatments (control versus cold and control versus SWM) for all reference genes examined (Table 3). The mean CT values for all the transcripts except 18s rRNA ranged from 23.81 to 30.28 in cold versus SWM (Table 4). Across all varieties there were significant differences in CT values between cold and SWM for TIF, β tubulin-2 and β tubulin-3 (Table 4), but significant differences in CT values were observed only for TIF and β tubulin-3 genes after 24 and 48 h of inoculation with S. sclerotiorum (Table 5). Among the genes examined, actin had the highest average CT values, suggesting that it is the least abundant of the targeted transcripts. The mean CT values for 18s rRNA were approximately 12.5, even though only 10% of the amount of cDNA was used as template compared to the amount of template used for all other putative reference genes. These results suggest that 18s rRNA template was far more abundant than any other templates.
3.2. Stability of Candidate Reference Genes during Cold Stress
The cold stress consisted of placing 2 wk old plants in a
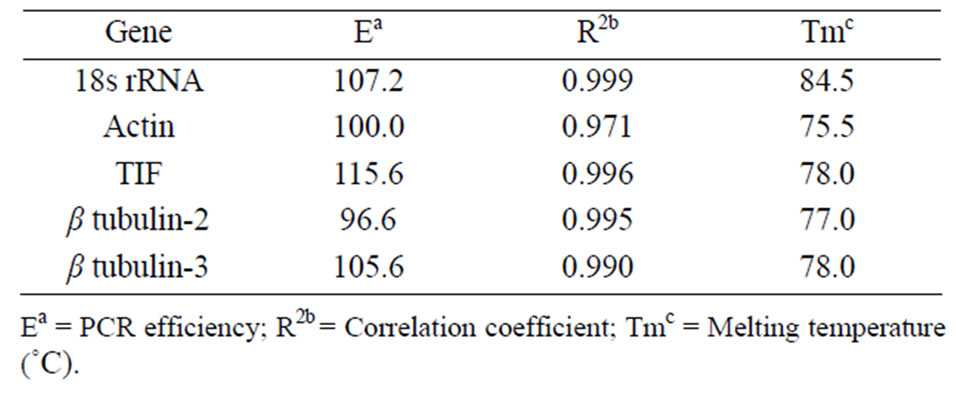
Table 2. PCR efficiency, correlation coefficient and melting temperature of housekeeping genes in peas.

Table 3. Combined ANOVA of CT: control versus cold and control versus SWM.
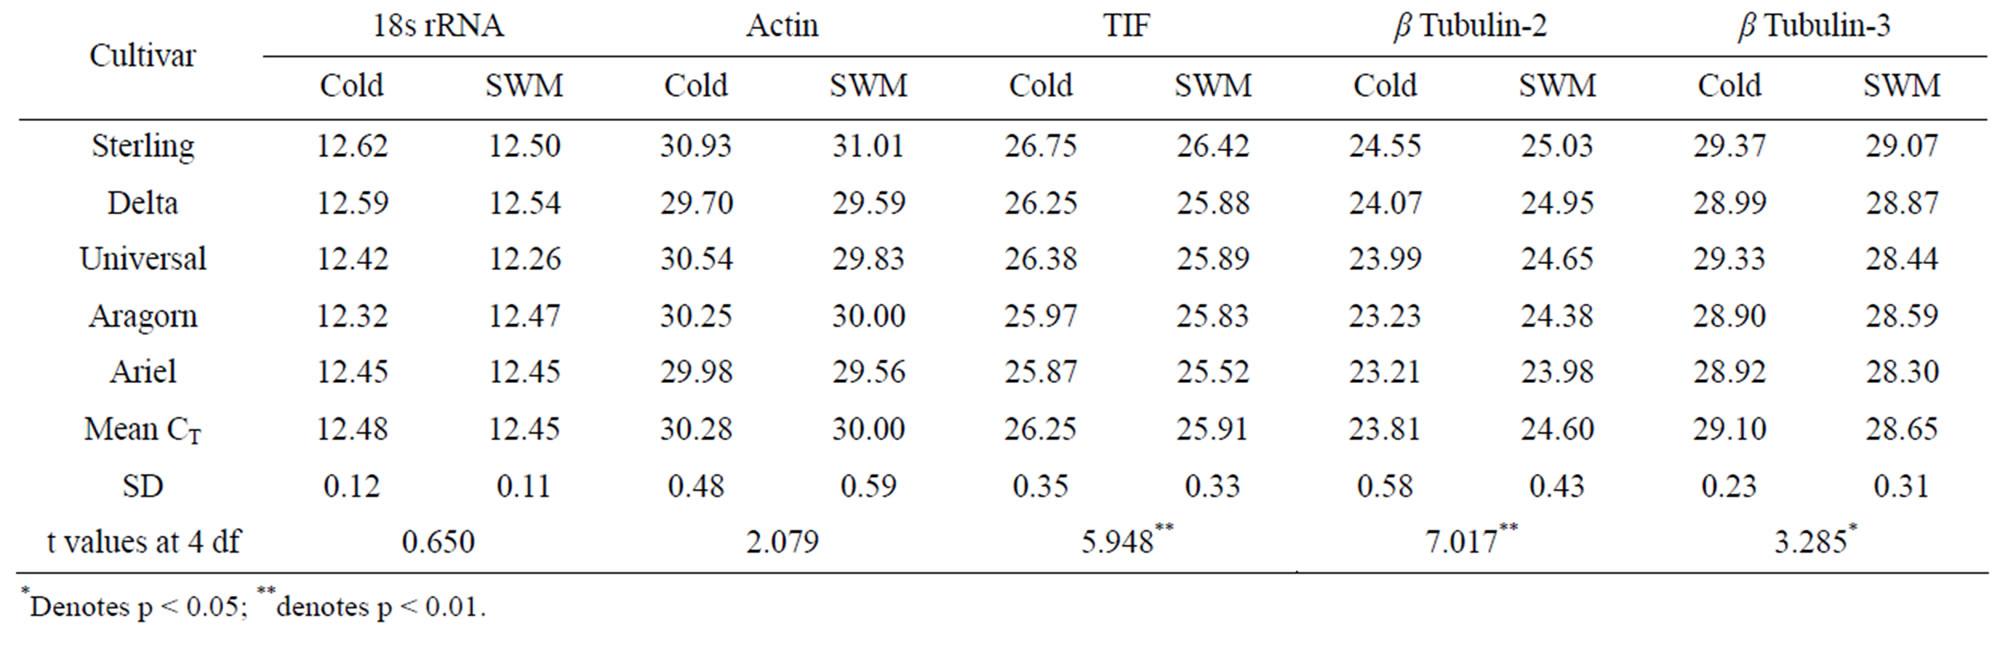
Table 4. Combined CT and paired t-test between cold versus SWM.
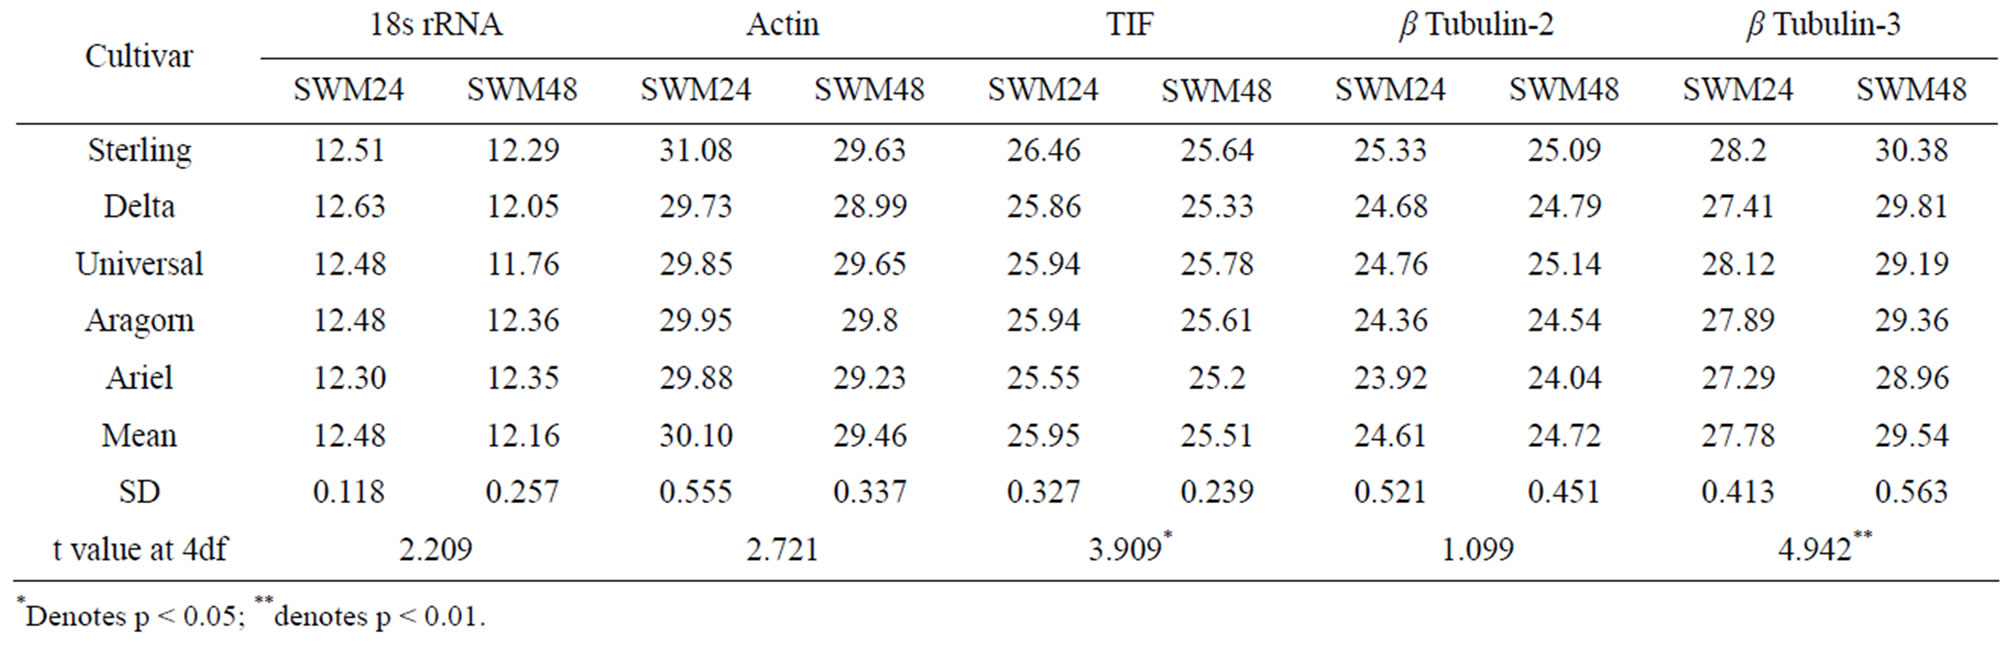
Table 5. Combined CT and paired t-test between SWM24 versus SWM48.
dark cold room (4˚C) for 48 h. Plants were only be mildly affected by this stress, exhibiting slight stunting compared to control plants but no other symptoms. The most stable genes were identified by the step wise exclusion of highest M values. In the control versus cold study, TIF and β tubulin-3 were the most stable genes (M = 0.312; Table 6) and the third most stable gene was 18s rRNA (M = 0.396). Only β tubulin-2 had M > 1.0, which suggests it is not a suitable reference gene for this application [18].
The minimum number of reference genes needed for normalization was determined by calculation of pairwise variations (Vn/n +1). A value of Vn/n +1 ≥ 0.15 suggests that there will be a significant effect on normalization due to the inclusion of an additional reference gene [18]. In the comparison between control and cold treated plants the variations between (v2/3): β tubulin-3/18s rRNA, (v3/4): 18s rRNA/actin, and (v4/5): actin/β tubulin-2 were 0.124, 0.136, and 0.198 respectively (Figure 1). These results suggest that only two reference genes, TIF and β tubulin-3, are necessary for accurate normalization of RTqPCR data obtained from both yellow and green control peas and peas subjected to cold stress for 48 h.
3.3. Stability of Candidate Reference Genes during Infection by S. sclerotiorum
Compared to cold stress, inoculation of plants with a mycelial plug of S. sclerotiorum resulted in severe symptoms on all plants. Within 48 h all plants had a necrotic lesion at the point of infection that grew down the stem. In a comparison between expression in control plants and plants 24 h after inoculation with S. sclerotiorum (SWM24), similar to results observed for control versus cold treated plants, the two most stable reference genes were TIF and β tubulin-3 (M = 0.380) and the third most stable gene was 18s rRNA (Table 6). Actin was the least stable gene (M = 0.642). However, the stability values (M) for both β tubulin-2 and actin were less than 1.0, suggesting that they also could be used as reference genes for this application.
In control versus SWM24 conditions, the variations between (v2/3): β tubulin-3/18s rRNA, (v3/4): 18s rRNA/β tubulin-2 and (v4/5): β tubulin-2/actin were 0.138, 0.118 and 0.117 respectively (Figure 2) These results suggest that only two reference genes, TIF and β tubulin-3, are necessary for accurate normalization of RT-qPCR data obtained from both yellow and green pea
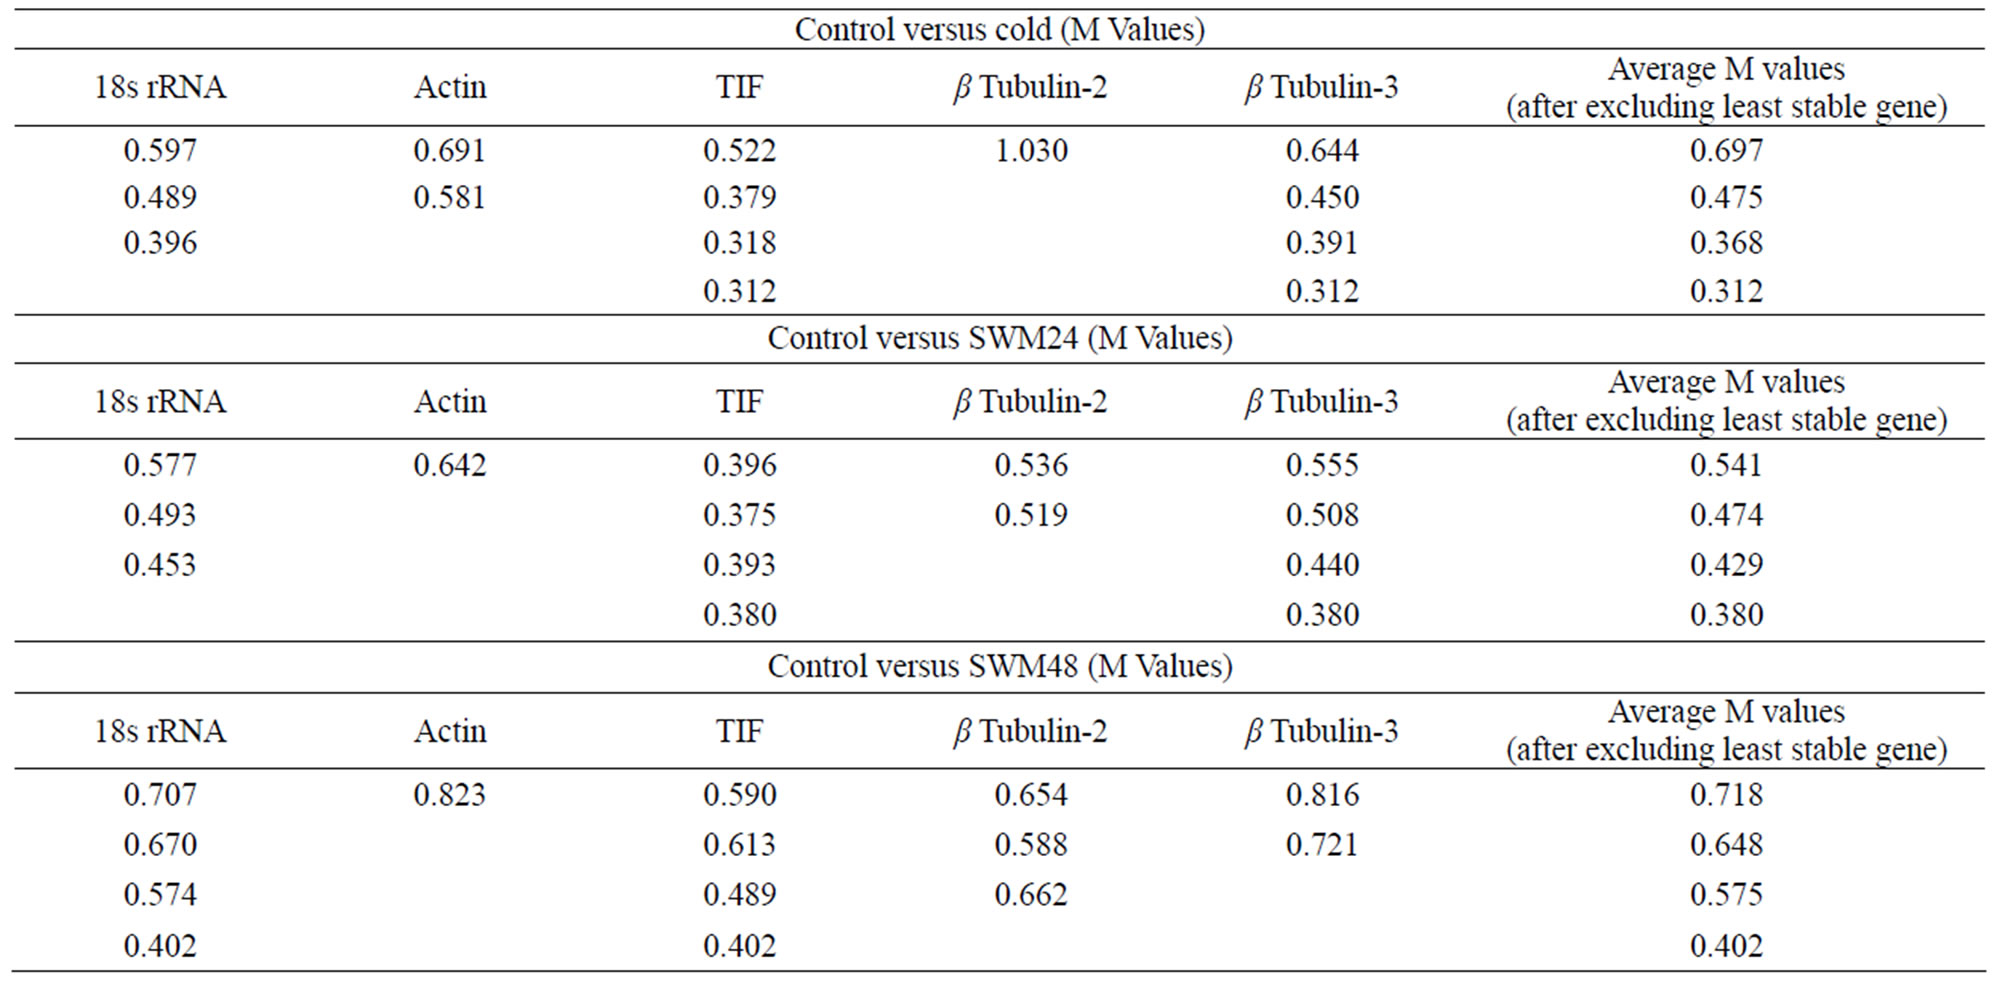
Table 6. Stability (M) values and average M value after step wise elimination of least stable values.

Figure 1. Pairwise variations to determine the optimal number of reference genes for normalization in control versus cold conditions.
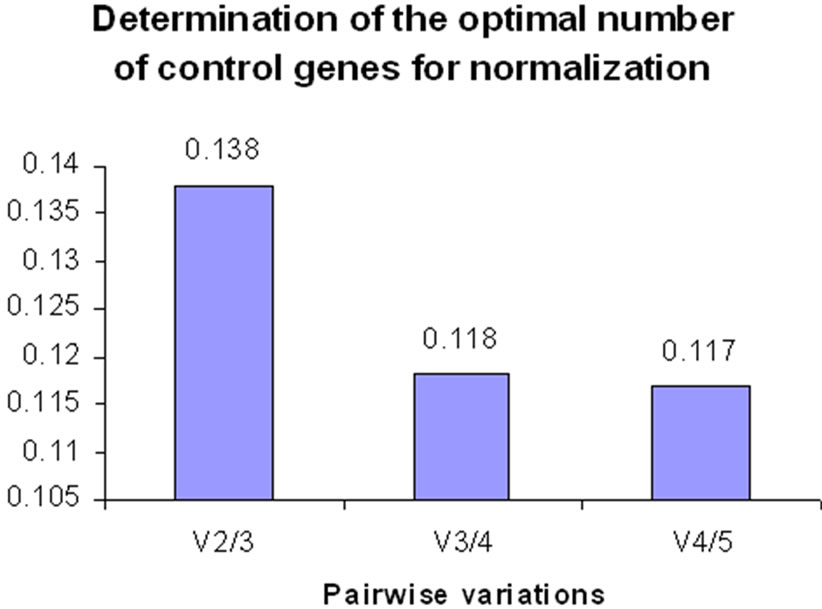
Figure 2. Pairwise variations to determine the optimal number of reference genes for normalization in control versus SWM24 conditions.
controls and peas 24 h after inoculation with S. sclerotiorum.
In a comparison between expression in control plants with expression in plants 48 h after inoculation with S. sclerotiorum (SWM48), the two most stable reference genes were TIF and 18s rRNA (M = 0.402), followed by β tubulin-2 (Table 6). β tubulin-3 and actin were the least stable genes, but both had stability values less than 1.0, suggesting they could also be used as reference genes for this application. The variations (v2/3): 18s rRNA/pea tubulin-2, (v3/4): pea tubulin-2/β tubulin-3, and (v4/5): β-tubulin-3/actin were 0.212, 0.166 and 0.148 respectively in control versus SWM48 (Figure 3). These results suggest that a minimum of four reference genes (TIF; 18s rRNA; β tubulin-2, and β tubulin-3) are required for accurate normalization of data obtained from both yellow and green pea controls and peas 48 h after inoculation with S. sclerotiorum.
4. Discussion
RT-qPCR is a very useful technique for gene expression studies because of its specificity and precision. Stably expressed internal reference genes are considered critical for estimating small expression differences between treatment effects [18]. However, in most plant species reference genes have only been validated for a single cultivar. Cruz et al. (2009) [3] examined using potential reference genes with leaves of three different coffee (Coffea arabica) cultivars. The stability ranking of candidate reference genes based on results obtained using multiple cultivars was very different than rankings observed based on
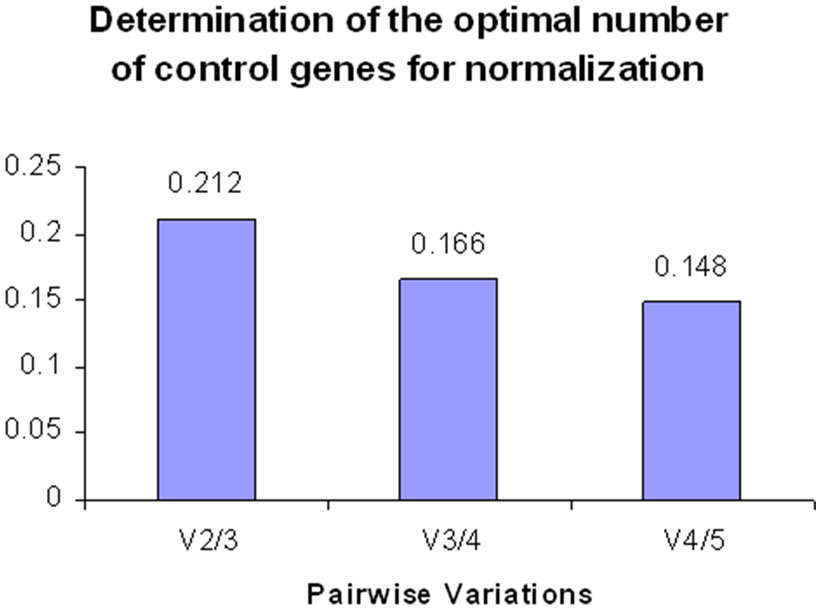
Figure 3. Pairwise variations to determine the optimal number of reference genes for normalization in control versus SWM 48 conditions.
an examination of different organs of a single cultivar or stressed leaves or roots of a single cultivar. These results suggested that reference genes validated for a single genotype may not be the most appropriate reference gene for use when comparing gene expression across diverse cultivars. Multiple candidate reference genes for use with pea have only been validated against a single yellow animal feed cultivar, Athos [6], although the 18s rRNA gene has also been used as a reference gene to examine the yellow animal feed pea cultivar Alaska [14]. In this study, we examined several different candidate reference genes among three food grade spring green cultivars and two animal feed spring yellow cultivars. The validation of reference genes using genetically distinct pea cultivars may promote confident usage of these genes for studying differential gene expression across a broad range of pea genotypes.
Expression profiles of five candidate reference genes; 18s rRNA, actin, TIF, β tubulin-2 and β tubulin-3 were examined from control plants, plants after 48 h of cold treatment, and plants 24 and 48 h after inoculation with S. sclerotiorum, the causal agent of white mold of pea and other legumes. Significant cultivar and treatment affects were observed for all genes in the cases of both cold and disease treatments (Table 3). These results suggest that ideally reference genes should be validated for use in specific genetic backgrounds and treatments, and that multiple reference genes be used for realizing accurate normalization of real time PCR data.
Stability values (M) were calculated to identify the best reference genes, with lower M values indicating more stable gene expression [18]. Pairwise variation analysis was conducted to determine the optimal number of reference genes required to examine differential gene expression in pea in response to cold stress or disease. Consistent results were observed between the cold treatment and after 24 h of inoculation with S. sclerotiorum. In both experiments the most stable reference genes were TIF and β tubulin-3, followed by 18s rRNA. In addition, in both experiments the pairwise variation (v) at (v2/3) was less than 0.15 (Figures 1 and 2). This indicates that TIF and β tubulin-3 were the most suitable reference genes for normalizing data obtained after cold stress and 24 h after inoculation with S. sclerotiorum, and the inclusion of a third additional reference gene would not enhance the normalization of real time PCR data.
A comparison of control plants and plants 48 h after inoculation with S. sclerotiorum produced results that indicated four reference genes were required for accurate normalization, these genes being TIF, 18s rRNA, β tubulin-2, and β tubulin-3 (Figure 3). Paired t-test between SWM24 and SWM48 detected significant variation between the two time points in the expression of β tubulin-3, which was ranked the most stable gene at SWM 24 but was the second least stably expressed gene at SWM 48 (Tables 5 and 6). Significant variation between the two time points was also detected for expression of TIF, but it maintained its position as one of the two most stable genes, although its stability was lower at 48 h than at 24 h. It should be noted that 48 h after inoculation with S. sclerotiorum all of the plants were effectively deceased, exhibiting complete collapse of the stem at the site of inoculation. The extreme disease reaction may be responsible for variance in gene expression observed at 48 h. In the future, inoculation techniques will need to be modified, perhaps by using less rich media than 1× Potato Dextrose Agar to produce mycelial plugs for inoculation, or waiting until the plants are older to inoculate.
The ability to detect differential gene expression patterns associated with specific phenotypic states affords a greater understanding of genetic factors conditioning trait expression. Although preliminary evidence of differential gene expression can be detected through microarrays and whole transcriptome sequencing, more precise quantitation of differences in expression levels of specific transcripts are typically realized using RT-qPCR. The results presented in this report suggest that the primers we developed to amplify fragments of the pea TIF and β tubulin-3 genes should be considered for use as reference genes for the examination of differential gene expressionin response to abiotic or biotic stress among a broad range of food and feed grade pea genotypes.
REFERENCES
- F. Bai and D. A. DeMason, “Hormone Interactions and Regulation of Unifoliata, PsPK2, PsPIN1 and LE Gene Expression in Pea (Pisum sativum) Shoot Tips,” Plant and Cell Physiology, Vol. 47, No. 7, 2006, pp. 935-948. doi:10.1093/pcp/pcj066
- F. Bai, J. C. Watson, J. Walling, N. Weeden, A. A. Santner and D. A. DeMason, “Molecular Characterization and Expression of PsPK2, a PINOID-Like Gene from Pea (Pisum sativum),” Plant Science, Vol. 168, No. 5, 2005, pp. 1281-1291. doi:10.1016/j.plantsci.2005.01.005
- F. Cruz, S. Kalaoun, P. Nobile, C. Colombo, J. Almeida, L. M. G. Barros, E. Romano, M. F. Grossi-de-sa, M. Vaslin and M. Alves-Ferreira, “Evaluation of Coffee Reference Genes for Relative Expression Studies by Quantitative Real-time RT-PCR,” Molecular Breeding, Vol. 23, No. 4, 2009, pp. 607-616. doi:10.1007/s11032-009-9259-x
- T. Czechowski, M. Stitt, T. Altmann, M. K. Udvardi and W. R. Scheible, “Genome-Wide Identification and Testing of Superior Reference Genes for Transcript Normalization in Arabidopsis,” Plant Physiology, Vol. 139, No. 1, 2005, pp. 5-17. doi:10.1104/pp.105.063743
- K. Dheda, J. F. Huggett, J. S. Chang, L. U. Kim, S. A. Bustin, M. A. Johnson, G. A. W. Rook and A. Zumla, “The Implications of Using an Inappropriate Reference Gene for Real-Time Reverse Transcription PCR Data Normalization,” Analytical Biochemistry, Vol. 344, No. 1, 2005, pp. 141-143. doi:10.1016/j.ab.2005.05.022
- J. V. Die, B. Roman, S. Nadal and C. I. Gonzalez-Verdejo, “Evaluation of Candidate Reference Genes for Expression Studies in Pisum sativum under Different Experimental Conditions,” Planta, Vol. 232, No. 1, 2010, pp. 145-153. doi:10.1007/s00425-010-1158-1
- J. E. Dombrowski and R. C. Martin, “Evaluation of Reference Genes for Quantitative RT-PCR in Lolium temulentum under Abiotic Stress,” Plant Science, Vol. 176, No. 3, 2009, pp. 390-396. doi:10.1016/j.plantsci.2008.12.005
- FAOSTAT, 2010. http://faostat.fao.org/
- S. Fondevilla, H. Küster, F. Krajinski, J. I. Cubero and D. Rubiales, “Identification of Genes Differentially Expressed in a Resistant Reaction to Mycosphaerella pinodes in Pea Using Microarray Technology,” BMC Genomics, Vol. 12, No. 28, 2011, pp. 1-15. doi:10.1186/1471-2164-12-28
- S. Goncalves, J. Cairney, J. Maroco, M. Margarida, Oliveira and C. Miguel, “Evaluation of Control Transcripts in Real-time RT-PCR Expression Analysis during Maritime Pine Embryogenesis,” Planta, Vol. 222, No. 3, 2005, pp. 556-563. doi:10.1007/s00425-005-1562-0
- S. Guénin, M. Mauriat, J. Pelloux, O. V. Wuytswinkel, C. Bellini and L. Gutierrez, “Normalization of qRT-PCR Data: The Necessity of Adopting a Systematic, Experimental Conditions-Specific, Validation of References,” Journal of Experimental Botany, Vol. 60, No. 2, 2009, pp. 487-493. doi:10.1093/jxb/ern305
- R. C. Martin, V. G. Hollenbeck and J. E. Dombrowski, “Evaluation of Reference Genes for Quantitative RT-PCR in Lolium perenne,” Crop Science, Vol. 48, No. 5, 2008, pp. 1881-1887. doi:10.2135/cropsci2007.10.0597
- N. Nicot, J.-F. Hausman, L. Hoffmann and D. Evers, “Housekeeping Gene Selection for Real-time RT-PCR Normalization in Potato during Biotic and Abiotic Stress,” Journal of Experimental Botany, Vol. 56, No. 421, 2005, pp. 2907-2914. doi:10.1093/jxb/eri285
- S. K. Panda and H. Matsumoto, “Changes in Antioxidant Gene Expression and Induction of Oxidative Stress in Pea (Pisum sativum L.) under Al Stress,” Biometals, Vol. 23, No.4, 2010, pp. 753-762. doi:10.1007/s10534-010-9342-0
- L. D. Porter, G. Hoheisel and V. A. Coffman, “Resistance of Peas to Sclerotinia sclerotiorum in the Pisum Core Collection”, Plant Pathology, Vol. 58, No. 1, 2009, pp. 52-60. doi:10.1111/j.1365-3059.2008.01937.x
- C. Ramakers, J. M. Ruijter, R. H. Deprez and A. F. Moorman, “Assumption-Free Analysis of Quantitative RealTime Polymerase Chain Reaction (PCR) Data,” Neuroscience Letters, Vol. 339, No. 1, 2003, pp. 62-66. doi:10.1016/S0304-3940(02)01423-4
- T. Remans, K. Smeets, K. Opdenakker, D. Mathijsen, J. Vangronsveld and A. Cuypers, “Normalisation of RealTime RT-PCR Gene Expression Measurements in Arabidopsis thaliana Exposed to Increased Metal Concentrations,” Planta, Vol. 227, No. 6, 2008, pp. 1343-1349. doi:10.1007/s00425-008-0706-4
- J. Vandesompele, K. De Preter, F. Pattyn, B. Poppe, N. Van Roy, A. De Paepe and F. Speleman, “Accurate Normalization of Real-Time Quantitative RT-PCR Data by Geometric Averaging of Multiple Internal Control Genes,” Genome Biology, Vol. 3, No. 7, 2002, pp. 1-12. doi:10.1186/gb-2002-3-7-research0034
- M. L. Wong and J. F. Medrano, “Real-Time PCR for mRNA Quantitation,” Biotechniques, Vol. 39, No. 1, 2005, pp. 75-85.