American Journal of Climate Change
Vol.3 No.2(2014), Article
ID:47294,12
pages
DOI:10.4236/ajcc.2014.32018
Thermal Conditions in Córdoba City, Argentina, during 1960-2010 Period
Antonio C. de la Casa1, Olga B. Nasello2
1Facultad de Ciencias Agropecuarias, Universidad Nacional de Córdoba, Córdoba, Argentina
2Facultad de Matemática Astronomía y Física, Universidad Nacional de Córdoba and IFEG-CONICET, Medina Allende s/n, Ciudad Universitaria (5000), Córdoba, Argentina
Email: delacasa@agro.unc.edu.ar, nasello@famaf.unc.edu.ar
Copyright © 2014 by authors and Scientific Research Publishing Inc.
This work is licensed under the Creative Commons Attribution International License (CC BY).
http://creativecommons.org/licenses/by/4.0/


Received 4 April 2014; revised 3 May 2014; accepted 1 June 2014
ABSTRACT
The present work analyzes daily minimum (Tmin) and maximum (Tmax) temperature series from Córdoba Observatory weather station, which is located near the center of the city of Córdoba, Argentina, and from the Pajas Blancas and Pilar observatories, in order to have a reference counterpart of regional climate. The air temperature in Córdoba city during 1960-2010 period shows lower/higher frequency of Tmin categories lower/higher than 15˚C, with respect to rural thermal conditions. Tmax categories higher/lower than 30˚C, in turn, presented higher/lower frequency in the city. While the mean annual Tmin showed a significant positive trend in the entire region in the study period, Tmax presented no significant changes over time. The difference between urban and rural thermal regimes remained uniform throughout the study period, so the process of urbanization does not seem to have changed the Urban heat island status measure from Córdoba Observatory, even though the population of the metropolis has doubled. Although nocturnal thermal conditions have changed over the period, particularly in urban areas, there has been no change in the regime of extreme daytime temperatures across the region. The annual mean Tmin increase is not monotonic, but presents a significant positive partial trend until a breakpoint around 1990, and then becomes neutral or negative and loses significance. For the annual mean Tmax, the partial trend slopes are not significant in any case, so the variation of annual mean thermal amplitude is due mainly to the increase of the Tmin, probably associated with increased rainfall in the region.
Keywords:Maximum and Minimum Daily Temperature, Partial Trends, Urban Heat Island, Climate Change

1. Introduction
The thermal condition of cities may be increased over time by global warming and by the population and urban growth known as the Urban Heat Island (UHI) effect. Studying the causes of these variations in temperature help to understand the behavior of climate in general, and is also useful for evaluating the increasing lack of comfort of the inhabitants, to determine the increased power consumption needed to mitigate the deleterious effects of thermal change.
The temperatures in a town are often higher than that in its rural surroundings. London was the first urban heat island to be documented [1] , but since then many cities have been studied [2] -[4] . The UHI effect can be attributed to many physical differences between urban and rural areas, including absorption of sunlight, increased heat storage by manmade surfaces, obstruction of re-radiation by buildings, absence of plant transpiration, differences in air circulation, and other phenomena [5] [6] .
Weather stations located in cities are an important part of the meteorological network, and their data are used to assess climate change, so that the city’s influence on global temperature trends is constantly studied to perform adequate data assimilation [7] [8] . While the first studies determined a nonlinear relationship between population growth and the UHI [9] , findings over the past two decades have underlined that UHIs are more diverse than originally suspected. For this reason, the most reliable way to investigate possible urbanization bias is to analyze the climate behavior at each particular urban weather station [3] .
Urban meteorological information used for this study was obtained from Córdoba Observatory (BO) weather station, which has been making observations of weather conditions since its installation in the late 19th century. The BO weather station is located near the center of Córdoba city, Argentina, which currently has more than 1 million inhabitants, in an area of the southern hemisphere where there are few weather stations. Population density in the region is also very low (see http://www.fao.org/ag/AGP/AGPC/doc/Counprof/Argentina/argentina.htm). Studies about UHI for Argentina have been performed by [10] -[13] , with particular attention to Buenos Aires city.
In the context of climate change postulated by IPCC [14] [15] , the distribution of seasonal mean temperature anomalies has shifted toward higher temperatures and the range of anomalies has increased [16] . An important change is the emergence of a category of extremely hot summertime outliers, more than three standard deviations (3σ) warmer than the climatology of 1951-1980 base period. This hot extreme, covering much less than 1% of the Earth’s surface during the base period, now typically covers about 10% of the land area [17] .
In the past, most analysis of surface air temperature observations focused on mean values. In recent years, the analysis of extreme temperatures has highlighted changes in high frequency extreme temperature events [16] [18] , in the number of days exceeding various temperature thresholds and percentile extremes [19] -[21] , in regional trends of daily maximum (Tmax) and minimum (Tmin) temperatures [22] [23] , and in the diurnal temperature range (DTR) [24] . Tmax and Tmin trends have also been studied and, in general, minimum temperatures were seen to have increased at a higher rate than maximum temperatures [16] . Also, [23] studied the statistical distribution of minimum and maximum temperatures from long series of more than a century of 24 European stations, and verify that there are several distinct stable climatic regions in Europe, and each of them have a different thermal behavior. While Eastern European stations present an increase of about 2˚C of the maximum temperatures in the last 30 years with respect to the preceding time spans, in Central Europe there is an increase of about 1˚C of the maximum temperatures at some stations, but no discernible increase at the others.
As [25] point out, one important aspect which may influence trend estimates in different periods is the existence of very low frequency variability in the climate, such as the Pacific Decadal Oscillation (PDO), which has a period of 50 - 60 years [26] . This effect was also noted in a previous work [27] which, using the Tome-Miranda method [28] , found that the variation over time of annual rainfall in Córdoba Province, Argentina, does not follow a linear trend but has notable breakpoints, with an important influence of the southern Pacific Decadal Oscillation (PDO).
The objective of this work was to analyze the variation of air temperature at Córdoba Observatory (BO) weather station, which has been making observations of weather conditions always at the same place since its installation in the late 19th century. The study was performed for the 1960-2010 period considering meteorological information from rural and suburban stations near Córdoba city as a reference of regional thermal conditions. Also it was studied the influence of these changes on diurnal temperature range which have been proposed as an indicator of climate change.
2. Material and Method
The temperature data analyzed were obtained at 3 weather stations operated by the “Servicio Meteorológico Nacional” (SMN) of Argentina in Córdoba Province. These are Córdoba Observatory (BO), Pilar Observatory (PI), Pajas Blancas Airport (PB), which were always located as shown in Table 1 and Figure 1. The observational regime is similar in the three weather stations, as they integrate the official weather stations network, by using maximum and minimum conventional thermometers, placed into the standard shelter over a field covered with grass (garden stations).
The population of Cordoba city has grown steadily in the last century, and currently has 1,300,000 inhabitants. Pajas Blancas Airport is located on the outskirts of the city, 11.5 km from BO (see Figure 1), so that could be considered as a suburban station. Pilar Observatory (PI) is located near the town of the same name, which has a population of only 13,000, and is 41.4 km from BO in a predominantly rural area, so that urban influence has minimal impact (rural station). Although there are small differences in altitude between stations, the relief between Córdoba and Pilar cities is flat, so there are no weather factors that modify the expression of the data except the climate dynamics.
In general, the climatic conditions of the three stations are very similar. In fact, in the 2001-2010 period, in all of them was observed that 40% of the winds are from the Are NE, while S winds represent 20% annual frequency.
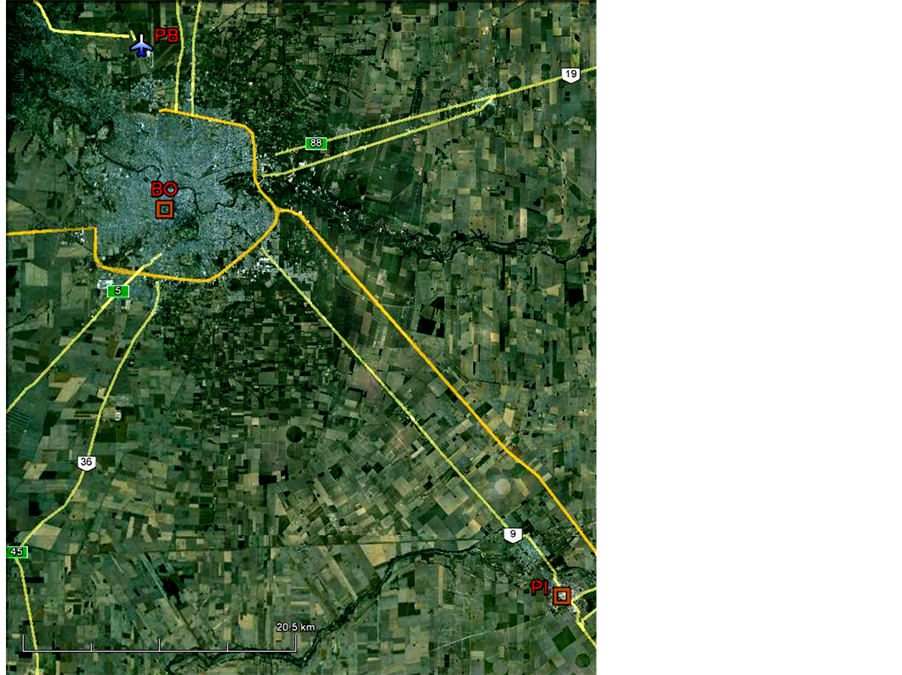
Figure 1. Image with weather station locations: Córdoba Observatory (BO), in Córdoba city, Pajas Blancas Airport (PB), north of the city, and Pilar Observatory (PI) in its namesake city.
Table 1. Weather stations used and period analyzed.
The average wind speed is between 8 and 17 km/h, reaching maximum values between August and October months. In addition, in PI and BO stations calm periods account for about 30% of cases. In relation to rain, the three stations show precipitation values of about 800 mm in 80 days per year, mainly concentrated in the six months from October to March. Finally, cloudiness in all these stations is between 3 and 4 eighths per year.
The thermal regime variation was analyzed from records of daily maximum (Tmax) and minimum temperatures (Tmin) for 1970-2009 periods, during which observations are available for the three weather stations. Tests performed reveal the homogeneity condition of these series. The criterion of using daily extreme values was adopted to avoid the influence of the calculation procedure on the mean temperature, as well as because these have been identified as particularly sensitive indicators of climate change [29] . Maximum and minimum temperatures, while presenting their own uncertainties are not subject to any calculation procedure [30] .
With the daily data of extreme temperatures, Tmax and Tmin, the diurnal temperature range (DTR) was calculated as:
DTR = Tmax – Tmin
and the annual amplitude for each year was calculated as the mean value of DTR.
To assess the partial trends of the study variables and see if there are changes in the period analyzed the Tomé-Miranda (TM) method was employed [28] . TM method, explained in detail in [27] , obtains the square difference between the observed values of the time series and the values evaluated from a set of partial trends. These partial trends are obtained subject to the condition that the interval between breakpoints must exceed a certain value, called Minix, and also imposing restrictions on the difference between two successive trends. Then the algorithm determines the best combination of continuous segments, i.e. those that minimize the sum-ofsquare error, SS. In the present work, the Minix values adopted were 15 and 20 years, as shorter periods of time could hardly be regarded as climate change. Also, the algorithm was used considering that two consecutive trends must be of different signs in order to analyze the time series by cyclical behavior.
To evaluate the level of significance of the results obtained by the algorithm, the Mann-Kendall test [31] was used. The Mann-Kendall statistic S is calculated using the formula:

where xj and xk are the annual temperature values in years j and k, j > k, respectively, and

The S values and variance of S (VAR(S)) are used to compute the test statistic Z as follows:

Since Z has a normal distribution, the presence of a statistically significant trend is evaluated using the Z value. To test for either an upward or downward monotone trend, a two-tailed test at α level of significance (α = 0.001 (***), 0.01 (**), 0.05 (*) and 0.1 (+)) was used.
3. Results and Discussion
3.1. Thermal Regime of Córdoba city
The heat island effect of Córdoba city was first analyzed using the complete set (i.e. without any filter) of daily maximum and minimum temperatures recordings between 1970 and 2009, arranged in class intervals of 5˚C. The histograms of relative frequency thus obtained are shown in Figure 2. The frequency distributions of the three weather stations are not different from a normal probability distribution, according to the various statistical tests conducted. Due to their geographical proximity and the quasi-plain condition of the region, these figures reveal similar thermal behavior for the three weather stations. However, there are some systematic differences between them: while the mean minimum and maximum temperatures of the rural and suburban stations are approximately equal to each other (the difference is less than 0.5˚C), the temperature difference between urban and rural area is about 1˚C. Moreover, all categories of daily minimum temperature below 15˚C presented greater
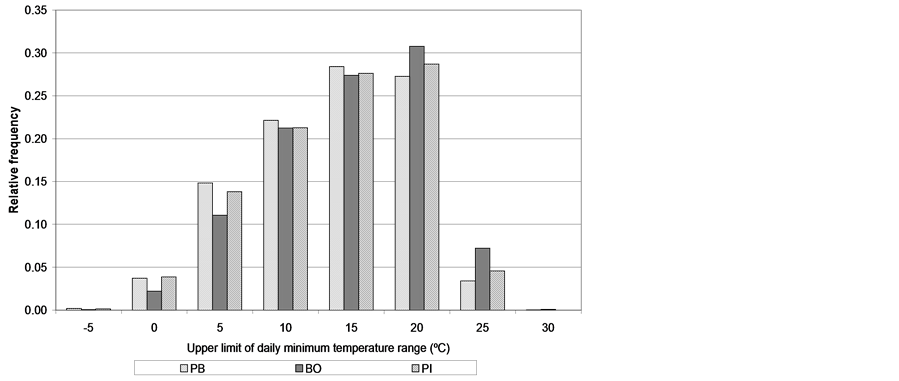
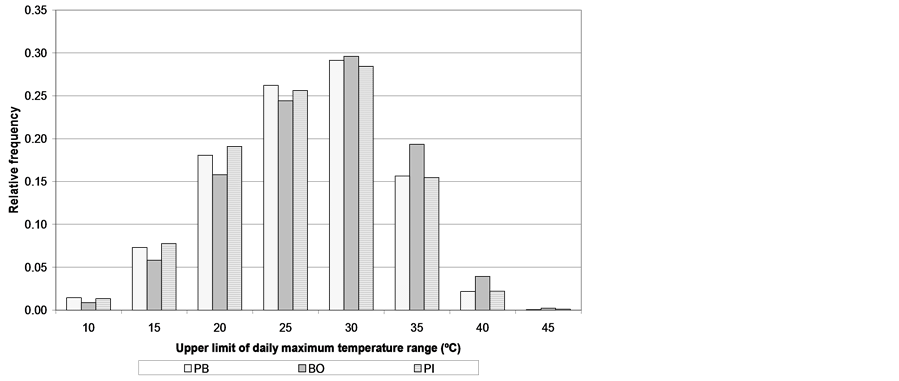
Figure 2. Frequency histogram of daily minimum (above) and maximum temperatures (below) for Córdoba Observatory (BO), Pajas Blancas Airport (PB) and Pilar Observatory (PI) weather stations between 1970 and 2009.
frequency in rural and suburban areas, showing that temperature during night cooling is consistently lower in the rural environment than in the metropolis. By projecting this difference directly on the frost regime, the conditions of urbanization and energy use established that the winter in Córdoba city is less intense. Also, considering the highest levels of minimum temperature of histogram, the highest frequency occurs in BO, indicating lower nocturnal cooling in the city, particularly during the summer period.
The UHI effect is also seen at BO when considering daily maximum temperature data. While maximum temperature frequencies for the categories below 30˚C are lower than PB and PI, for the highest temperature ranges the frequencies are higher, indicating warmer thermal conditions in the city during the day. This general behavior is corroborated in Figure 3, which shows the average hourly temperatures recorded in PB and BO stations during the months of June and January (2009-2011).
To evaluate the change of UHI over time in Córdoba city, the trends of mean maximum and minimum annual temperatures were analyzed for the complete study period, as well as the ratio of annual mean values between stations (urban and rural). Trends were assessed using the Mann-Kendall test, obtaining the results presented in Table 2. These show a statistically significant increase in minimum annual mean temperature at the three stations, which confirms the results obtained by [32] . There are no significant changes in maximum annual mean temperature, and the trend in BO and PI is negative, as is also indicated by these authors [32] .
In comparative terms, the relationship between the annual mean minimum temperature in PB or PI (rural stations) and BO (urban station), as well as the relationship between the two rural stations, registers a negative
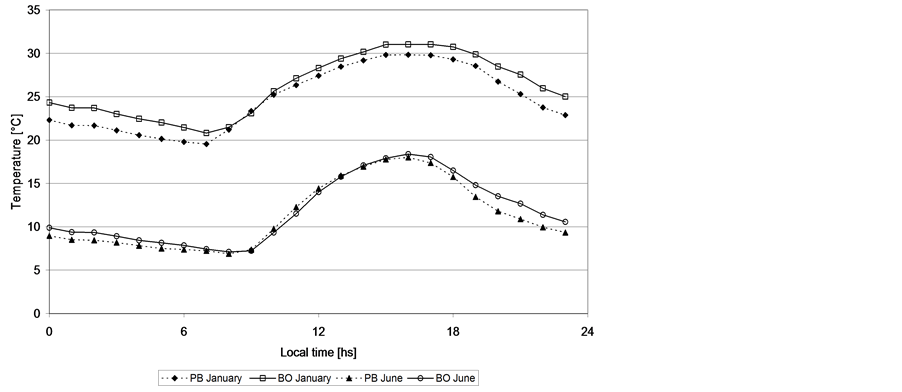
Figure 3. Mean hourly temperatures during the months of January and June at Córdoba Observatory (BO) and Pajas Blancas Airport (PB) for 2009-2011 period.
Table 2. Mann-Kendall test (Z) to assess the significance (α = 0.001 (***), 0.01 (**), 0.05 (*) and 0.1 (+)) of annual mean minimum (Tmin) and maximum (Tmax) temperature trends at Córdoba Observatory (BO), Pajas Blancas Airport (PB) and Pilar Observatory (PI). Q (linear slope) and B (intercept) obtained by Sen’s method.
trend that is not statistically significant. This means that, there is no objective evidence that differences of “urban contamination” between them have changed the thermal regime over the period, despite the city’s population having been gradually doubled in the period. For example, the differences between the rural and urban temperatures were already established before the period analyzed. This behavior could be explained by the fact that the urban environment conditions of the BO station have not changed significantly during the period. Indeed, the station was always located in a park of about 1 ha and surrounded by low-rise buildings in a radius of about 500 m, which could explain why the microclimate around the station does not reflect the population change occurring in the city.
3.2. Global Warming over the Regional Thermal Regime
According to [17] the distribution of seasonal mean temperature anomalies has shifted toward higher temperatures and the range of anomalies has increased. During the summer they see a major shift in the extremely warm thermal category, of more than three standard deviations (3σ) compared with the climate reference value (1951- 1980). To evaluate this contingency in Cordoba city climate, a frequency analysis was performed of the daily values for each year of the series, for both minimum and maximum temperatures, and the frequencies of different class intervals were subjected to Mann-Kendall trend analysis, with the results shown in Table 3.
The data in Table 3 confirm that there has been a significant change in minimum daily temperatures, particularly at urban level, with a decreasing frequency in lower thermal categories, and increasing in higher classes. As a result of the decrease of the lower frequency range, frost is less frequent today [18] . However, this decline appears widespread in the region, at urban (BO), suburban (PB) and rural (PI) sites. BO shows a tendency to decrease also in the range between 0˚C and 5˚C, denoting milder winters in the city, with a similar trend in PB and PI, although it is not statistically significant in these cases. In contrast, the highest minimum temperature classes show significant positive trends during this period, both in urban and rural areas, highlighting the current occurrence of higher nighttime temperatures in the region.
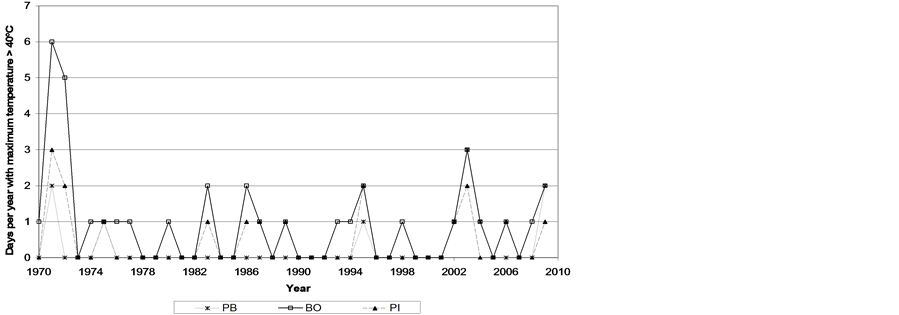
Daily maximum temperatures show more stable behavior over time, since only the increasing trend in the thermal range between 30˚C and 35˚C is statistically significant, for both BO and PI. However, contrary to the general expectations of global warming, the temperature data of BO and PI show a negative trend in the range between 35˚C and 40˚C, indicating that daytime temperatures are currently less extreme (note that the mean annual Tmax and its standard variation are  ˚C. Reinforcing this view, and taking into account the observation of [17] concerning an increase in extreme cases (greater than 3σ), Figure 4 shows the annual frequency of days with maximum temperature above 40˚C in this region.
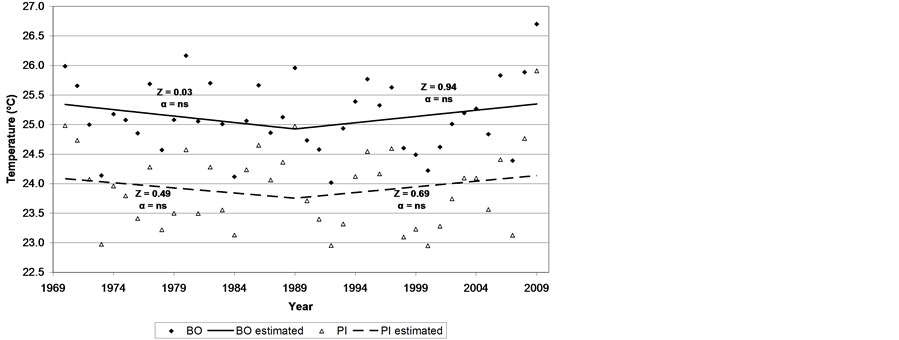
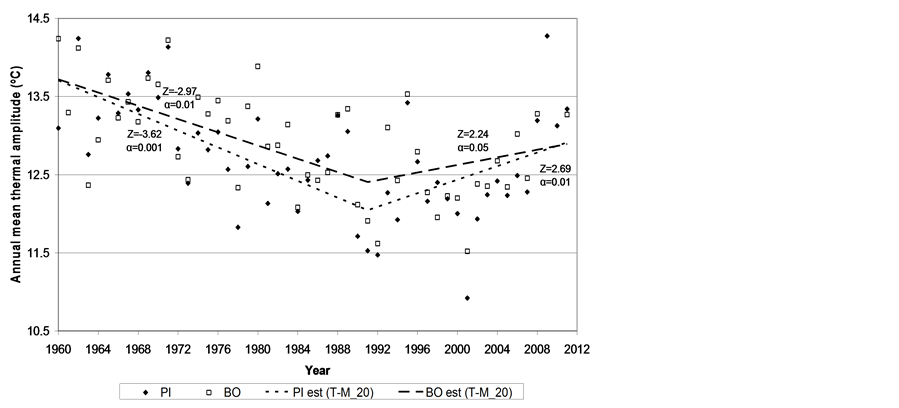
Figure 4 shows that the occurrence of extreme temperature change over time is not increased, and, consistently with its UHI condition, frequencies at BO are higher. While this information is not enough to confirm the simultaneous occurrence of these events, it is reasonable to assume that the manifestation of extremes of heat was widespread in the region, as a product of weather conditions linked to the entry and persistence of warm air masses from the north (heat wave) [33] . Table 3. Mann-Kendall (Z: statistical standard; a: significance level) test to assess the trend of change in frequency ranges of daily minimum (Tmin) and maximum (Tmax) temperatures in Córdoba city and its surroundings (1970-2009). To assess thermal regime changes in more detail, the Tomé-Miranda method was applied to time series of annual mean maximum and minimum temperatures (Tmax_a and Tmin_a, respectively). The results for PI and BO stations, with the method configured to produce only one breakpoint (Minix = 20), are shown in Figure 5. Figure 4. Frequency of days per year with daily maximum temperatures above 40˚C for Córdoba Observatory (BO) in the city and its surrounding stations, Pilar Observatory (PI) and Pajas Blancas Airport (PB). Figure 5. Mean annual maximum (above) and minimum (below) temperatures for Córdoba Observatory (BO) and Pilar Observatory (PI) and the corresponding estimated values with Tomé-Miranda method configured to produce one breakpoint (Minix = 20). Z and α as Table 2. This figure shows that, for both annual mean maximum (Tmax_a) and minimum temperatures (Tmin_a), the method determines a breakpoint around 1990. However, the only significant trend corresponds to the growing period of Tmin_a, i.e. the increase of the minimum temperature for the complete series 1970-2009 (Table 2) is explained by the increase that occurred approximately just before 1990. This behavior with the occurrence of a breakpoint around 1990 in annual mean temperature, with trends at first positive and then negative, is similar to that reported by [34] for some areas of the Southern Hemisphere. Regarding the Tmin_a increase, and projecting its influence on the annual mean thermal amplitude, both PI and BO show a decreasing rate over time at the beginning, as presented in Figure 6. After reaching a minimum value around 1991, the trend for both series is to increase. While this behavior is more pronounced in PI, the same trend was found in BO, and in both urban and rural environments, the method detects the minimum occurring in exactly the same year. The change of the annual thermal amplitude is explained by Tmin_a behavior, apparently ceasing to increase in the middle of the decade 1991-2000. These breakpoints are consistent with those observed in a previous study [27] about annual rainfall registered in Córdoba Province. They also coincide with changes in the Pacific Decadal Oscillation (PDO), which had a warm phase during the 1977-1990 periods and a cold phase from then on. So, the trend registered in the period analyzed may represent in part a phase change of the PDO, as was also observed by [25] studying the monthly mean maximum and minimum temperatures and precipitation records in southern Brazil. These results also match those of [35] and [36] who suggest a direct relation between rainfall and DTR. In fact, Table 4 shows a negative correlation for BO and PI between DTR and precipitation, both in annual, seasonal and monthly periods. Only in June, the month with least rainfall in the central region of Argentina, is the correlation of less significance for both BO and PI. Thus, the increase of water vapor in the atmosphere between 1941 and 1990, which was significant as [37] point out, is an absolutely necessary condition for explaining the rate of increase of precipitation in Córdoba Province and, reciprocally, the increase of rain is associated with this increasing humidity. Similarly, this increased atmospheric vapor content is positively associated with an increased greenhouse effect which, being the main factor, seems to be contributing relentlessly to the increase that has occurred in air temperature, particularly of Tmin. 4. Summary This work studied the thermal condition along 1960-2010 period of Córdoba city, Argentina, measured at the Córdoba Observatory (BO), located at the same place since 1873, in relation to the meteorological data of Pajas Blancas Airport (PB) and Pilar Observatory (PI) as suburban and rural reference stations, respectively. Figure 6. Annual mean thermal amplitude for Córdoba Observatory (BO) and Pilar Observatory (PI) in the 1960-2011 period, and estimations produced by Tomé-Miranda method (TM) with Minix = 20. Z and α as Table 4. Coefficients of correlation (r) between precipitation and mean thermal amplitude for different periods in 1960-2010 at Córdoba Observatory and Pilar Observatory. n is the sample size and α the signification level. **Significant at 99% confidence level; *Significant at 95% confidence level. The results about the urban heat island effect showed that: 1) The average minimum and maximum temperatures of the rural stations are approximately the same (the difference is less than 0.5˚C), while the differences between urban and rural temperatures are about 1˚C. 2) Frequency analysis shows that all categories of daily minimum temperatures below 15˚C present more frequency in rural areas, showing that nighttime cooling are consistently lower in the rural context than in the town. The frequency of maximum temperatures in the urban area for the categories below 30˚C is lower than those of the rural areas. The thermal ranges of highest frequency are higher in BO, indicating that thermal conditions in the city during the day are warmer. 3) In comparative terms, the relationship between the mean annual minimum temperatures in PB and PI (suburban and rural stations) and BO (urban station), as well as the relationship between PI and PB, show no significant trends throughout the period analyzed, i.e. there is no objective evidence that “urban contamination” may have changed the thermal regime during the period analyzed, even though the city’s population has doubled in the same period. With regard to climate change observed in the analyzed data it was noted that: 1) The increase in extreme high temperatures (greater than 3σ) reported by [8] is not present here. 2) Annual mean values of Tmin and DTR throughout the period analyzed show trends to increase and decrease, respectively. However, Tmin, Tmax and DTR all exhibit a breakpoint around 1990. This breakpoint coincides with a change in the Pacific Decadal Oscillation (PDO), which had a warm phase during the 1977-1990 period and a cold phase from there on. 3) The change of thermal amplitude is inversely correlated with variation in precipitation that has occurred in the region. The increase of water vapor in the atmosphere may be responsible for the increase seen in minimum temperature. Acknowledgements We wish to thank A. R. Tome and P. M. A. Miranda of the University of Lisbon, Portugal, who freely provided the source code for obtaining the breakpoint parameters. In addition, we are grateful to Mr. José Barcelona for technical support, to the Servicio Meteorológico Nacional for providing the data and to SeCyT-UNC and CONICET for financial support. Also we would like to express our appreciation to Prof. B. J. Gonzalez Kriegel for collecting the hourly temperature data. References