Open Journal of Fluid Dynamics
Vol.3 No.3(2013), Article ID:37051,9 pages DOI:10.4236/ojfd.2013.33026
A Bio-Hydraulic Modelling Approach to Control the Hemodialysis Patient Status—Calculus and Validation
1Laboratory of Thermal Radiation, Department of Physics, Faculty of Science Tunis, University Tunis El Manar, Tunis, Tunisia
2High School for Rural Engineering, University of Jendouba, Jendouba, Tunisia
3Tunisian Association of Science, Technology and Development, Tunisia
Email: sellami.fac@gmail.com
Copyright © 2013 Mohamed Habib Sellami. This is an open access article distributed under the Creative Commons Attribution License, which permits unrestricted use, distribution, and reproduction in any medium, provided the original work is properly cited.
Received July 1, 2013; revised July 30, 2013; accepted August 14, 2013
Keywords: Systolic Pressure; Sympathetic Activity; Baroreceptor; Biomarker; Glomarular Filtration Rate
ABSTRACT
We have developed a model permitting the control of the hemodialysis patient status. We have represented the functioning of each body compartment by a set of differential equations that express the mass balance of the carbonate and bicarbonate concentrations in each one. Experimental data from bibliography were analyzed and compared to our calculus. Results were well satisfying.
1. Introduction
With advances in technology, dialysis has now become cheaper and less onerous. As there is a shortage of cadaveric donors, only one-third of those on the list will receive a kidney transplant. This means that the majority of such patients will spend the rest of their lives on dialysis [1]. The yearly mortality among patients being treated with dialysis is mainly due to cardiovascular diseases and respiratory infection. Hypertension continues to be a major risk factor for cardiovascular disease. Good evidence suggests that improvements in dialysis efficiency reduce morbidity and mortality of hemodialysis patients. Dialysis efficiency has also been related to better control of carbon dioxide arterial blood pressures, systolic and diastolic blood pressures, cardiac output, brain blood flow, pulmonary blood flow, renal blood flow, urea/creatinine levels and sympathetic nerve activity [1]. That’s why a physiologic model based on an integration over all human body compartments can help to control those parameters. In fact, the new emphasis of research in dialysis modelling is on developing models that more closely resemble the physiology of the body [2-4]. In this direction, by using the mass balance equations principles and the notions of control theory, this paper focuses on modelling the interaction between the different physiological control systems in human (sympathetic nerve, cardiopulmonary and renal) and their link with an important health problem in the worldwide: hemodialysis. The model proposed can help to detect the eventual dysfunction at each physiologic level by controlling the systolic/diastolic pressures, carbon dioxide arterial pressure and the sympathetic nerve activity. For this goal, I will begin with introducing relationships among blood pressures (systolic/diastolic pressures), respiration, peripheral resistance, and sympathetic nerve activity [2- 4]. Then, I will propose a quantitative description of the respiratory processes responsible for the regulation of acid-base balance in man [5-8]. This will be done by formulating the carbon dioxide concentration and its arterial blood pressure for the brain compartment, lung compartment and body tissue compartment. The buffer content of whole blood, the bicarbonate content of plasma and the blood flows which are very useful for the fixed purpose, will also be treated [9-11]. I will incorporate the glomerular filtration rate and the kidney/dialyser clearance [12-17] in order to test the effect of their change on the health indicators (biomarkers) of hemodialysis patient status (acid-base buffer systems, the pH of human plasma, concentration of bicarbonate content of plasma, the partial pressure of carbon dioxide, the sympathetic nerve activity and systolic/diastolic blood pressures [18]).
2. Cardiac Compartment: Relationships between Systolic/Diastolic Pressures and Sympathetic Activity
Sympathetic activity can be thought of as a complex output of the central nervous system, providing subtle control over end organ function. This control is exerted in a number of frequency bands, including rhythms related to the cardiac cycle, respiratory cycle and kidney cycle. Determining the blood pressures (diastolic and systolic pressures, arterial pressure, partial pressure of carbon dioxide in arterial blood) at different level of the body can help to deduce the sympathetic activity and after detect the eventual dysfunction if the frequency is not in the normal band. At any end-diastolic volume, an increase in sympathetic activity results in an increase in stroke volume due both to an increase in venous return and in contractility. The diastolic blood pressure (respectively the systolic blood pressure) defined as the force against the artery wall when the heart is at rest (respectively when the heart is beating) can be deduced from the following equations [2-4]:
 (1)
(1)
 (2)
(2)
 (3)
(3)
 (4)
(4)
 (5)
(5)
Cv-Ne is the vascular concentration of norepinephrine (Ne)
Cc-Ne is the cardiac concentration of norepinephrine (Ne)
Pdi is the diastolic blood pressure at the beat i
 is the diastolic blood pressure of the previous beat (i – 1)
PS is the systolic blood pressure t is the duration of heart period ti is the duration of contraction (i) onset
δνr is the time-varying relaxation of the Windkessel arteries
τcc-i is the cardiac contractility at the beat i The increase in end organs function (heart, kidney, pulmonary) is mediated by sympathetic neurons which release norepinephrine in the vicinity of the authorythmic cells. The role of norepinephrine is to increase the rate of depolarisation of the pacemaker pre-potential by rising sodium and calcium conductance, while simultaneously decreasing potassium conductance [4]. If not measured, the vascular concentration of norepinephrine and the cardiac concentration of norepinephrine can be deduced from those relations [2,3]:
 (6)
(6)
 (7)
(7)
 (8)
(8)
 (9)
(9)
 (10)
(10)
 (11)
(11)
Cv-Ne is the vascular concentration of norepinephrine (Ne)
Cc-Ne is the cardiac concentration of norepinephrine (Ne)
P is the blood pressure Tresp is a constant respiratory period.
φsa is the efferent sympathetic activity
φba is the baroreceptor activity
φri is the respiratory influences
θ is an instantaneous phase of respiration, (0 < θ < 0.5 correspond to expiratory period and 0.5 < θ < 1, correspond to inspiratory period).
3. Modelling Partial Pressure of Carbon Dioxide in the Arterial Blood
It has been observed that an increase in carbon dioxide concentration in the arterial blood greatly depresses neuronal activity in particular the sympathetic activity [2-4]. In fact any dysfunction of the kidney/dialyser provokes a deviation of the carbon dioxide concentration or its pressure from their normal values that will probably influences the metabolic processes and after the systolic/diastolic pressures and the sympathetic activity. To determine the carbon dioxide arterial blood pressures and concentrations at all body’s compartments, I will apply the mass balance equation for the brain, lung and body tissue.
3.1. Formulation of Carbon Dioxide Exchange in the Brain Compartment
For the brain, the rate of change of carbon dioxide volume is determined by a balance between the net rate of carbon dioxide transported to the brain tissue by the blood and the net rate at which carbon dioxide is produced in the brain tissue. Also the carbon dioxide concentration in brain tissue is, generally, equilibrated with the carbon dioxide concentration in the venous blood leaving the brain. This can be formulated by [9-11]:
 (12)
(12)
 (13)
(13)
 (14)
(14)
 is the total CO2 concentration in the brain tissue at instant t
 is the total CO2 concentration in arterial blood at instant t
 is the partial pressure of CO2 in the arterial blood
 is the partial pressure of CO2 in brain tissue
 is the effective brain tissue volume for CO2 generally equal to 0.9
 is the metabolic rate of carbon dioxide production in the brain (generally equal to 0.042)
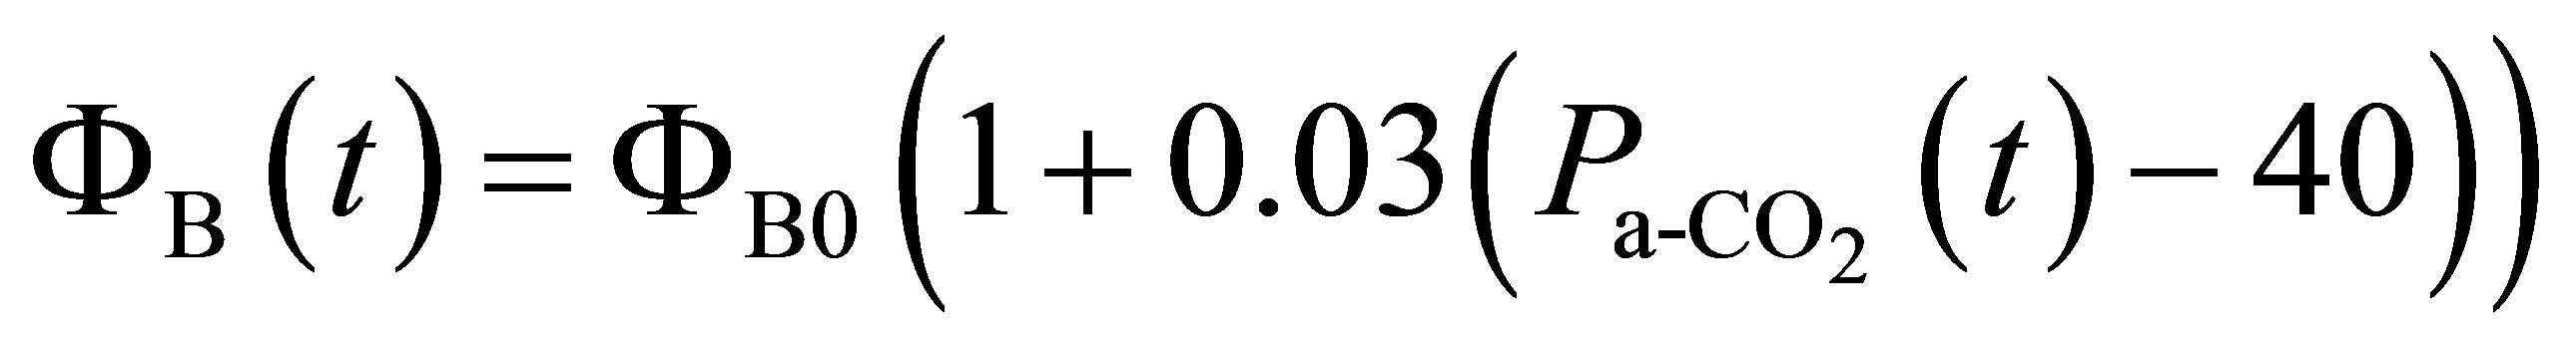
ΦB(t) is the brain blood flow at instant t
ΦB0 is a parameter indicates the normal brain blood flow for 
3.2. Formulation of Carbon Dioxide Exchange in the Lung Compartment
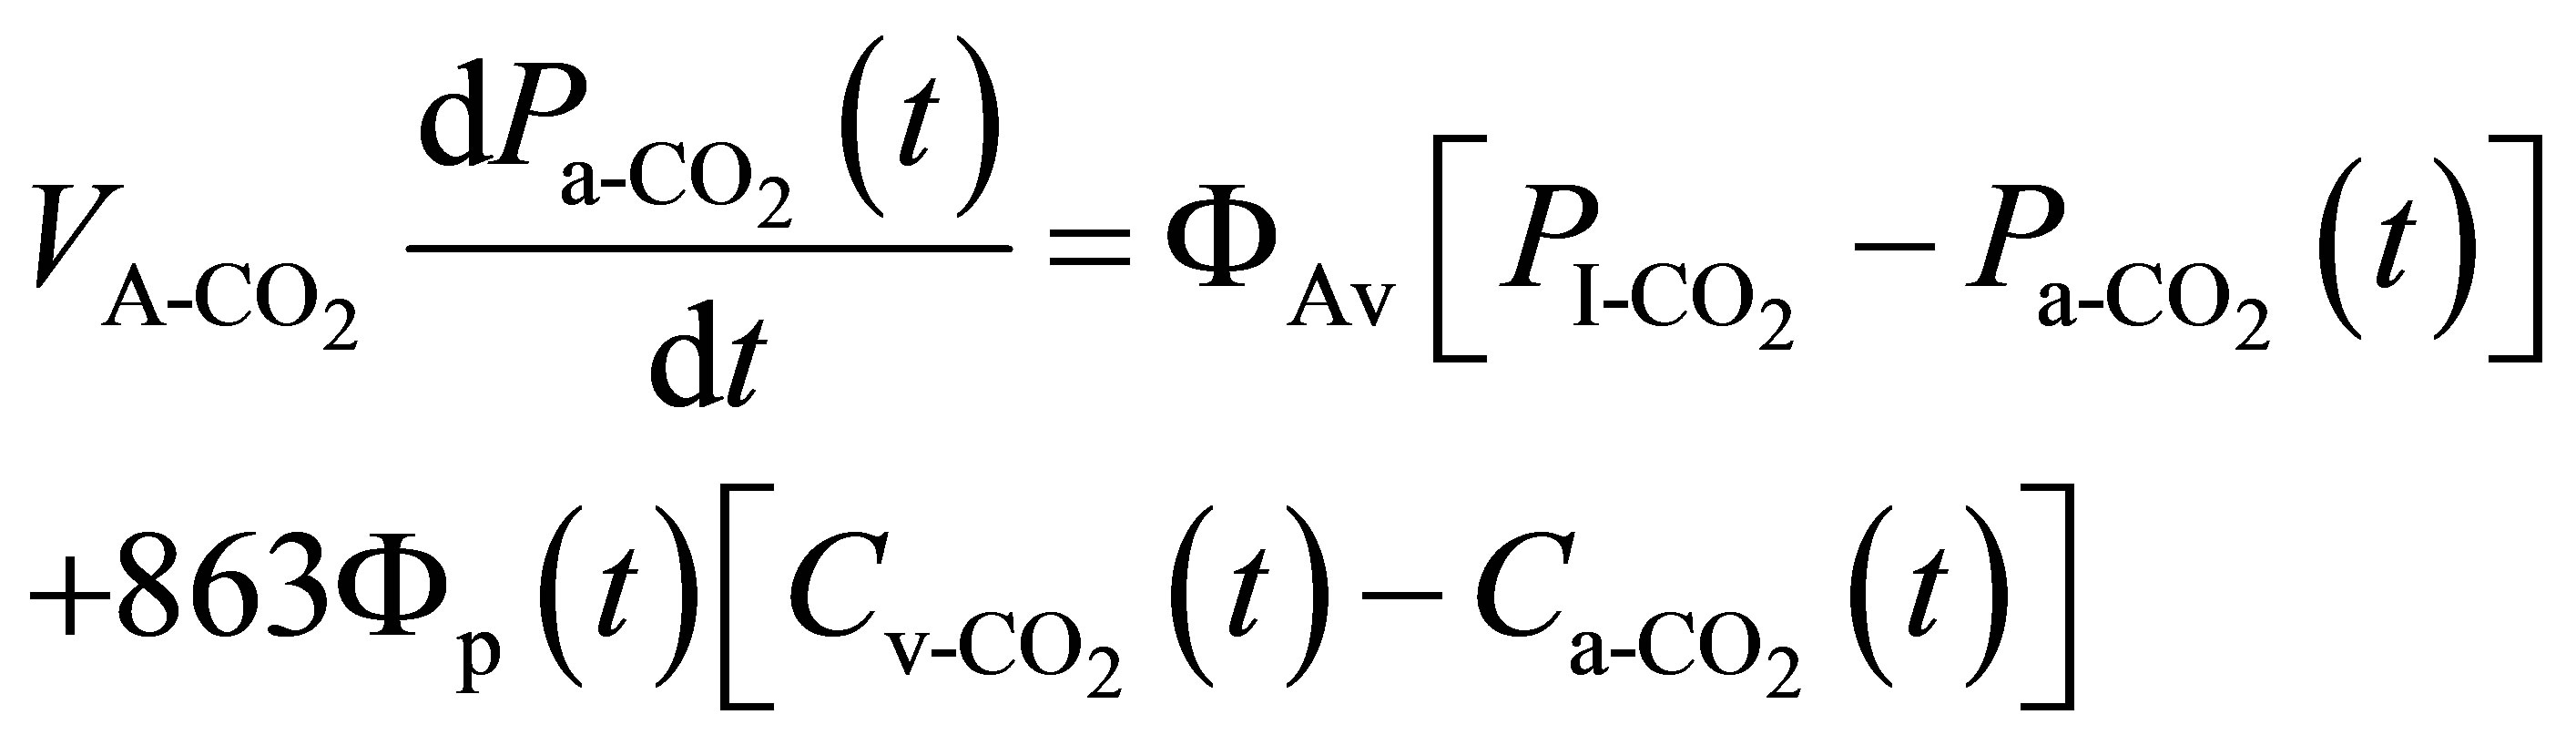
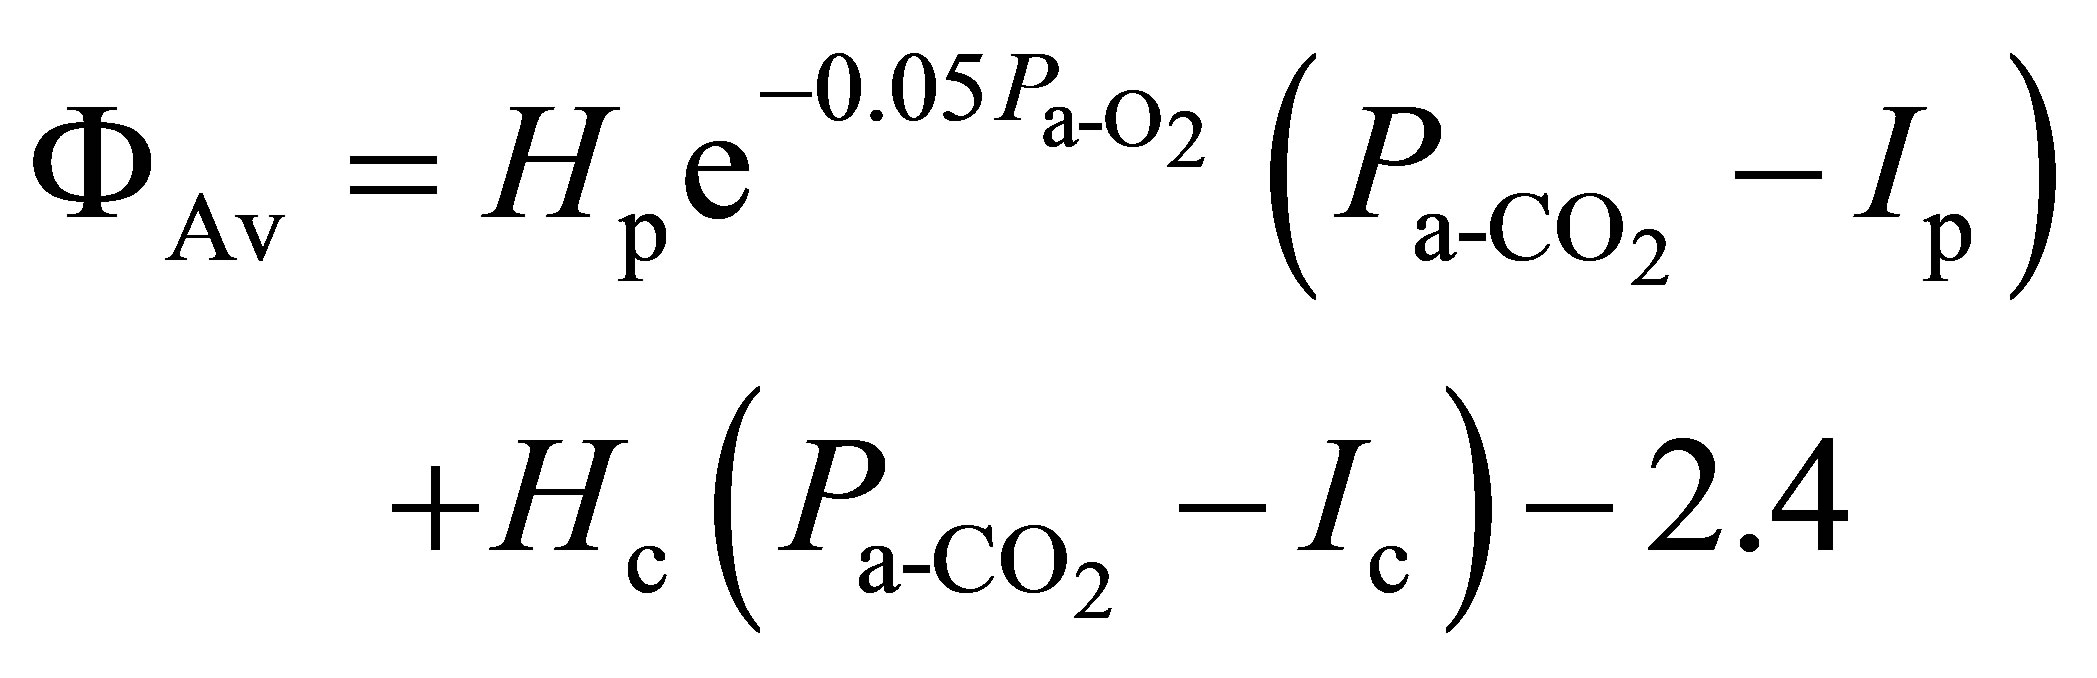
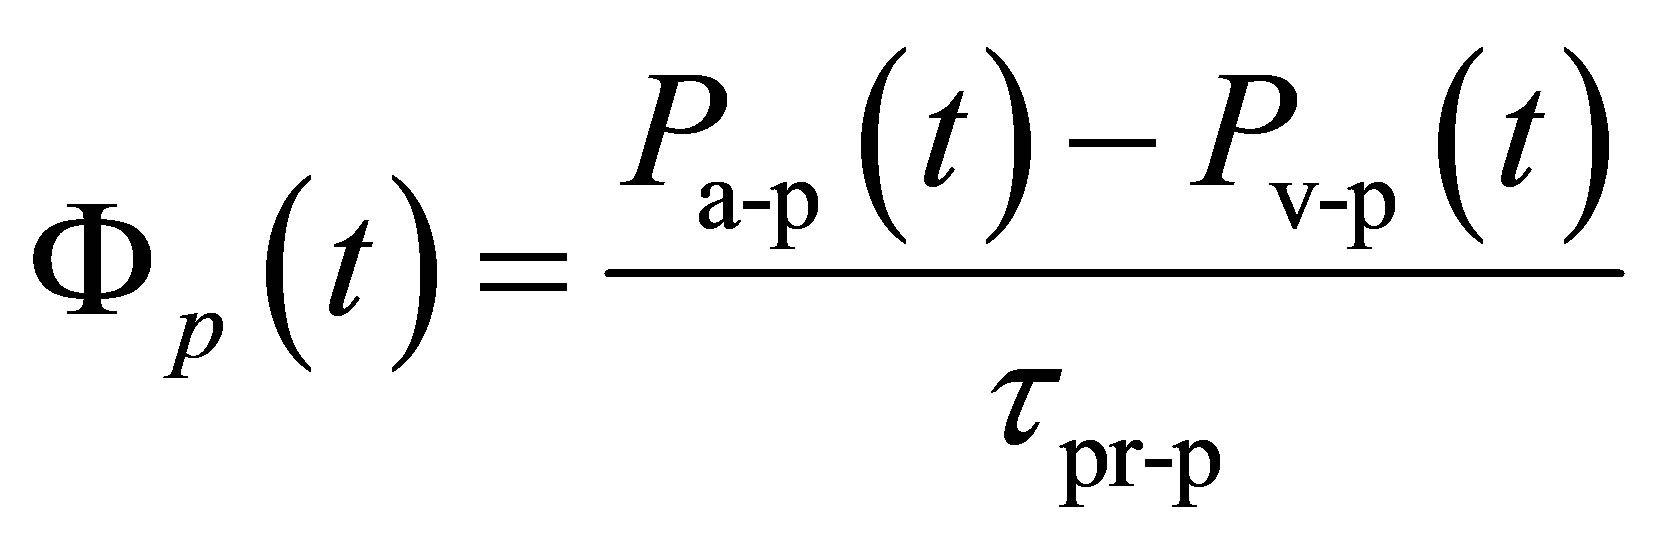
Carbon dioxide can exist in the blood in many different forms: as free carbon dioxide, and in chemical combinations with water (bicarbonate), haemoglobin, and plasma protein. Carbon dioxide elimination is accomplished by bringing fresh air into the lungs, there is no other way to excrete the body’s carbon dioxide production. In fact, haemoglobin is the key chemical compound that combines with oxygen from the lungs and carries the oxygen from the lungs to cells throughout the body. The blood also transports carbon dioxide, which is the waste product of this energy production process, back to the lungs from which it is exhaled into the air. At every instant t the change of carbon dioxide volume is determined by a balance between the net rate of carbon dioxide diffusing into the lungs from the blood and that expired from the lungs. The formulations that express those phenomena are [9-11]:
 (15)
(15)
 (16)
(16)
 (17)
(17)
 (18)
(18)
 (19)
(19)
 concentration of bound and dissolved CO2 in arterial blood
 concentration of bound and dissolved CO2 in the mixed venous blood Hc the central controller gain Hp the peripheral controller gain Ic constant for central drive of ventilation Ip constant for peripheral drive of ventilation Pa is the mean arterial blood pressure
 partial pressure of CO2 in arterial blood Pa-p is the mean blood pressure in the arterial region of the pulmonary circuit
 partial pressure of CO2 in inspired air Pv-p is the mean blood pressure in the venous region of the pulmonary circuit
 is the effective CO2 storage volume of the alveolar (lung compartment)
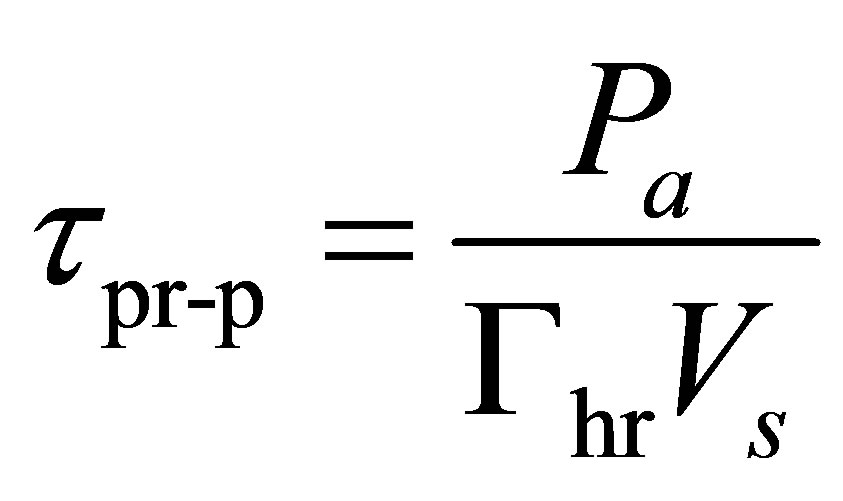
Vs is the stroke volume
ΦAv is the alveolar ventilation
Φp(t) is the pulmonary blood flow at instant t
τpr-p is the peripheral resistance in the pulmonary circuit
Γhr is the heart rate
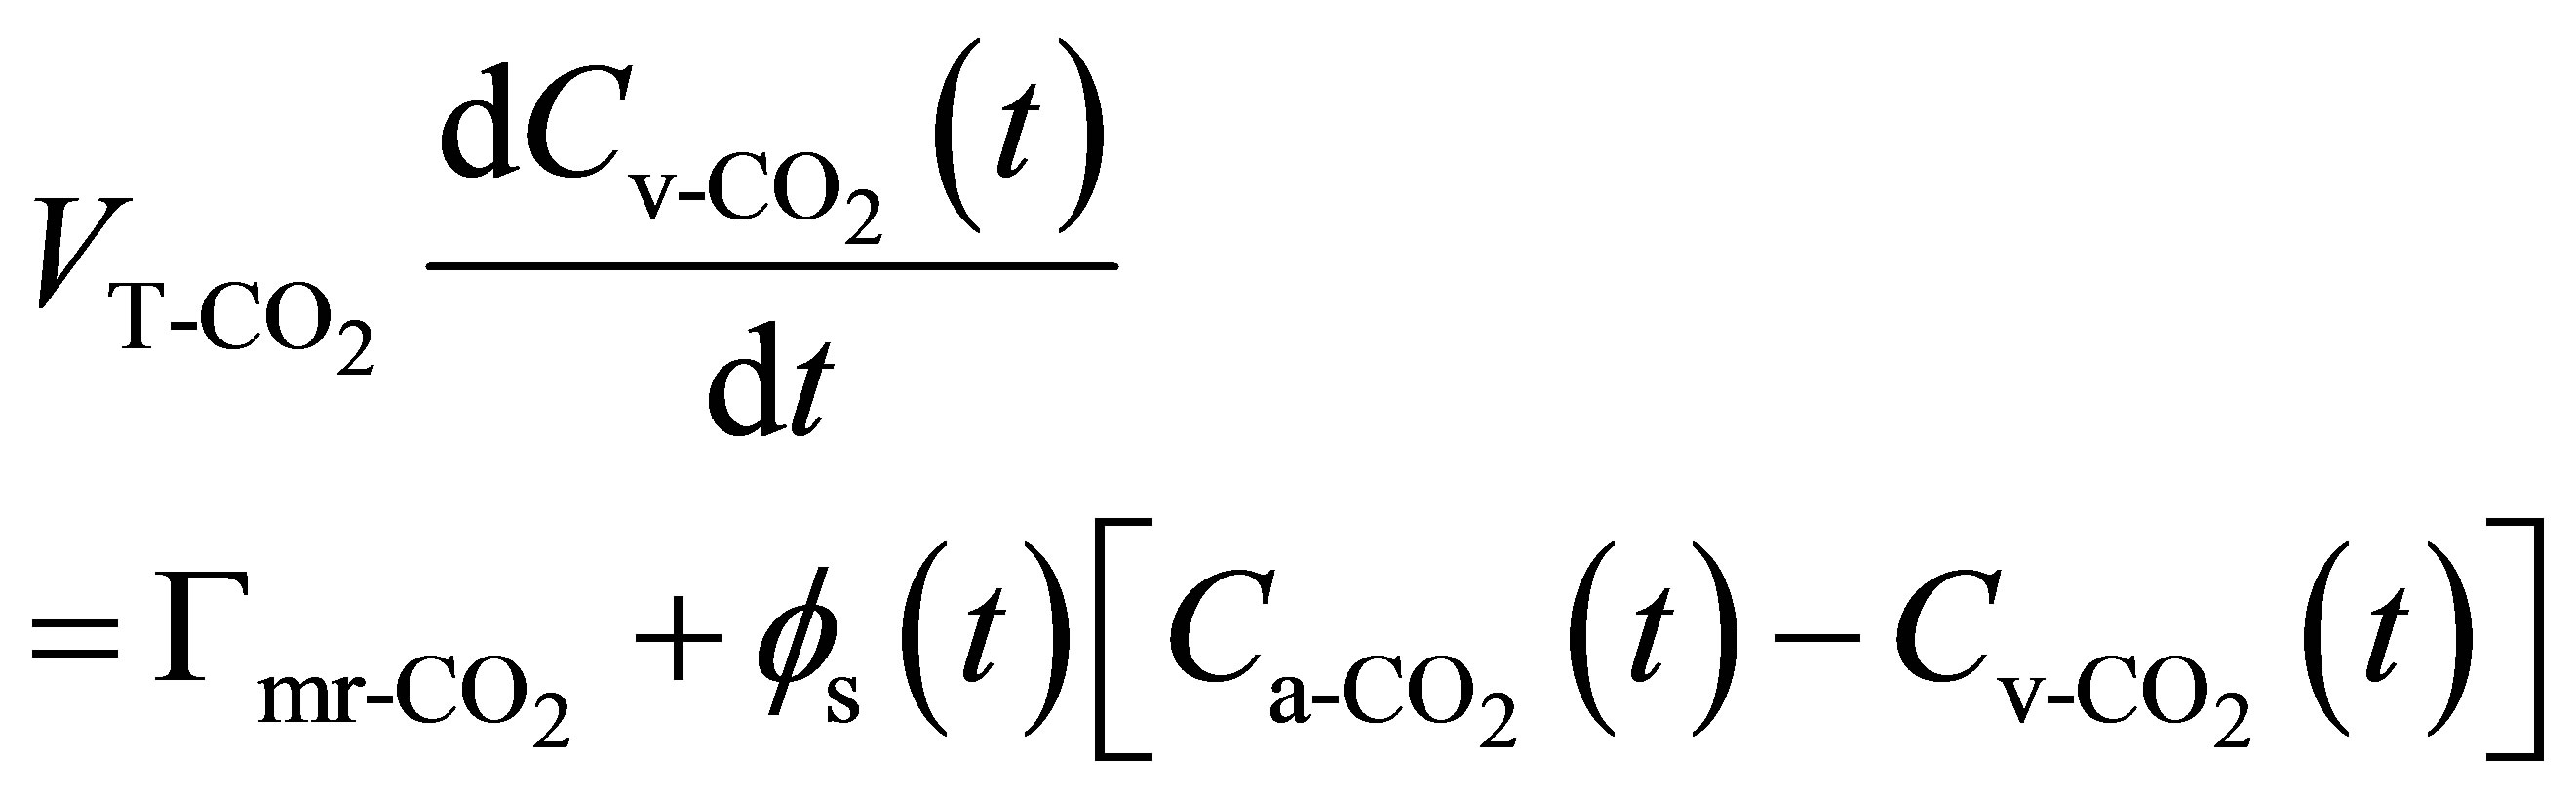
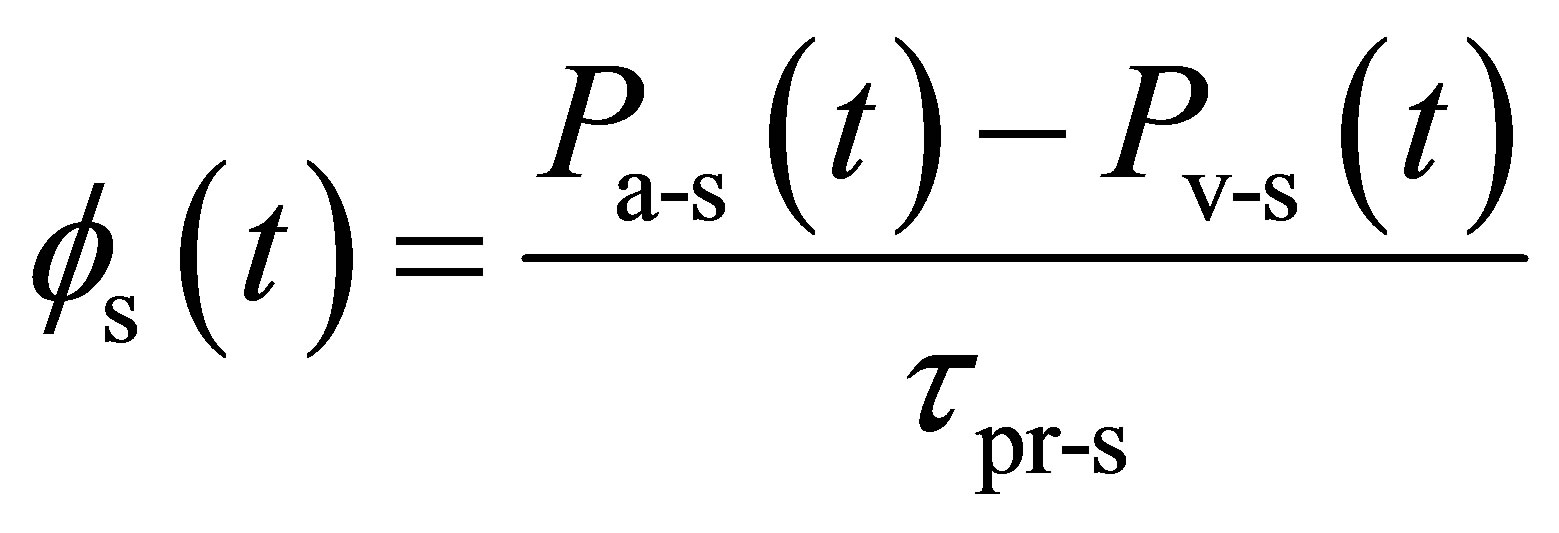
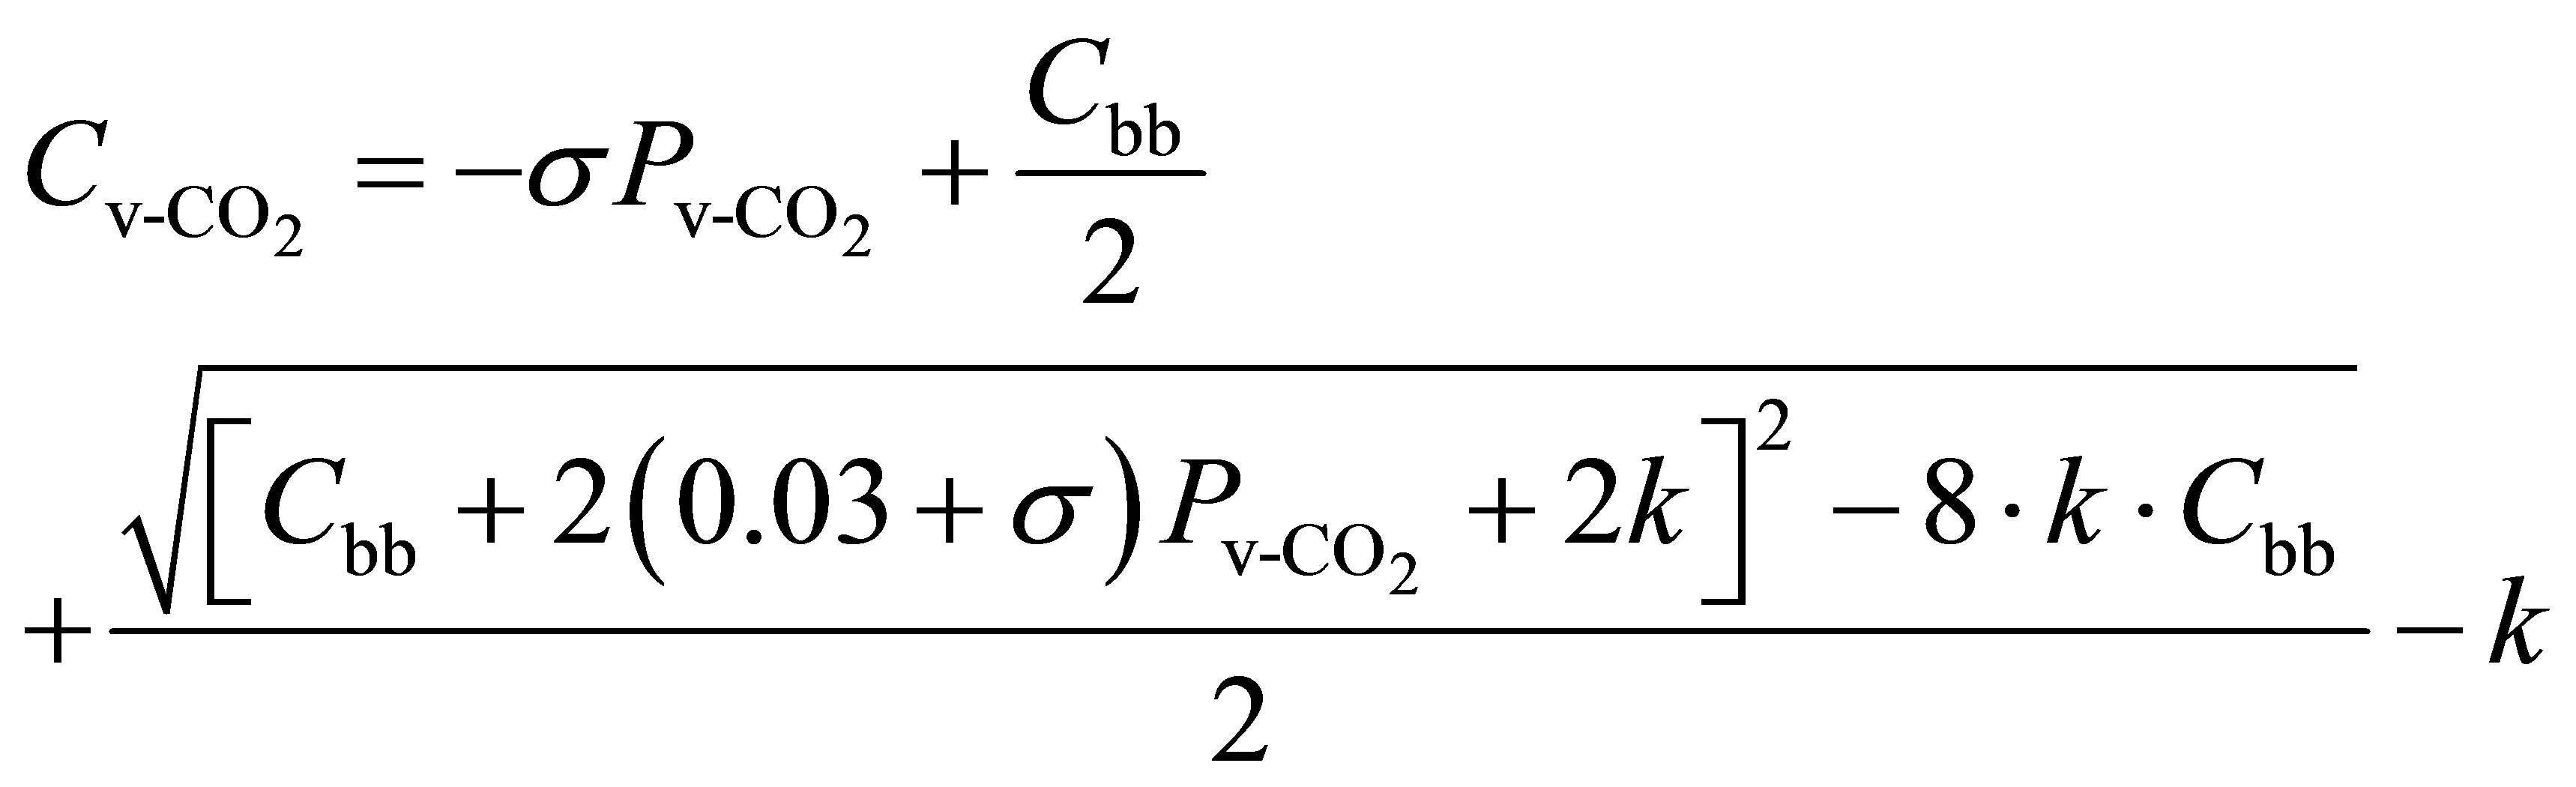
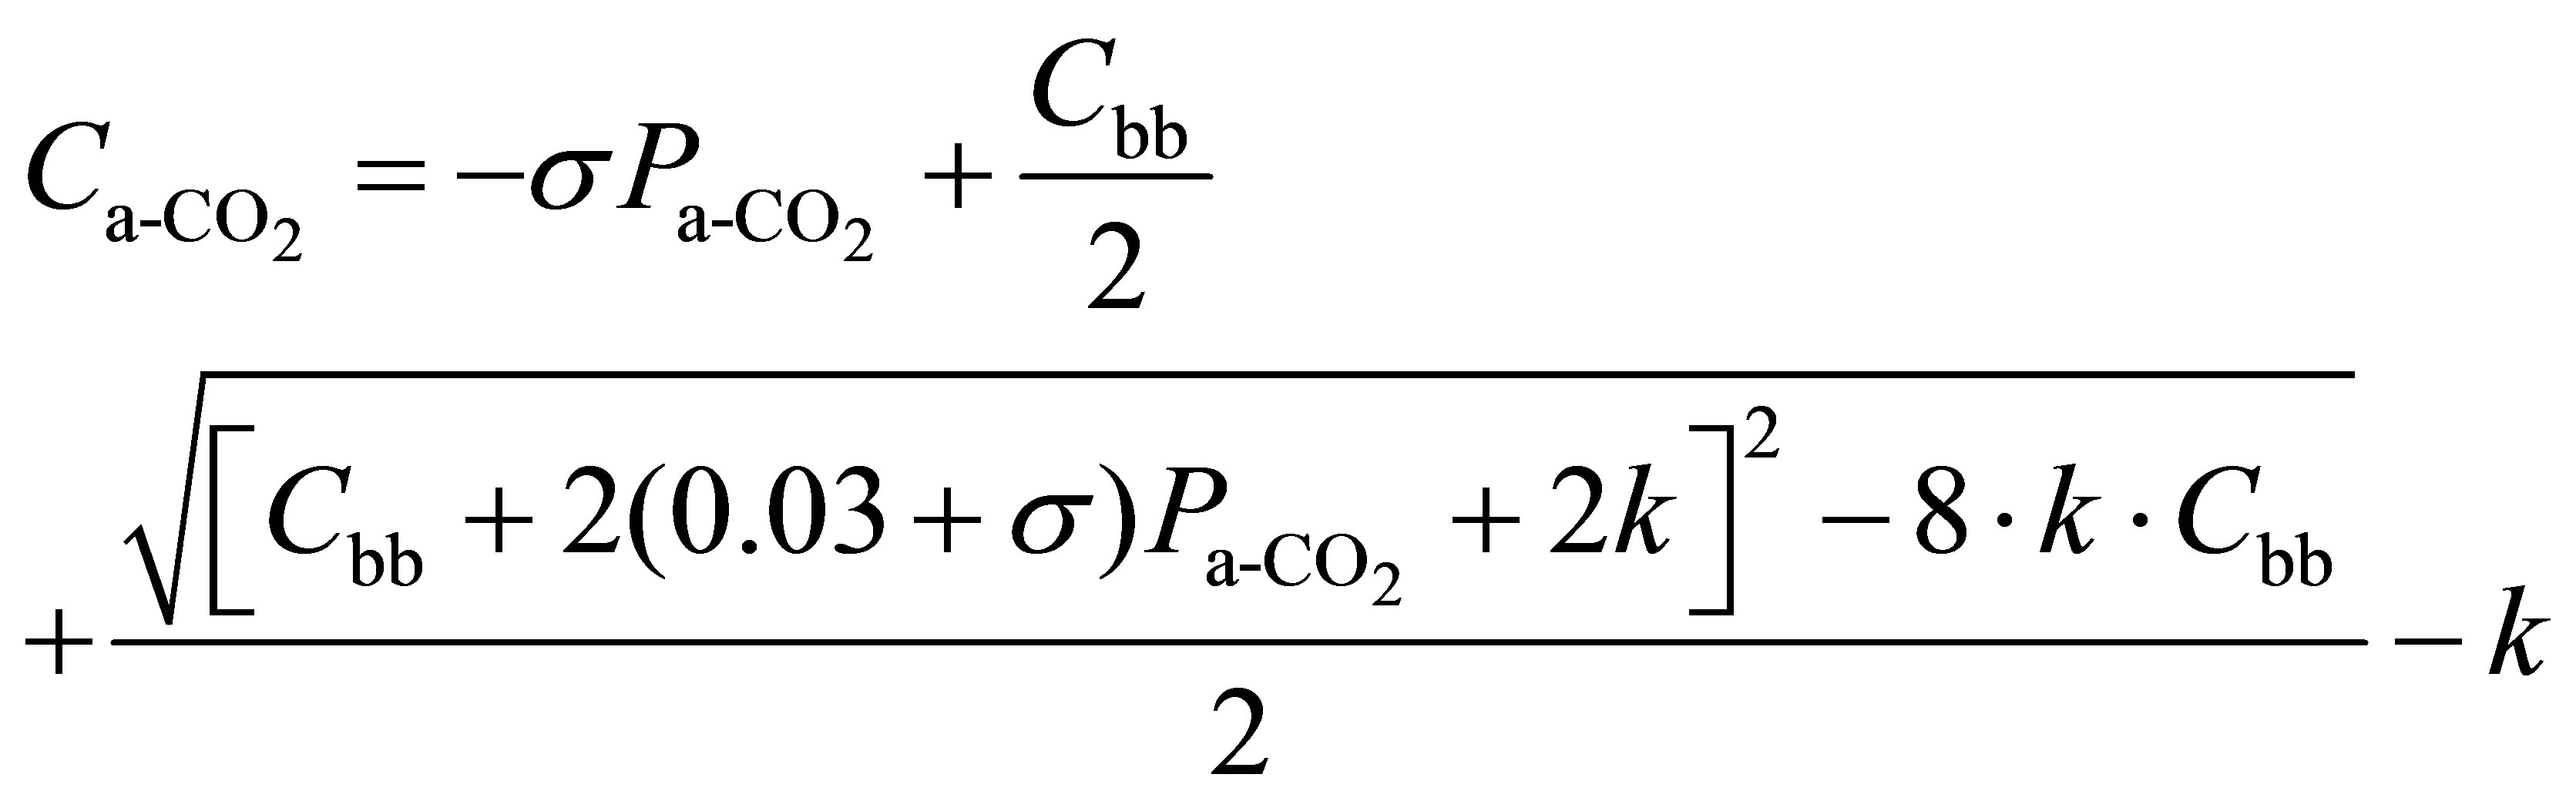
3.3. Formulation of Carbon Dioxide Exchange in the Body Tissue Compartment
The body tissues are assumed to be lumped together in one compartment. The change of carbon dioxide concentration is determined by a balance between the net rate of carbon dioxide transported to the tissues by the blood and the net rate at which carbon dioxide is produced by the tissues. By assuming that the gas tensions in the body tissues are uniform and at every instant equal to those in the mixed venous blood returning to the lungs, the mass balance equations for the tissue compartment and the related formulas can be written [5-11]:
 (20)
(20)
 (21)
(21)
 (22)
(22)
 (23)
(23)
 concentration of bound and dissolved CO2 in arterial blood Cbb is the buffer base concentrations
 concentration of bound and dissolved CO2 in the mixed venous blood
 is the partial pressure of CO2 in arterial blood Pa-s is the mean blood pressure in the arterial region of the systemic circuit
 partial pressure of CO2 in the mixed venous blood Pv-s is the mean blood pressure in the venous region of the systemic circuitt is the time
 effective tissue storage volume for CO2
Φs the systemic blood flow
 steady state metabolic CO2 production rate
τpr-s is the peripheral resistance in the systemic circuit
σ and k are constant parameters Generally, we assume the equality between left cardiac output, right cardiac output, the systemic blood flow and the pulmonary blood flow [11]. The results of those equations will be used to model the production and elimination of acids and bases wastes, subject of the following paragraph.
3.4. Formulations for the Kidney/Dialyser Compartment
To simulate the production and elimination of acids and bases in body fluids, the buffer base concentration has been considered as a further state variable. The change in the buffer content of whole blood is determined as function of the changes in plasma pH and in plasma’s bicarbonate  content [16]. The buffer base concentrations in the equations (21) and (22) can be deduced from the following equations [16]:
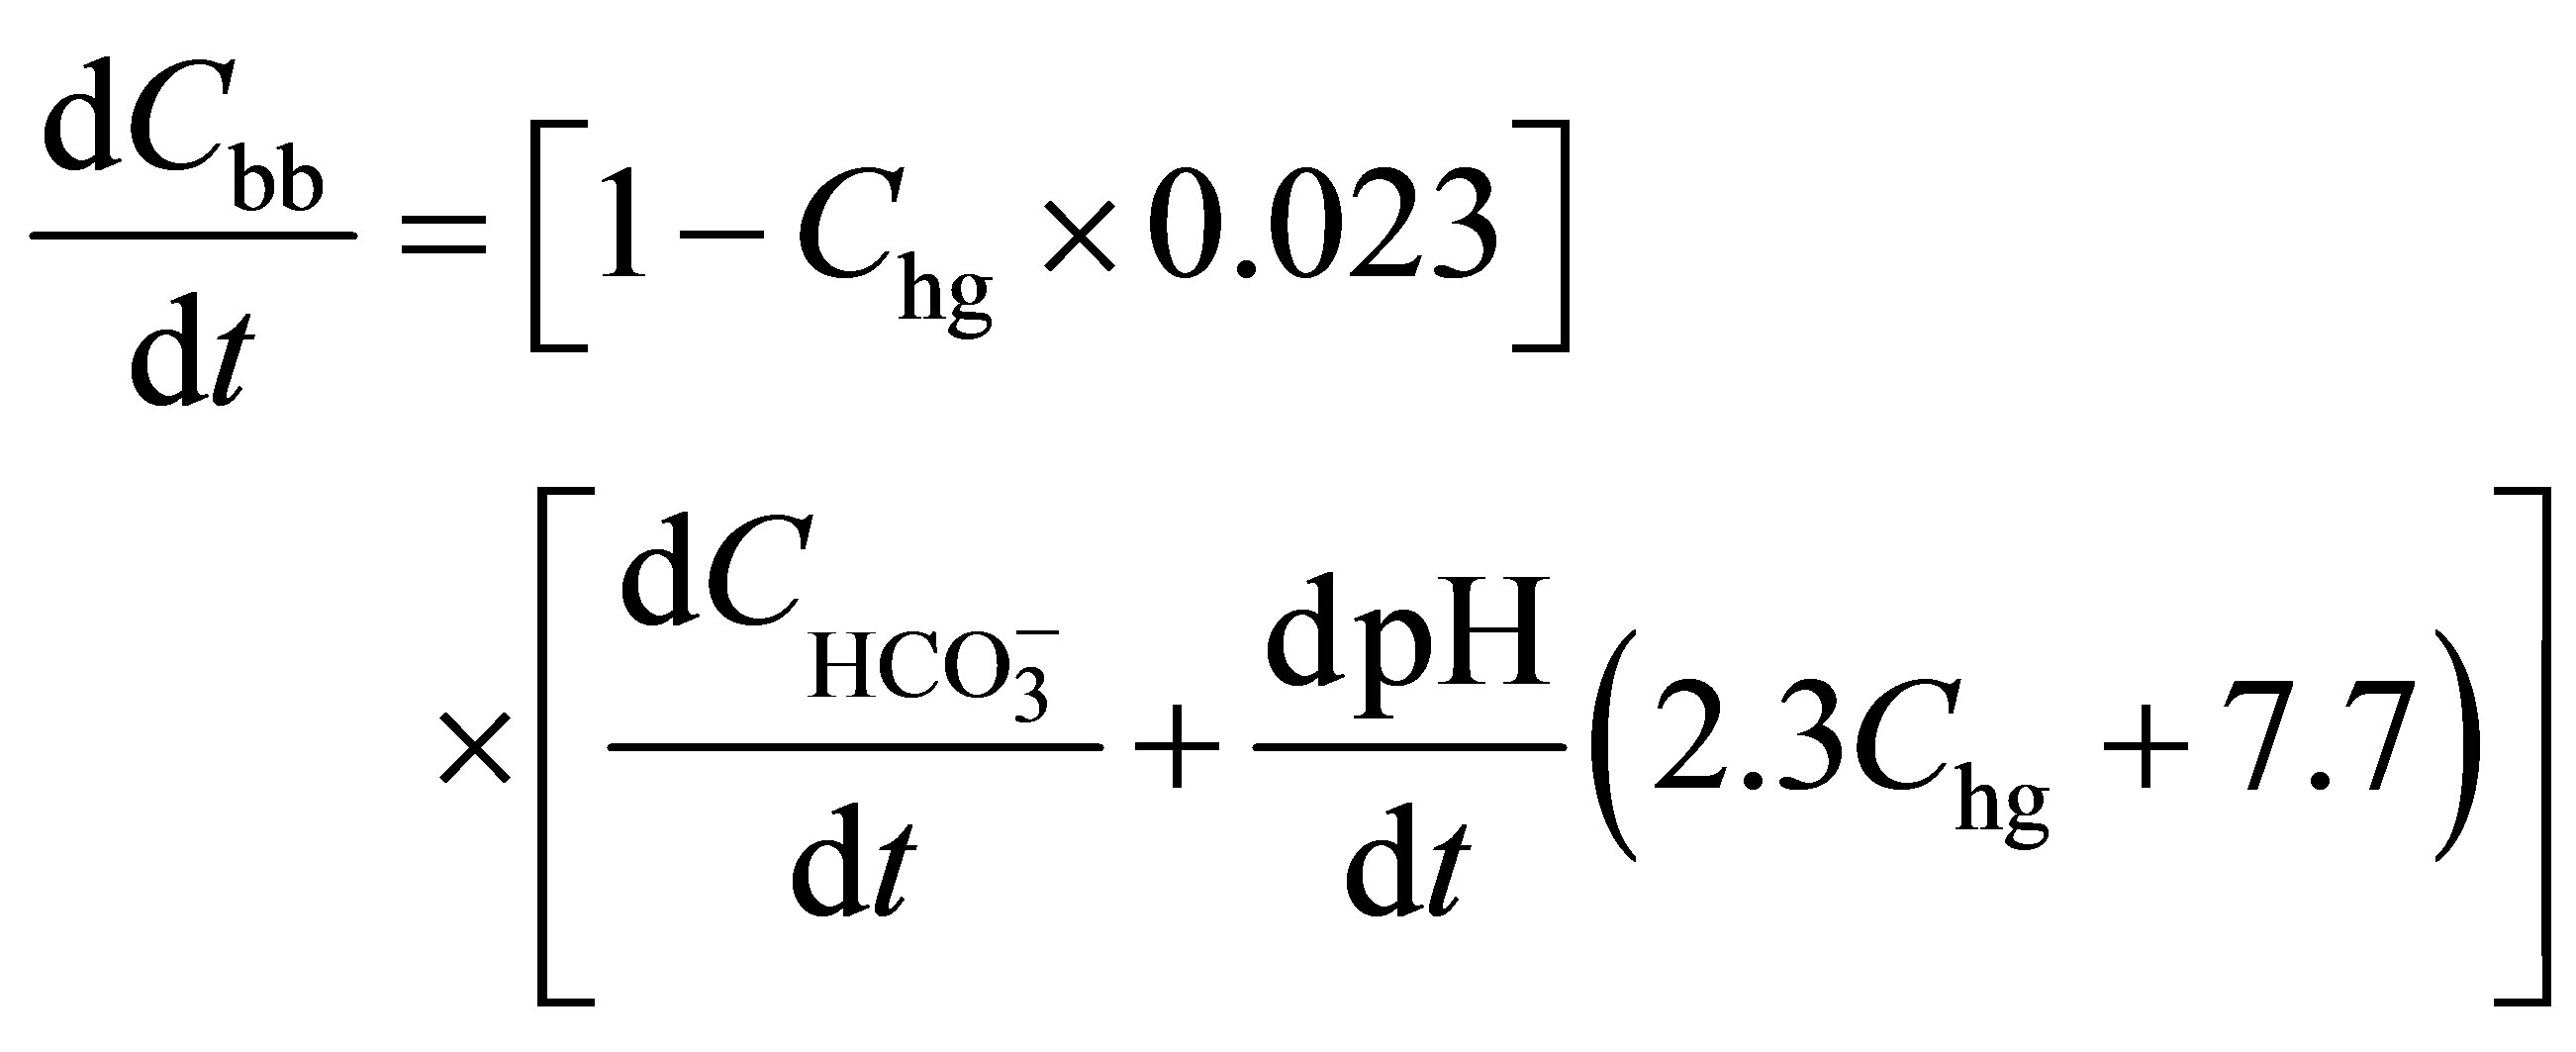 (24)
(24)
 (25)
(25)
Cbb is the buffer base concentrations Chg is the haemoglobin content of whole blood
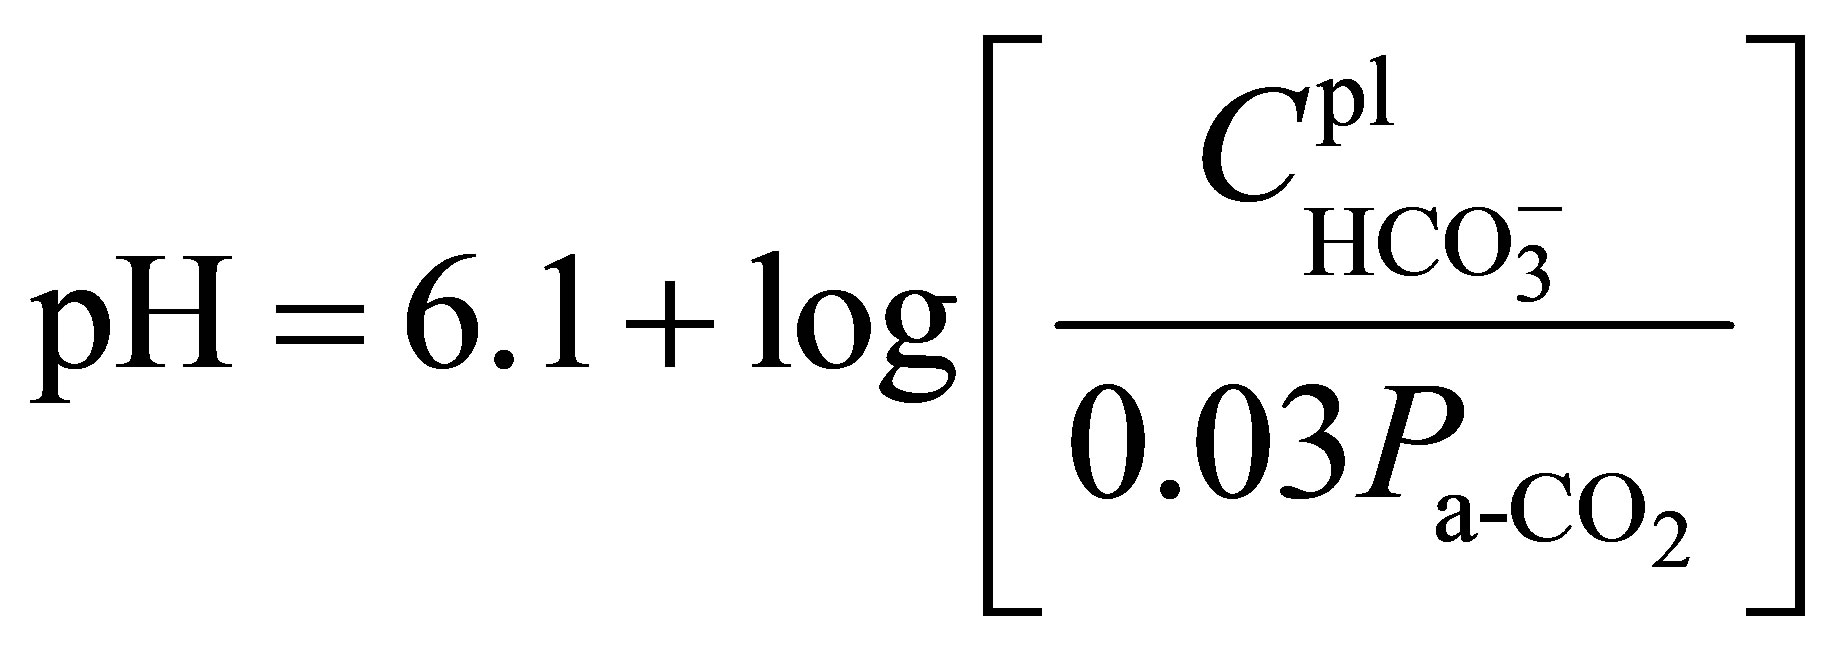
 is the plasma’s bicarbonate content
 is the partial pressure of CO2 in arterial blood pH is the plasma pH (potential hydraulic)
The plasma can be considered as a chemical system in which coexist bicarbonate and a non bicarbonate buffer [5-11]. An efficient buffering permits the balance of the net production of acids in the healthy patient. By contrast, due to an insufficient [H+] ions elimination through the kidneys/dialyser, the buffering term is strongly reduced in the uremic patient. Hemodialysis therapy rests on the premise that the control of blood concentrations for various toxic substances to some maximum value is required for the adequate treatment. We will devise here a general equation system for predicting the concentration profile of any potential toxic substances in the blood during dialysis [1,13,14,17] that can be applied to the urea/creatinine substances:
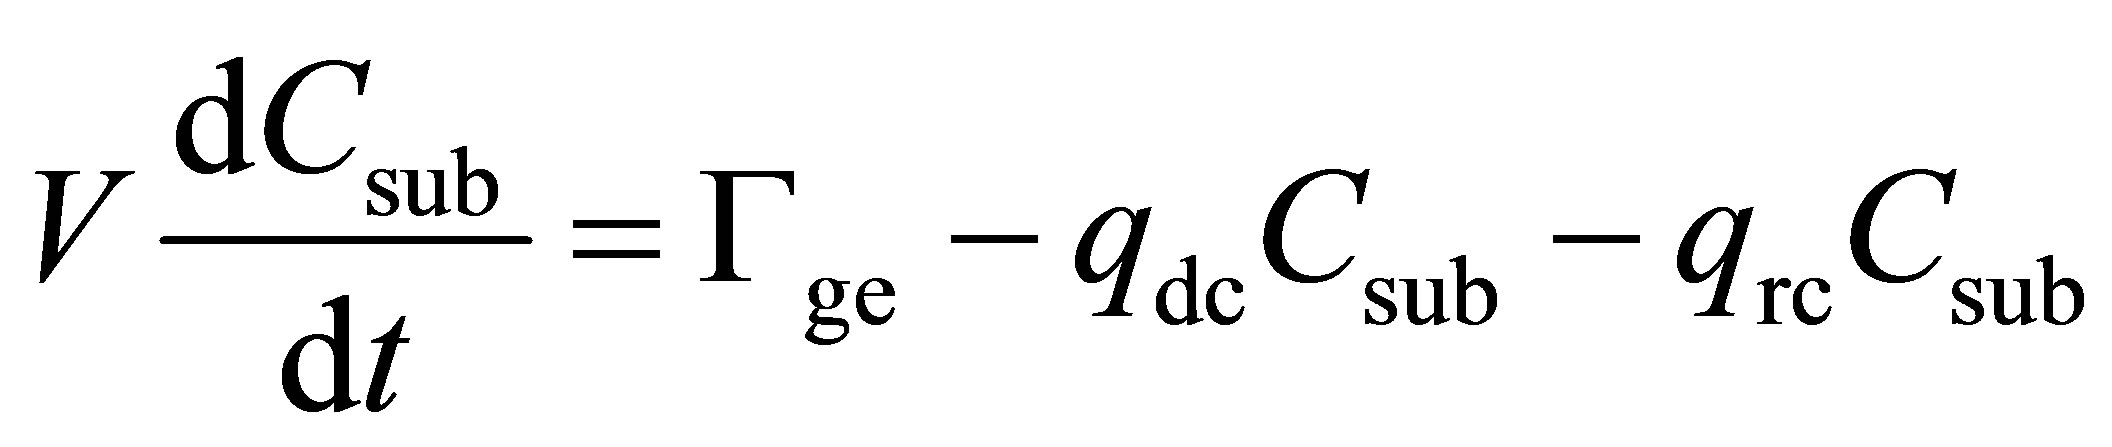 (26)
(26)
 (27)
(27)
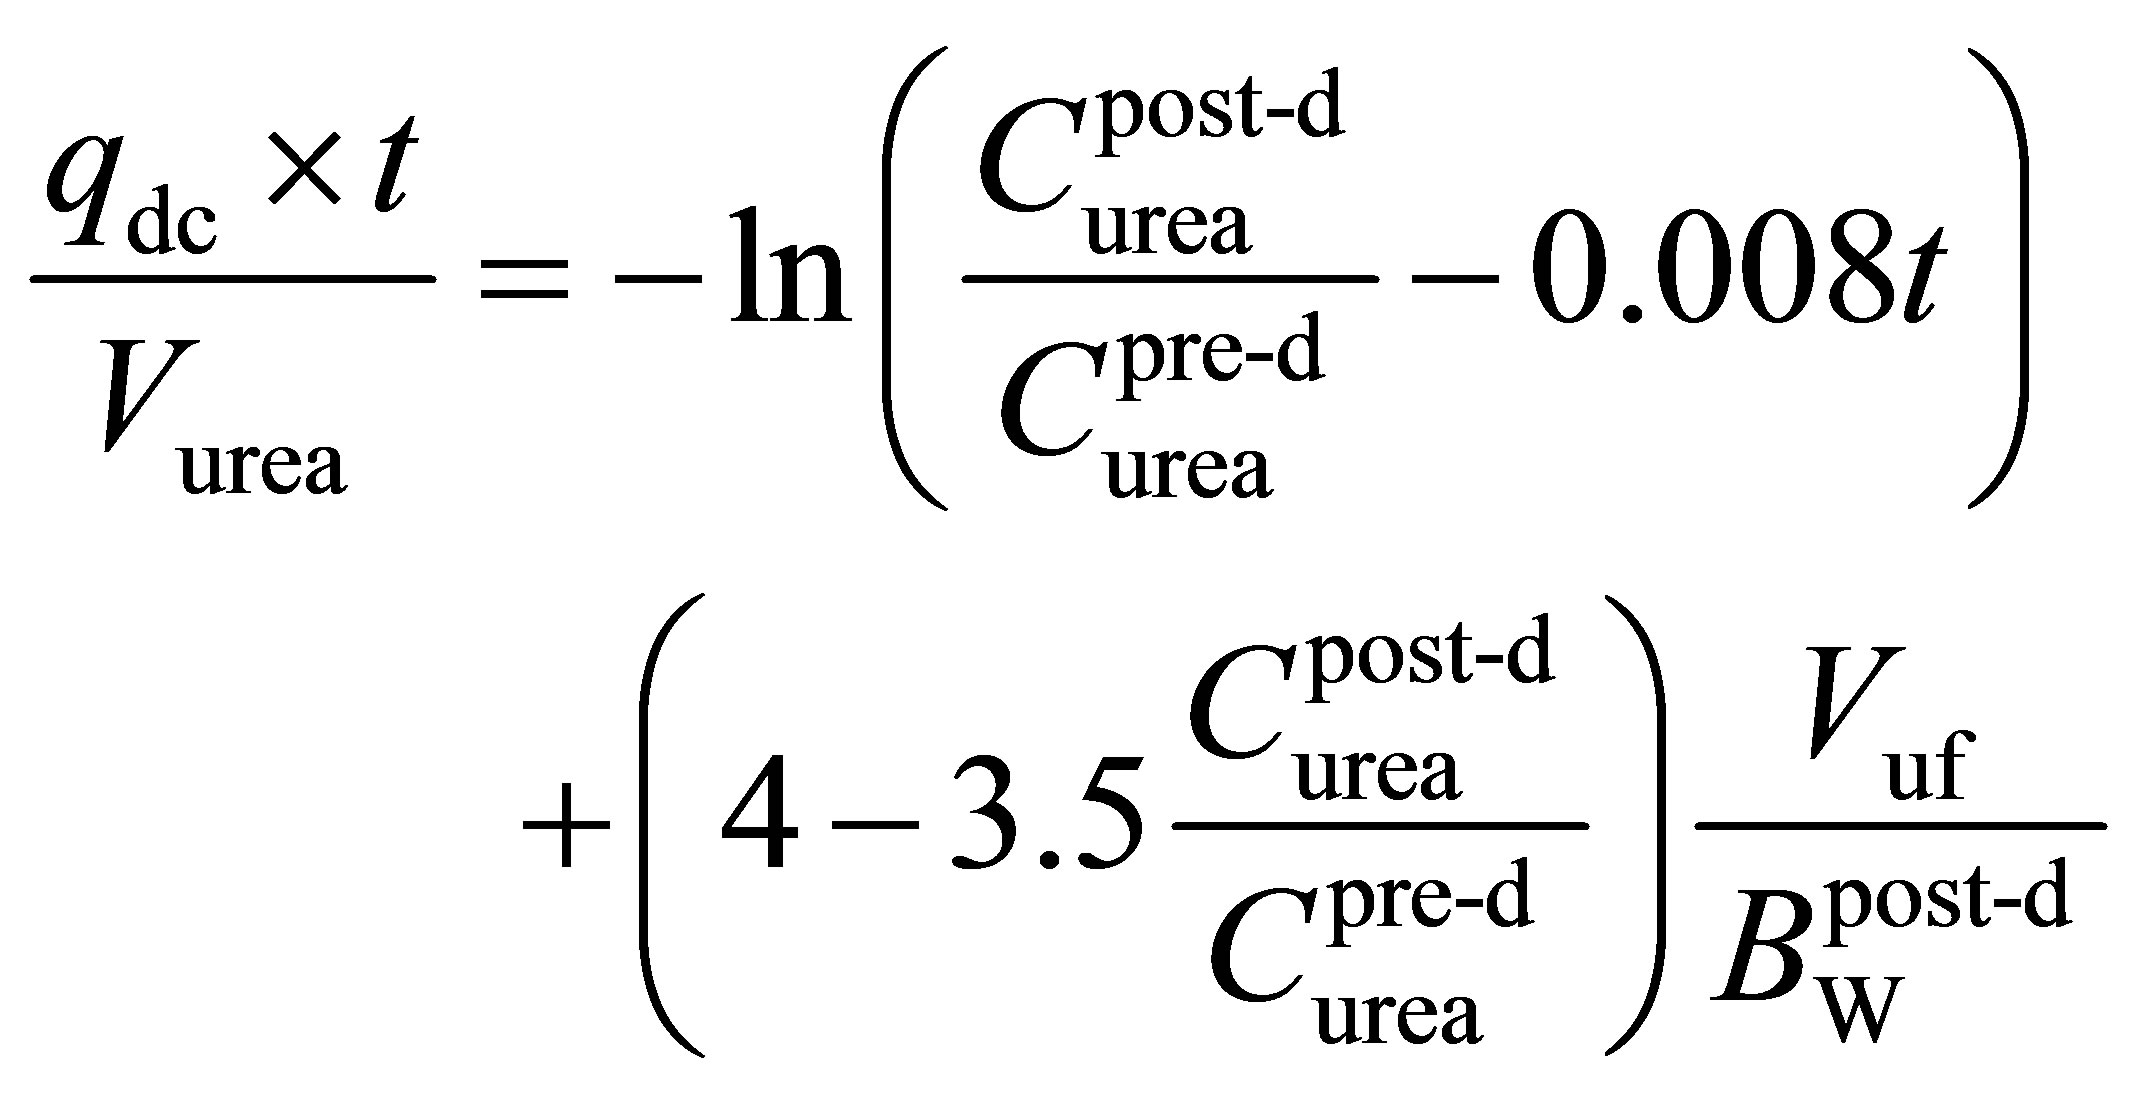 (28)
(28)
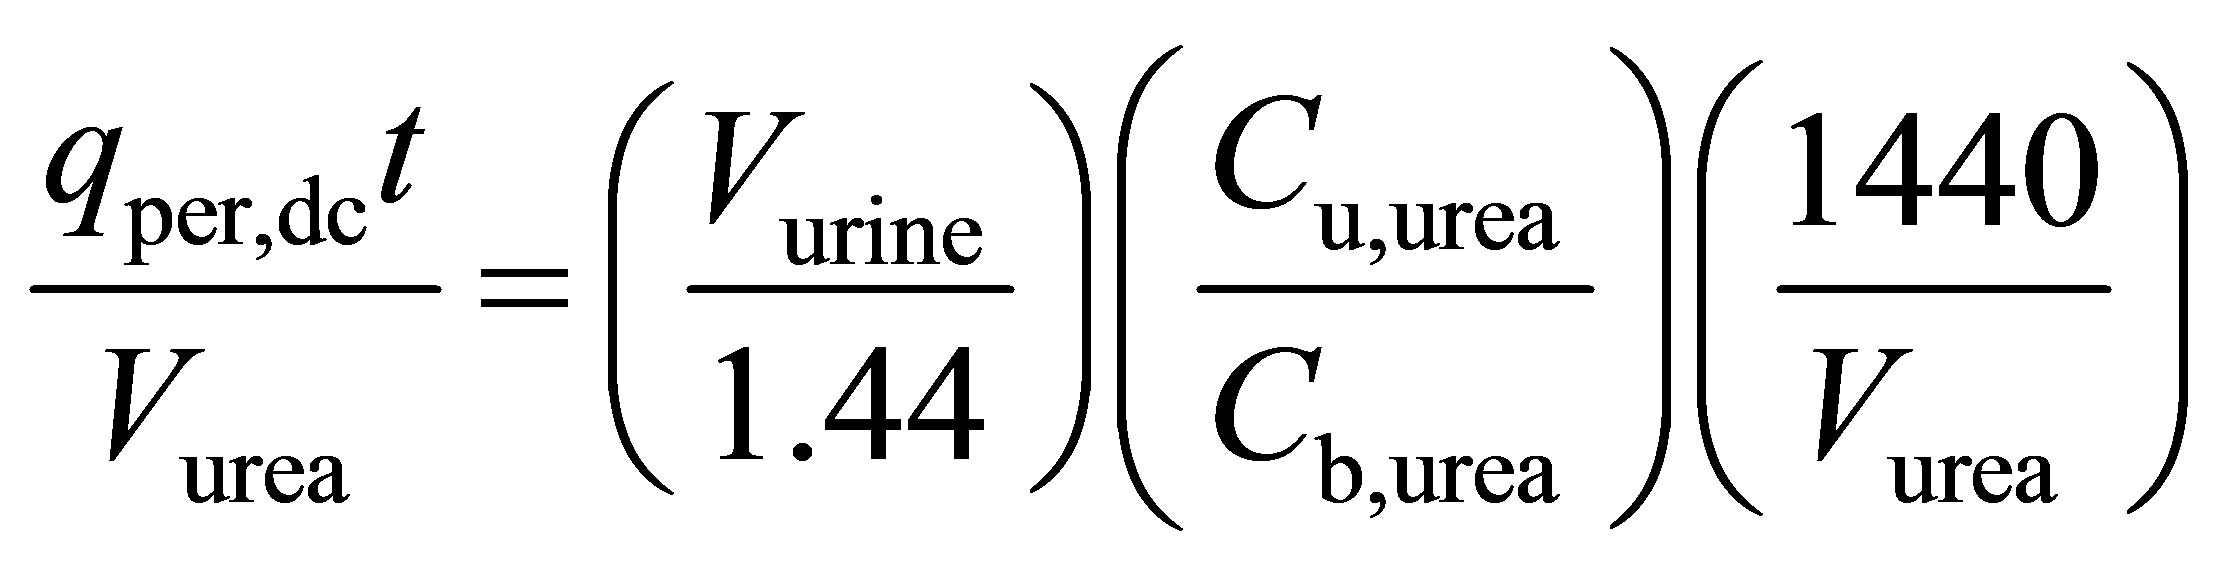 (29)
(29)
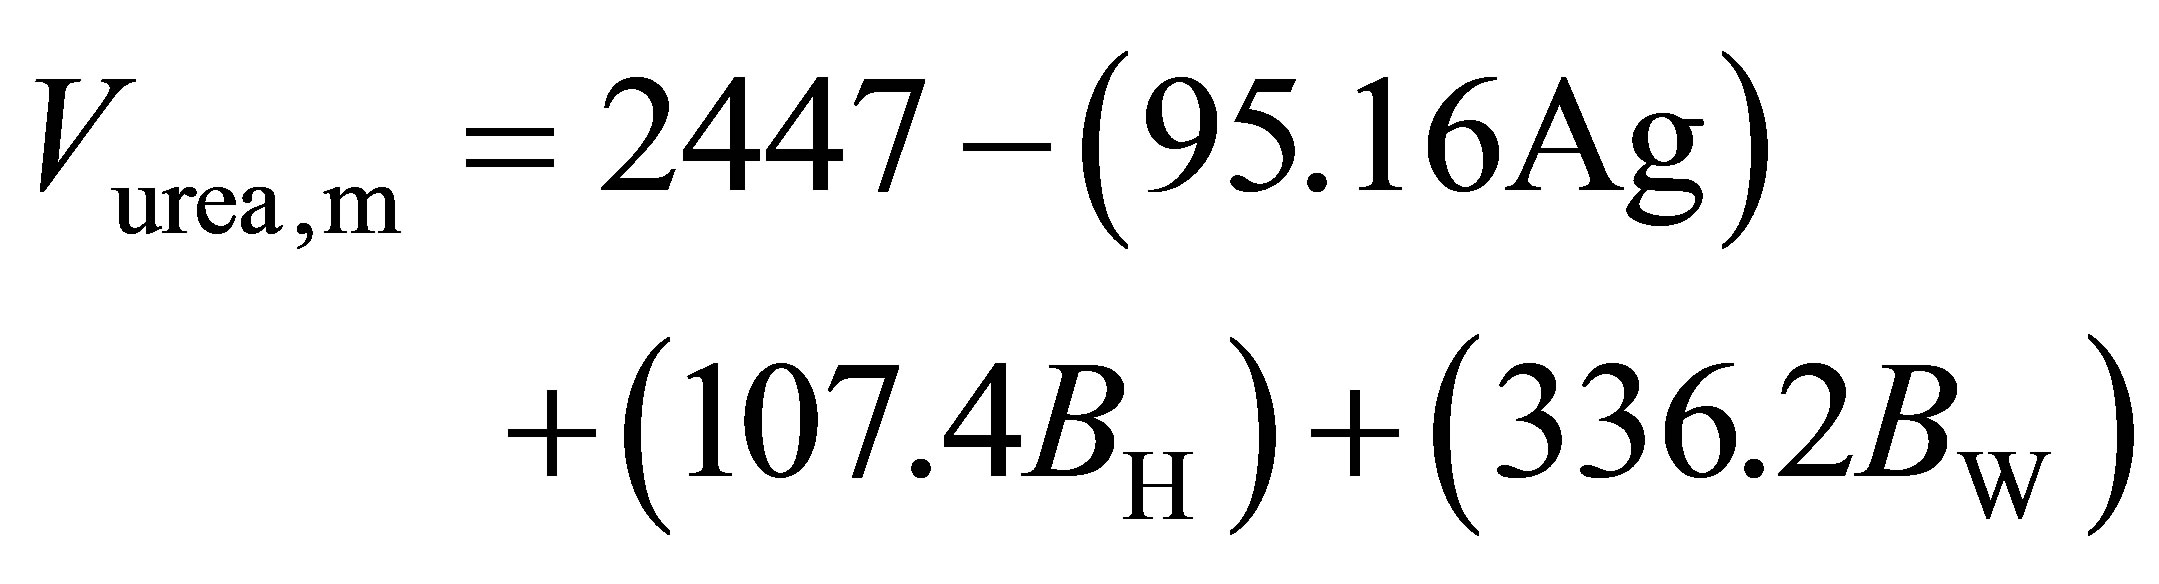 (30)
(30)
 (31)
(31)
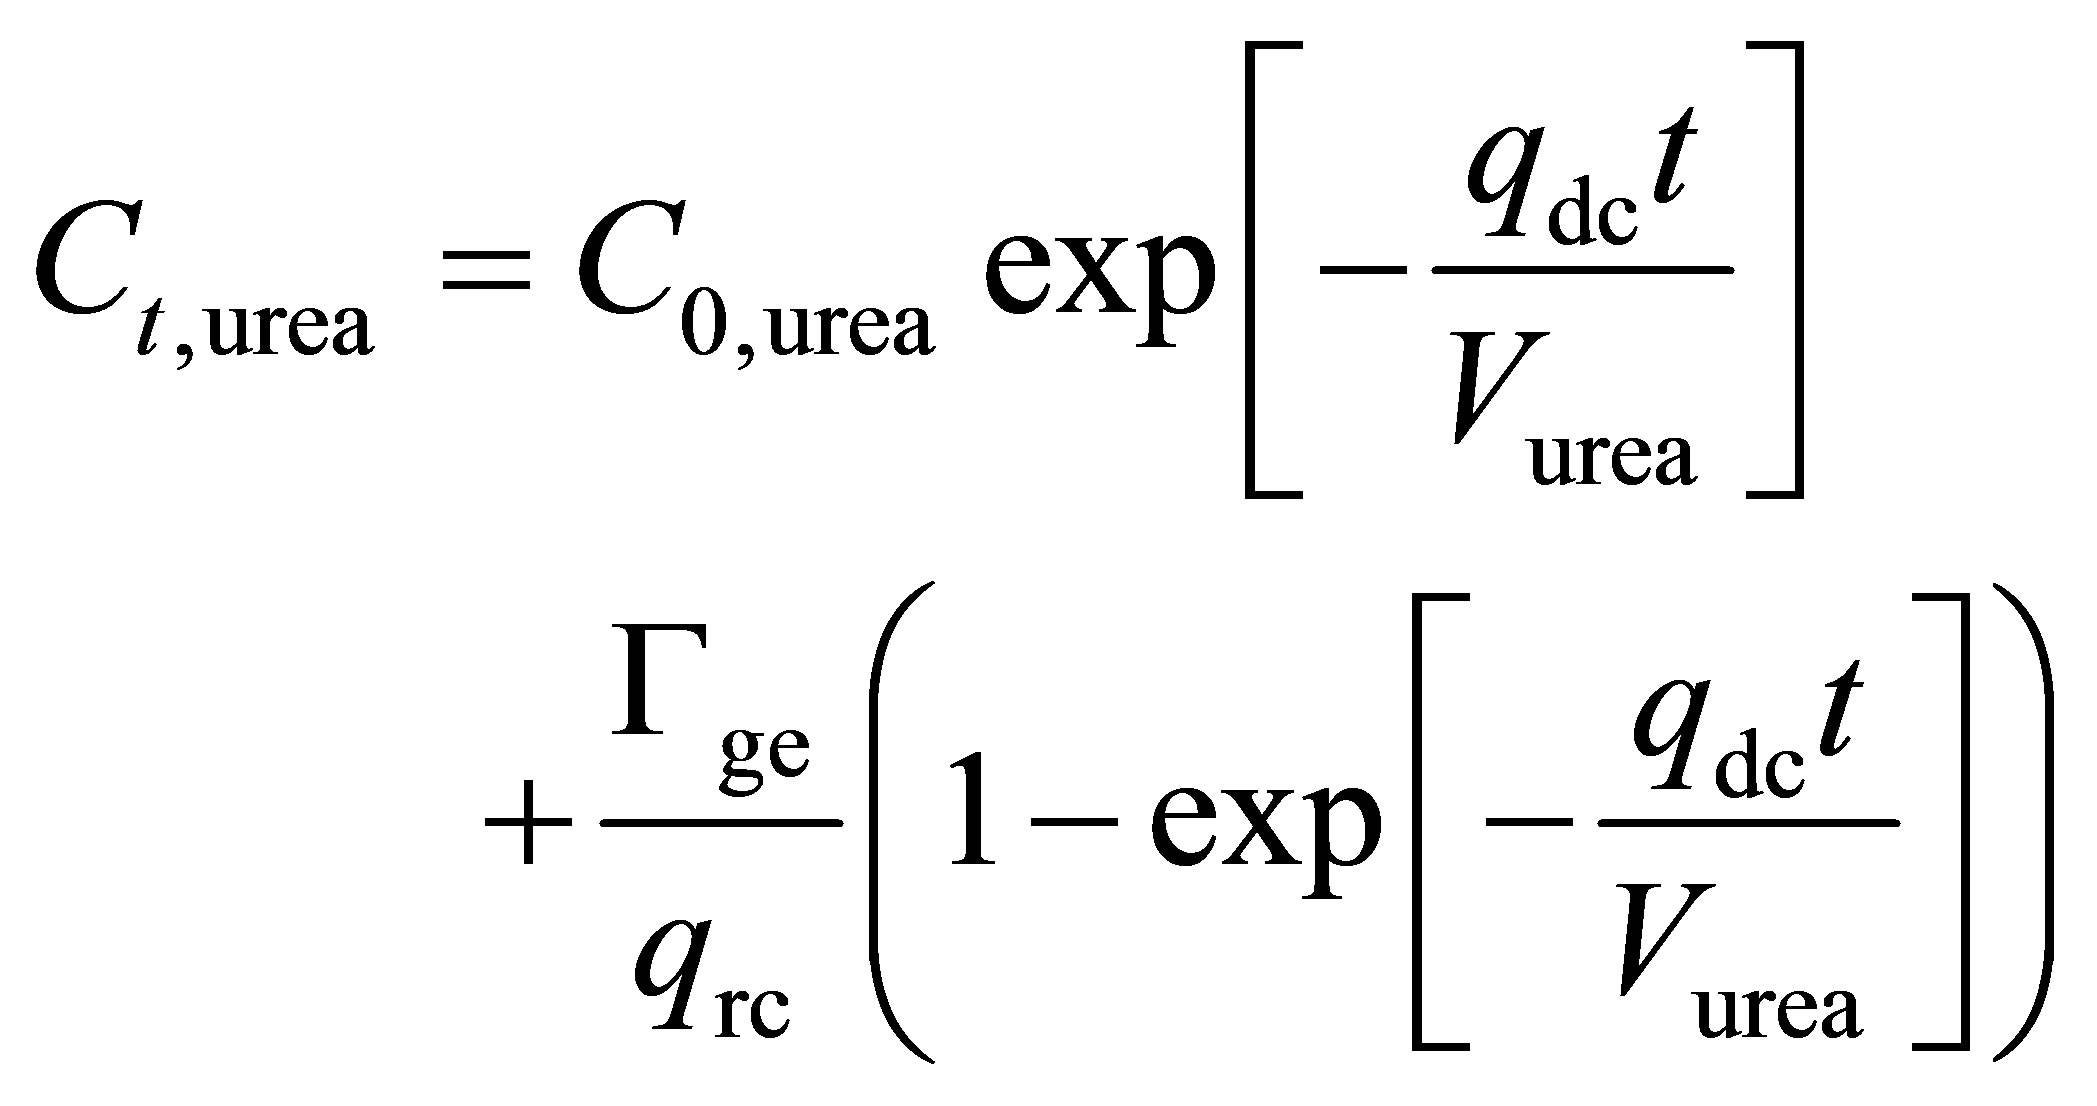
Ag is the age in years BH is the body height Bw is the body weight
 is the body post-dialysis weight Cb,urea is the urea concentration in blood Csub is the toxic substance concentration in the blood to be eliminated Ct,urea is the final solute concentration at the end of each dialysis session (t).
Cu,urea is the urea concentration in dialysate or in urine
 is the post-dialysis urea concentration in blood
 is the pre-dialysis urea concentration in blood C0,urea is the initial solute concentration at the beginning of each dialysis.
qdc is the dialyser clearance for any substance
 is peritoneal dialysis clearance for any substance qrc is the renal clearance for any substance t is the treatment time Vuf is the ultrafiltrate volume Vurea is the body urea distribution volume Vurine is the dialysate or the urine volume in 24 h Vurea,m is the urea volume for man Vurea,w is the urea volume for woman Since the total kidney glomerular filtration rate is equal to the sum of the filtration rates in each of the functioning nephrons, it can be used as an index of functioning renal mass. A decrease of the total kidney glomerular filtration rate precedes kidney failure in all forms of progressive disease. Under steady-state conditions and by considering patient’s age, gender and ethnicity, the total kidney glomerular filtration rate can be estimated, for the urea clearance and creatinine clearance, from the following equations [12,15]:
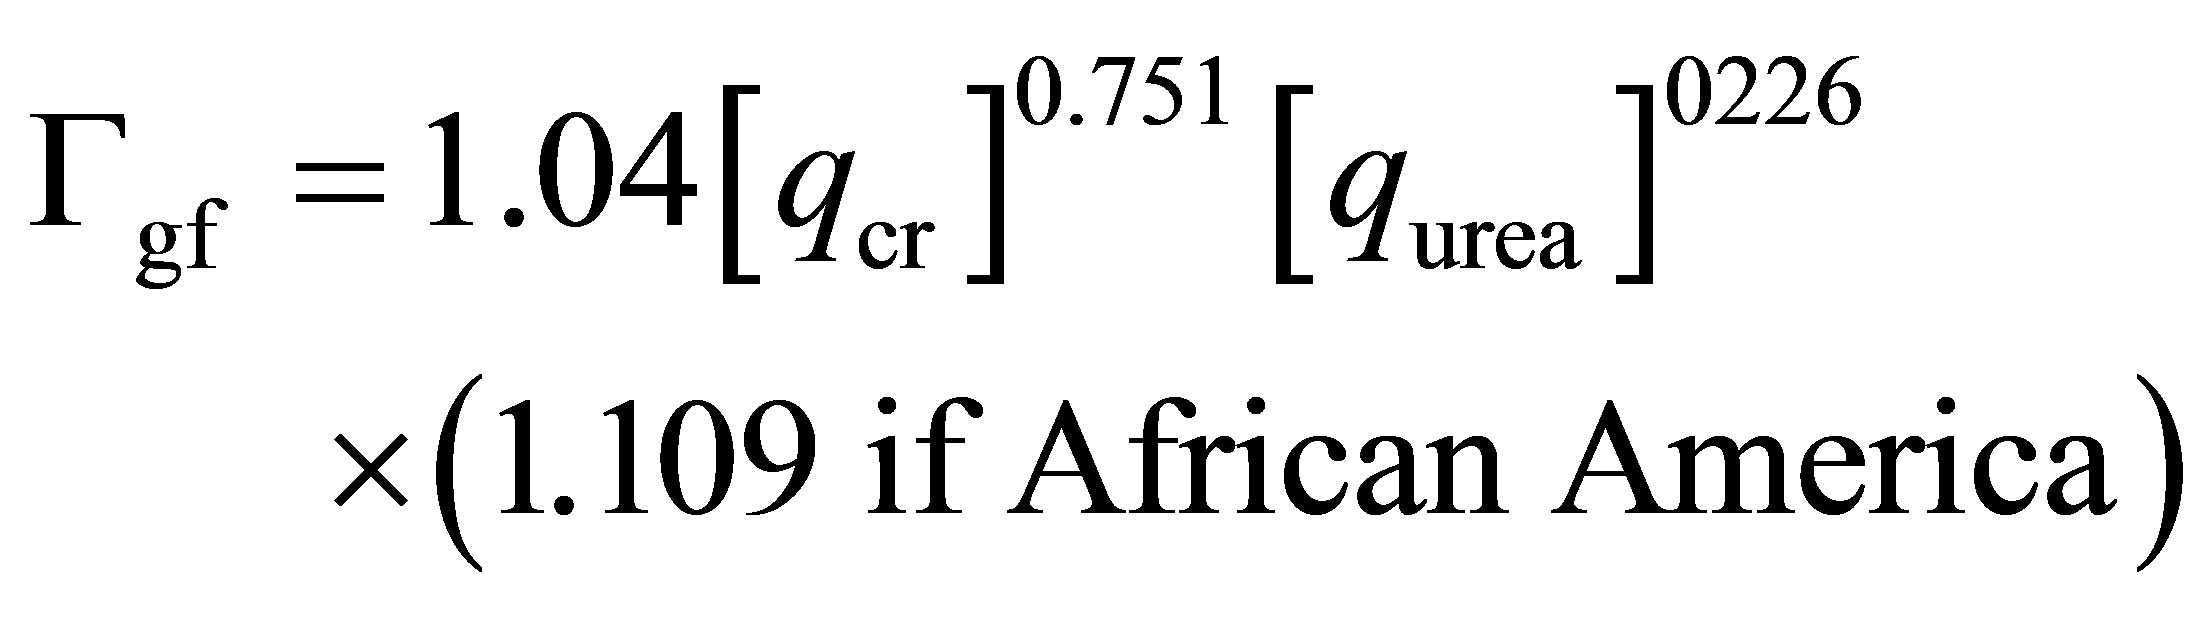 (32)
(32)
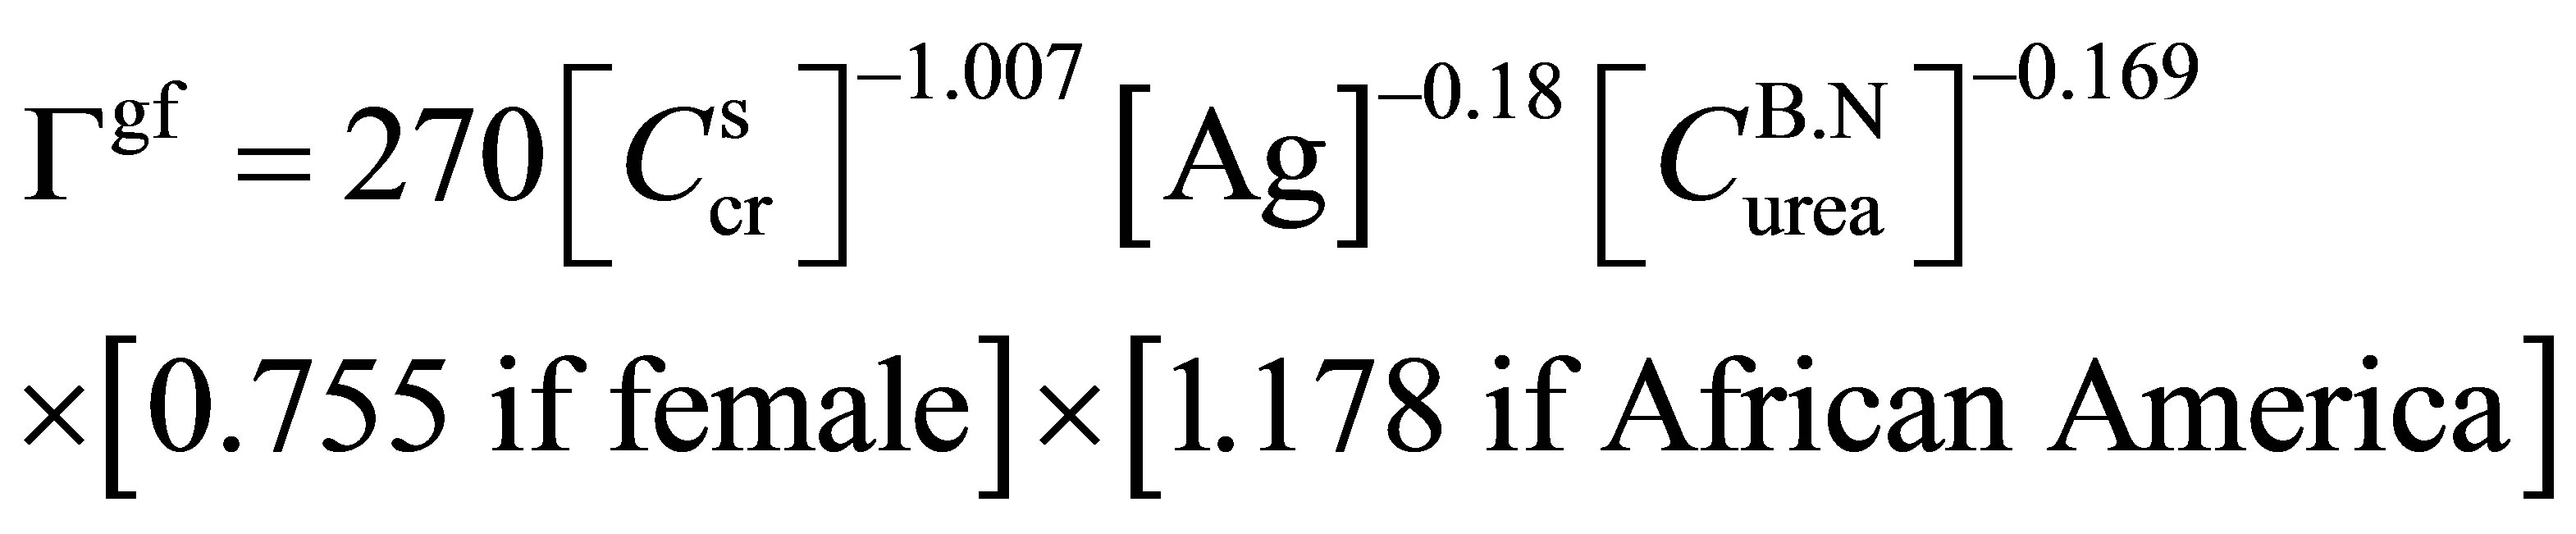 (33)
(33)
Ag is the patient age
 is the serum creatinine concentration
 is the blood urea nitrogen concentration qcr is the ceatinine clearance qurea is the urea clearance
Γgf is the glomerular filtration rate The equations proposed above permit the calculus of the carbon dioxide arterial pressure, its concentration and the blood flow at each compartment (brain, lung, body tissue). The parameters estimated are directly linked to tissue metabolism, metabolite production and the buffer base concentration. Those later influence the kidney/ dialyser function and the status of the hemodialysis Patient. The control role of the model, the function of each compartment and the link between them will be discussed and clarified in the following paragraph.
4. Block Diagram for the Model Functioning
The equations proposed above permit the calculus of the carbon dioxide arterial pressure, its concentration and the blood flow at each compartment (brain, lung, body tissue). The parameters estimated are directly linked to tissue metabolism, metabolite production and the buffer base concentration. Those later influence the kidney/ dialyzer function and the status of the hemodialysis patient. This approach is based on an integration over all human body compartments and on the argument that blood pressure is controlled by several physiological mechanisms acting in combination (Figure 1).
The parameters indicators of the functioning of each compartment were detailed and explained in every correspondent equations. They represent the input or output quantities of the model depending on its usage sense. So the approach permits to quantify the change that can undergo the carbon dioxide arterial blood pressure, the systolic/diastolic blood pressure, the blood flow and the sympathetic nerve activity in each body compartment when there is any anomaly in the kidney/dialyzer system. To verify the running of the model and because the different compartments detailed above have a linked functioning which means that they work as entity in a closed circuit and every one uses the parameters furnished by the other we have make the calculus by considering a unique system embedding the four compartments and by treating the kidney/dialyzer as regulator of all system (Figure 1). So if we change a parameter in the kidney/ dialyzer compartment we must record a change for the parameters indicators of the functioning of other compartments (lung compartment, body tissue compartment, brain compartment, cardiac compartment) with a proportional sensibility. The parameter indicator of the kid-ney/ dialyser efficiency for which we have made a variation is the glomerular filtration rate. We have chosen values in the band of chronic kidney failure, one near the normal band (Γgf = 75 ml/min) and the other far distant (Γgf = 30 ml/min). The parameters indicators of the system functioning that we have chosen are carbon dioxide arterial blood concentration, the systolic/diastolic blood pressure, baroreceptor and sympathetic nerve activities.
5. Results and Discussions
Figure 2 shows the variation of the CO2 concentration in the arterial blood for the tissue compartment.
We note that at the beginning of the dialysis session and for the two values of glomerual filtration rate the
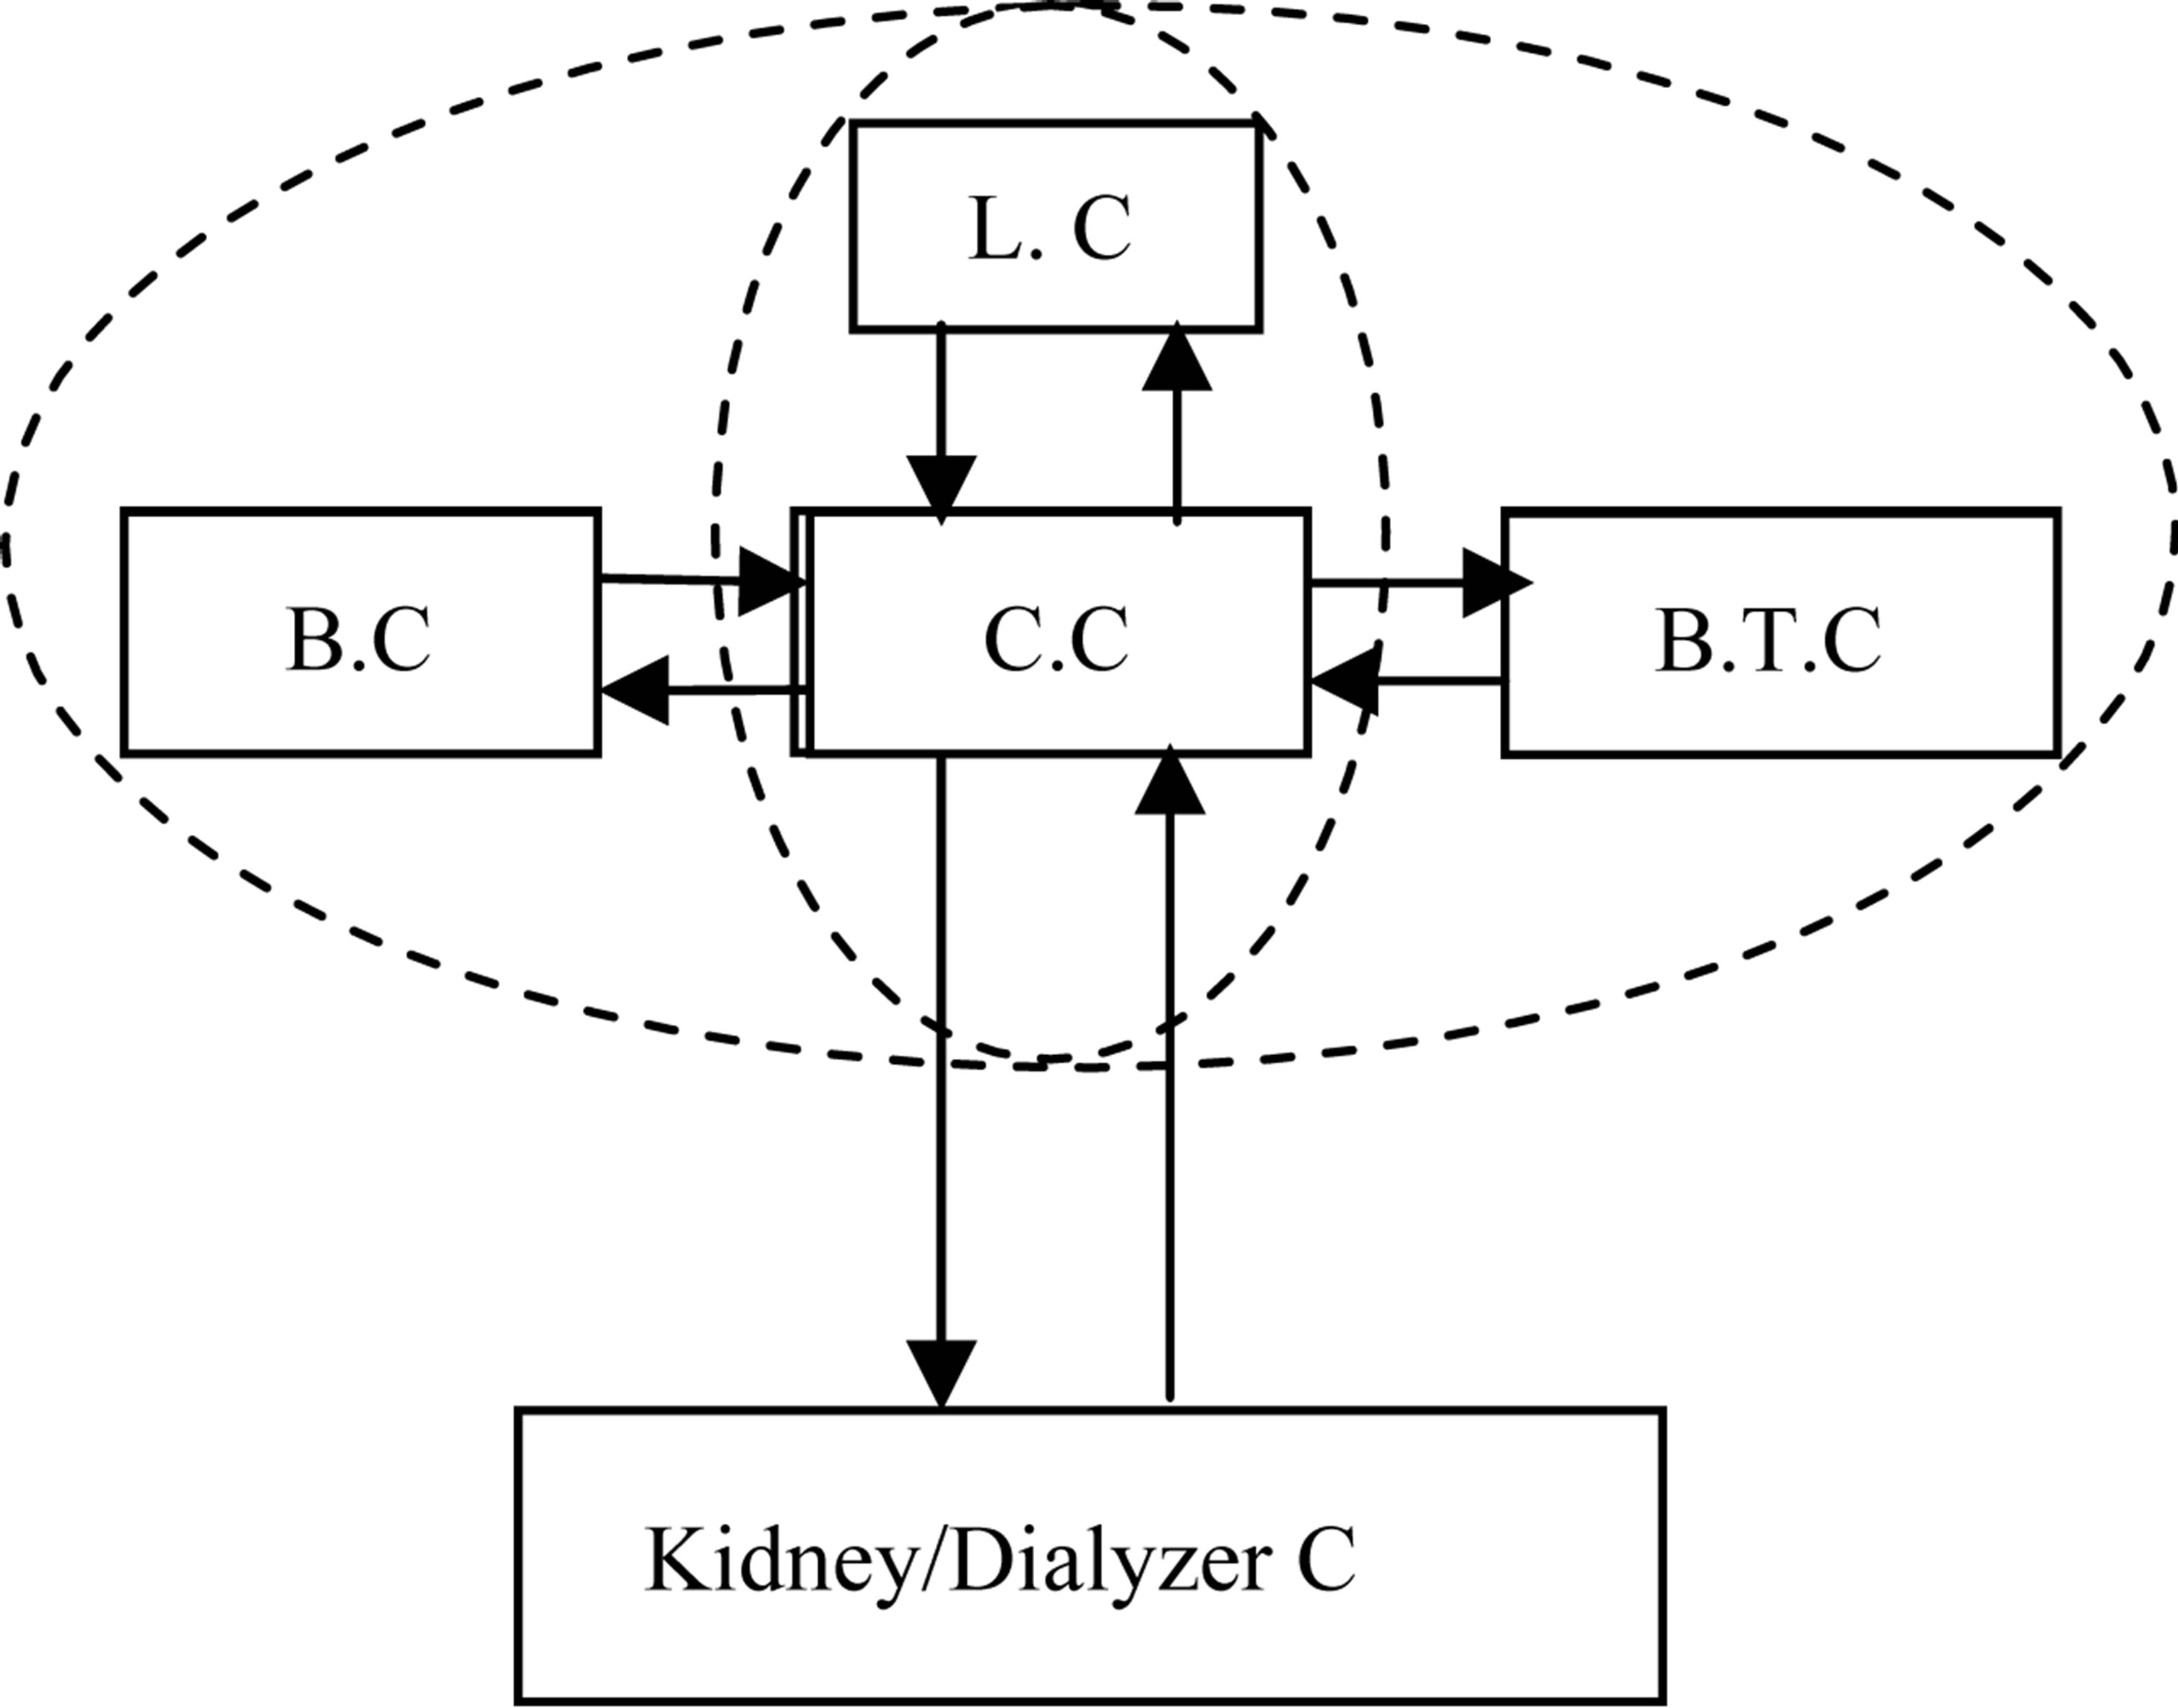
Figure 1. A block diagram for a potential monitoring use of the controlling model (L.C: Lung compartment, C.C: Cardiac compartment, B.C: Brain compartment, B.T.C: Body tissue compartment).
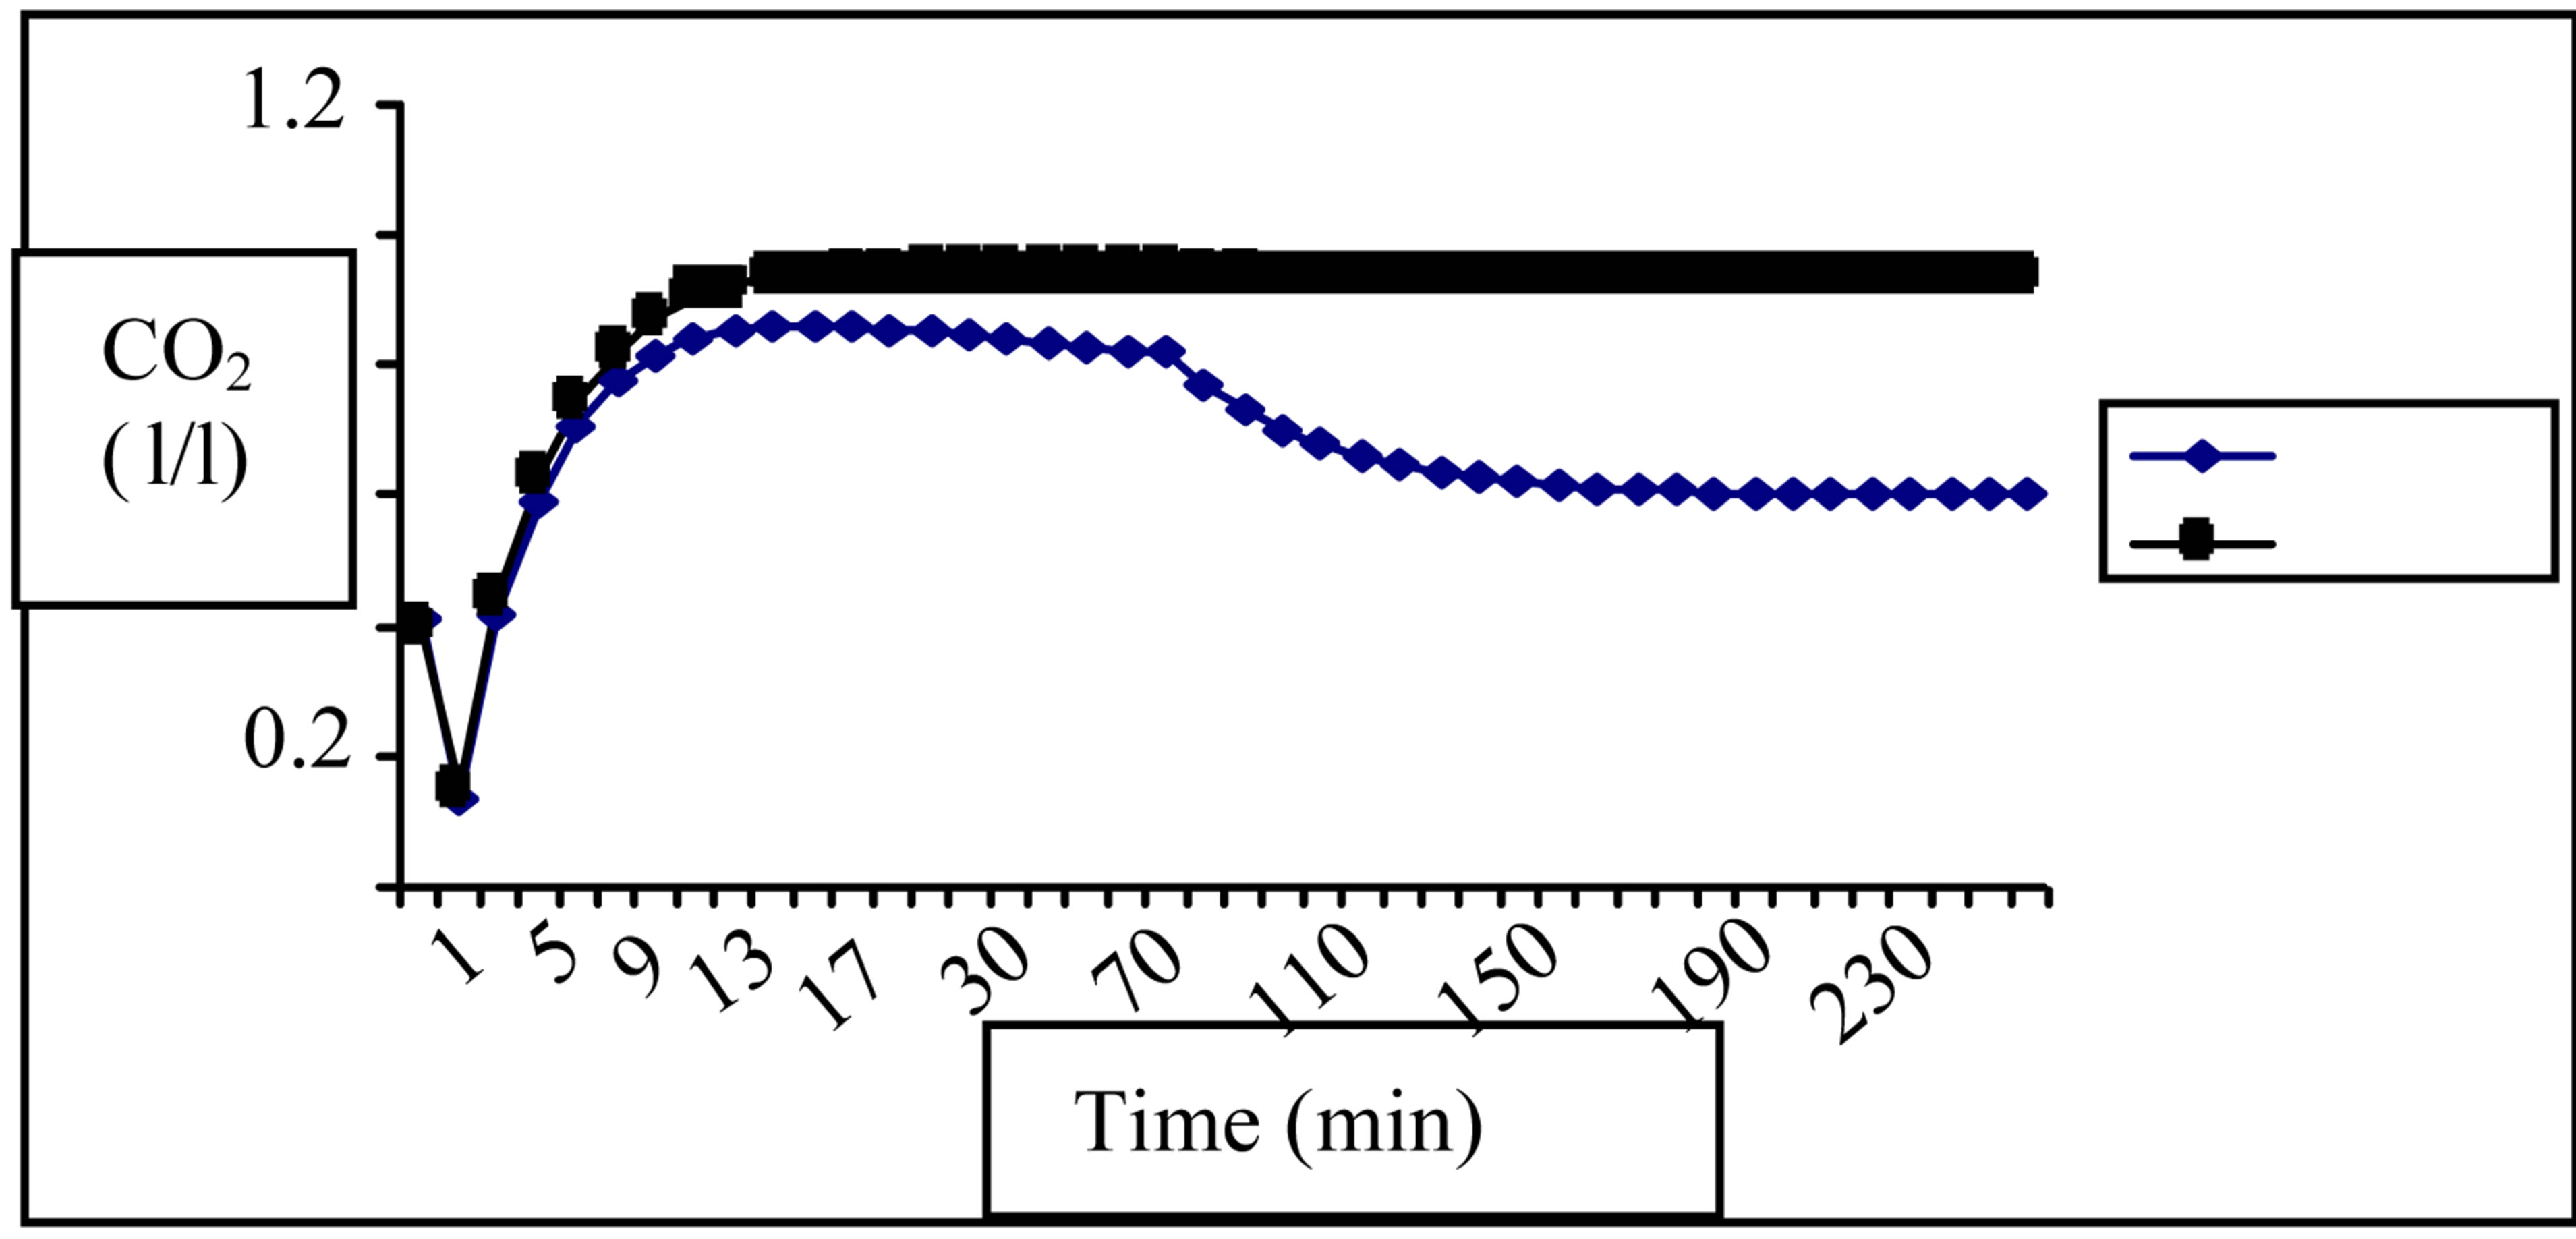
Figure 2. Variation of the CO2 concentration in B.T.C for (Γgf = 30ml/min ) and (Γgf = 75 ml/min ■).
CO2 concentrations are close to each other, decrease slowly in the first five minutes of the session, increase later to reach a threshold closed to 1 l/l for (Γgf = 75 ml/min) and 0.8 for (Гgf = 30 ml/min). We record a progressive decrease for the CO2 concentration corresponding to (Гgf = 30 ml/min) to reach a value of about 0.6 l/l at the end of the dialysis session but the CO2 concentration corresponding to (Γgf = 75 ml/min) retains the threshold value till the finish of the session. The variation of CO2 arterial blood pressure in the body tissue compartment during the treatment is presented in Figure 3. We have noticed the following results:
We record a CO2 pressure increase in the first 5 min of the dialysis session with a closed values for both situations ((Γgf = 75 ml/min) and (Γgf = 30 ml/min). A treshold of about 40mmHg is reached 12 min after the beginning for the curve corresponding to (Γgf = 75 mmHg) and the pressure maintains the same value till the end. For the trend of the case (Гgf = 30 ml/min) we remark that the CO2 arterial blood pressure reaches a maximum of about 18 mmHg at the instant 8 min, it decreases after to attain a minimum of about 20 mmHg at the moment 70 min and it continues with the same value until the end of the session.
In Figure 4 we present the variation of the barorecepetor activity as average over all the dialysis session.
We can say that, the baroreceptor activities for both (Γgf = 75 ml/min) and (Γgf = 30 ml/min) maintains closed values in the first 30 min of the dialysis session with two phases. In the first phase from the beginning of the session till the 10 first minutes there is a decrease of the baroreceptor activity to reach a value of about 0.6. After, the second phase, there is a progressive increase To attain the value 1. From the instant 30 min the slope of increase becomes more important and a net difference between the data of the two curves was recorded. It becomes more significant later. The baroreceptor activity for (Гgf = 75 ml/min) reaches a treshold of about 1.7 at the moment 90 min while for (Γgf = 30 ml/min) the threshold was reached at 80 min and is about 1.4.
The mean variation of the sympathetic activity for the two values of the glomerular filtration rate was revolted
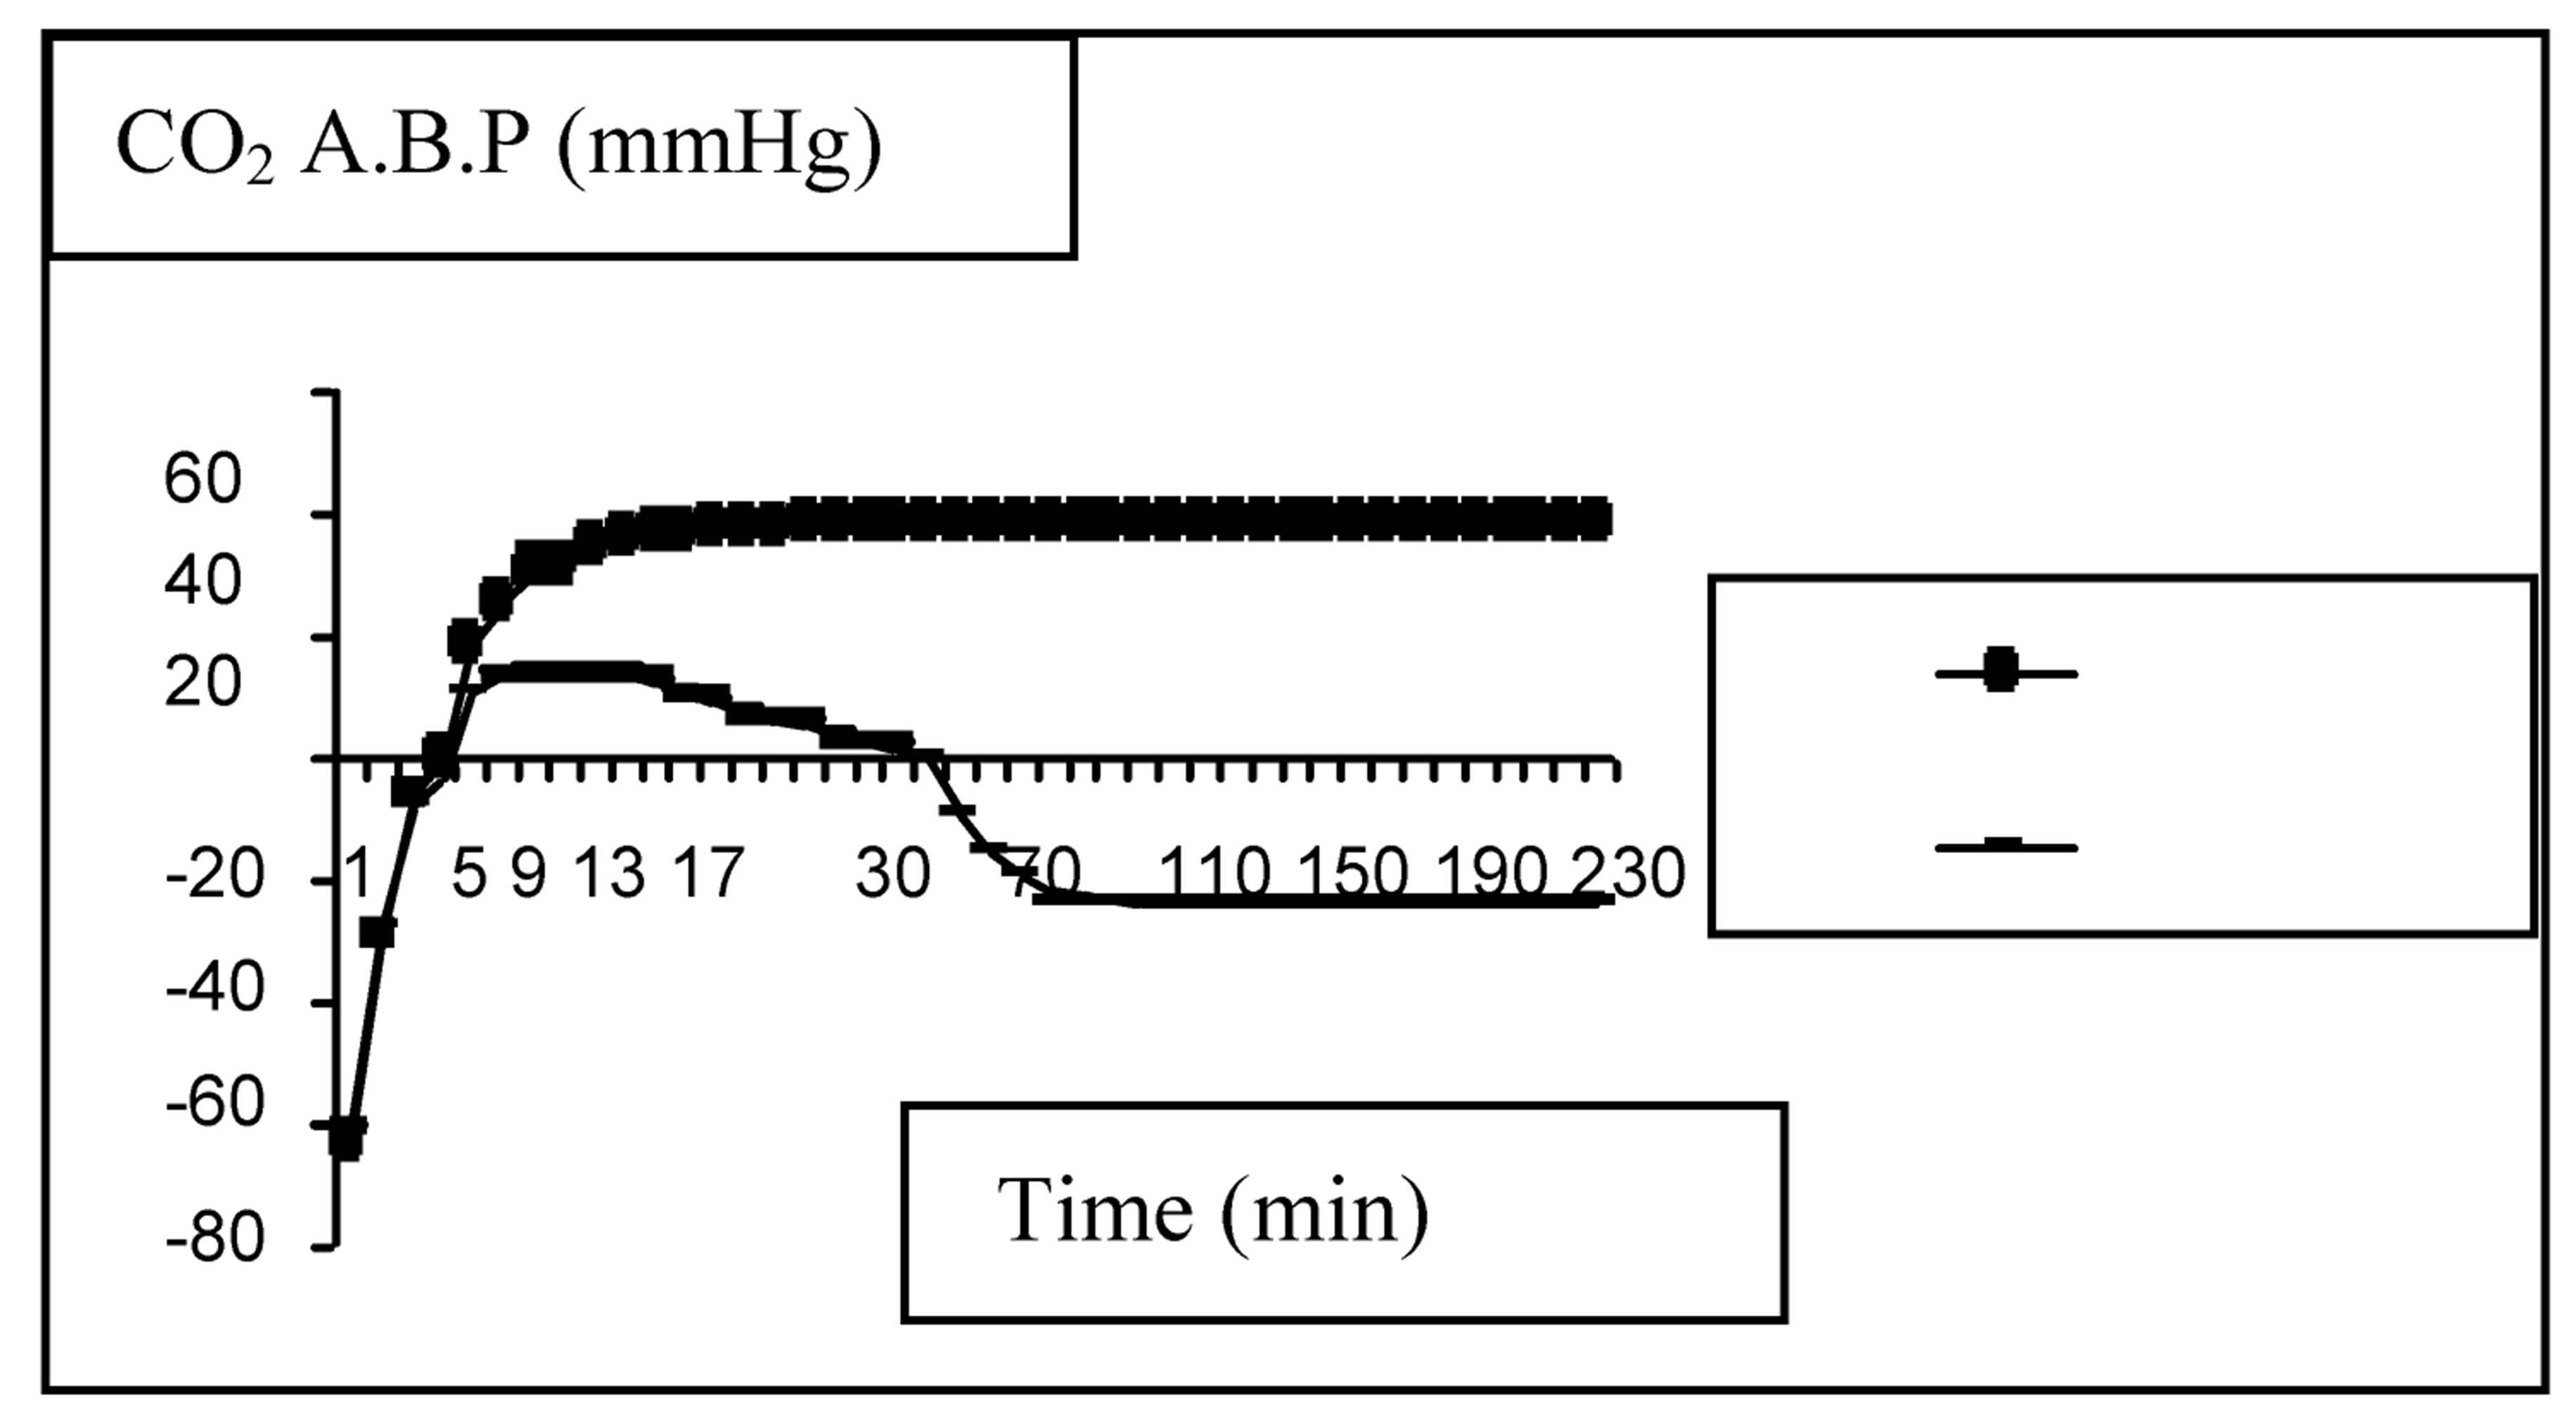
Figure 3. Variation of the CO2 arterial blood pressure (A.B.P.) in the tissue compartment for (Гgf = 75 ml/min ) and (Гgf = 30 ml/min
 ).
).
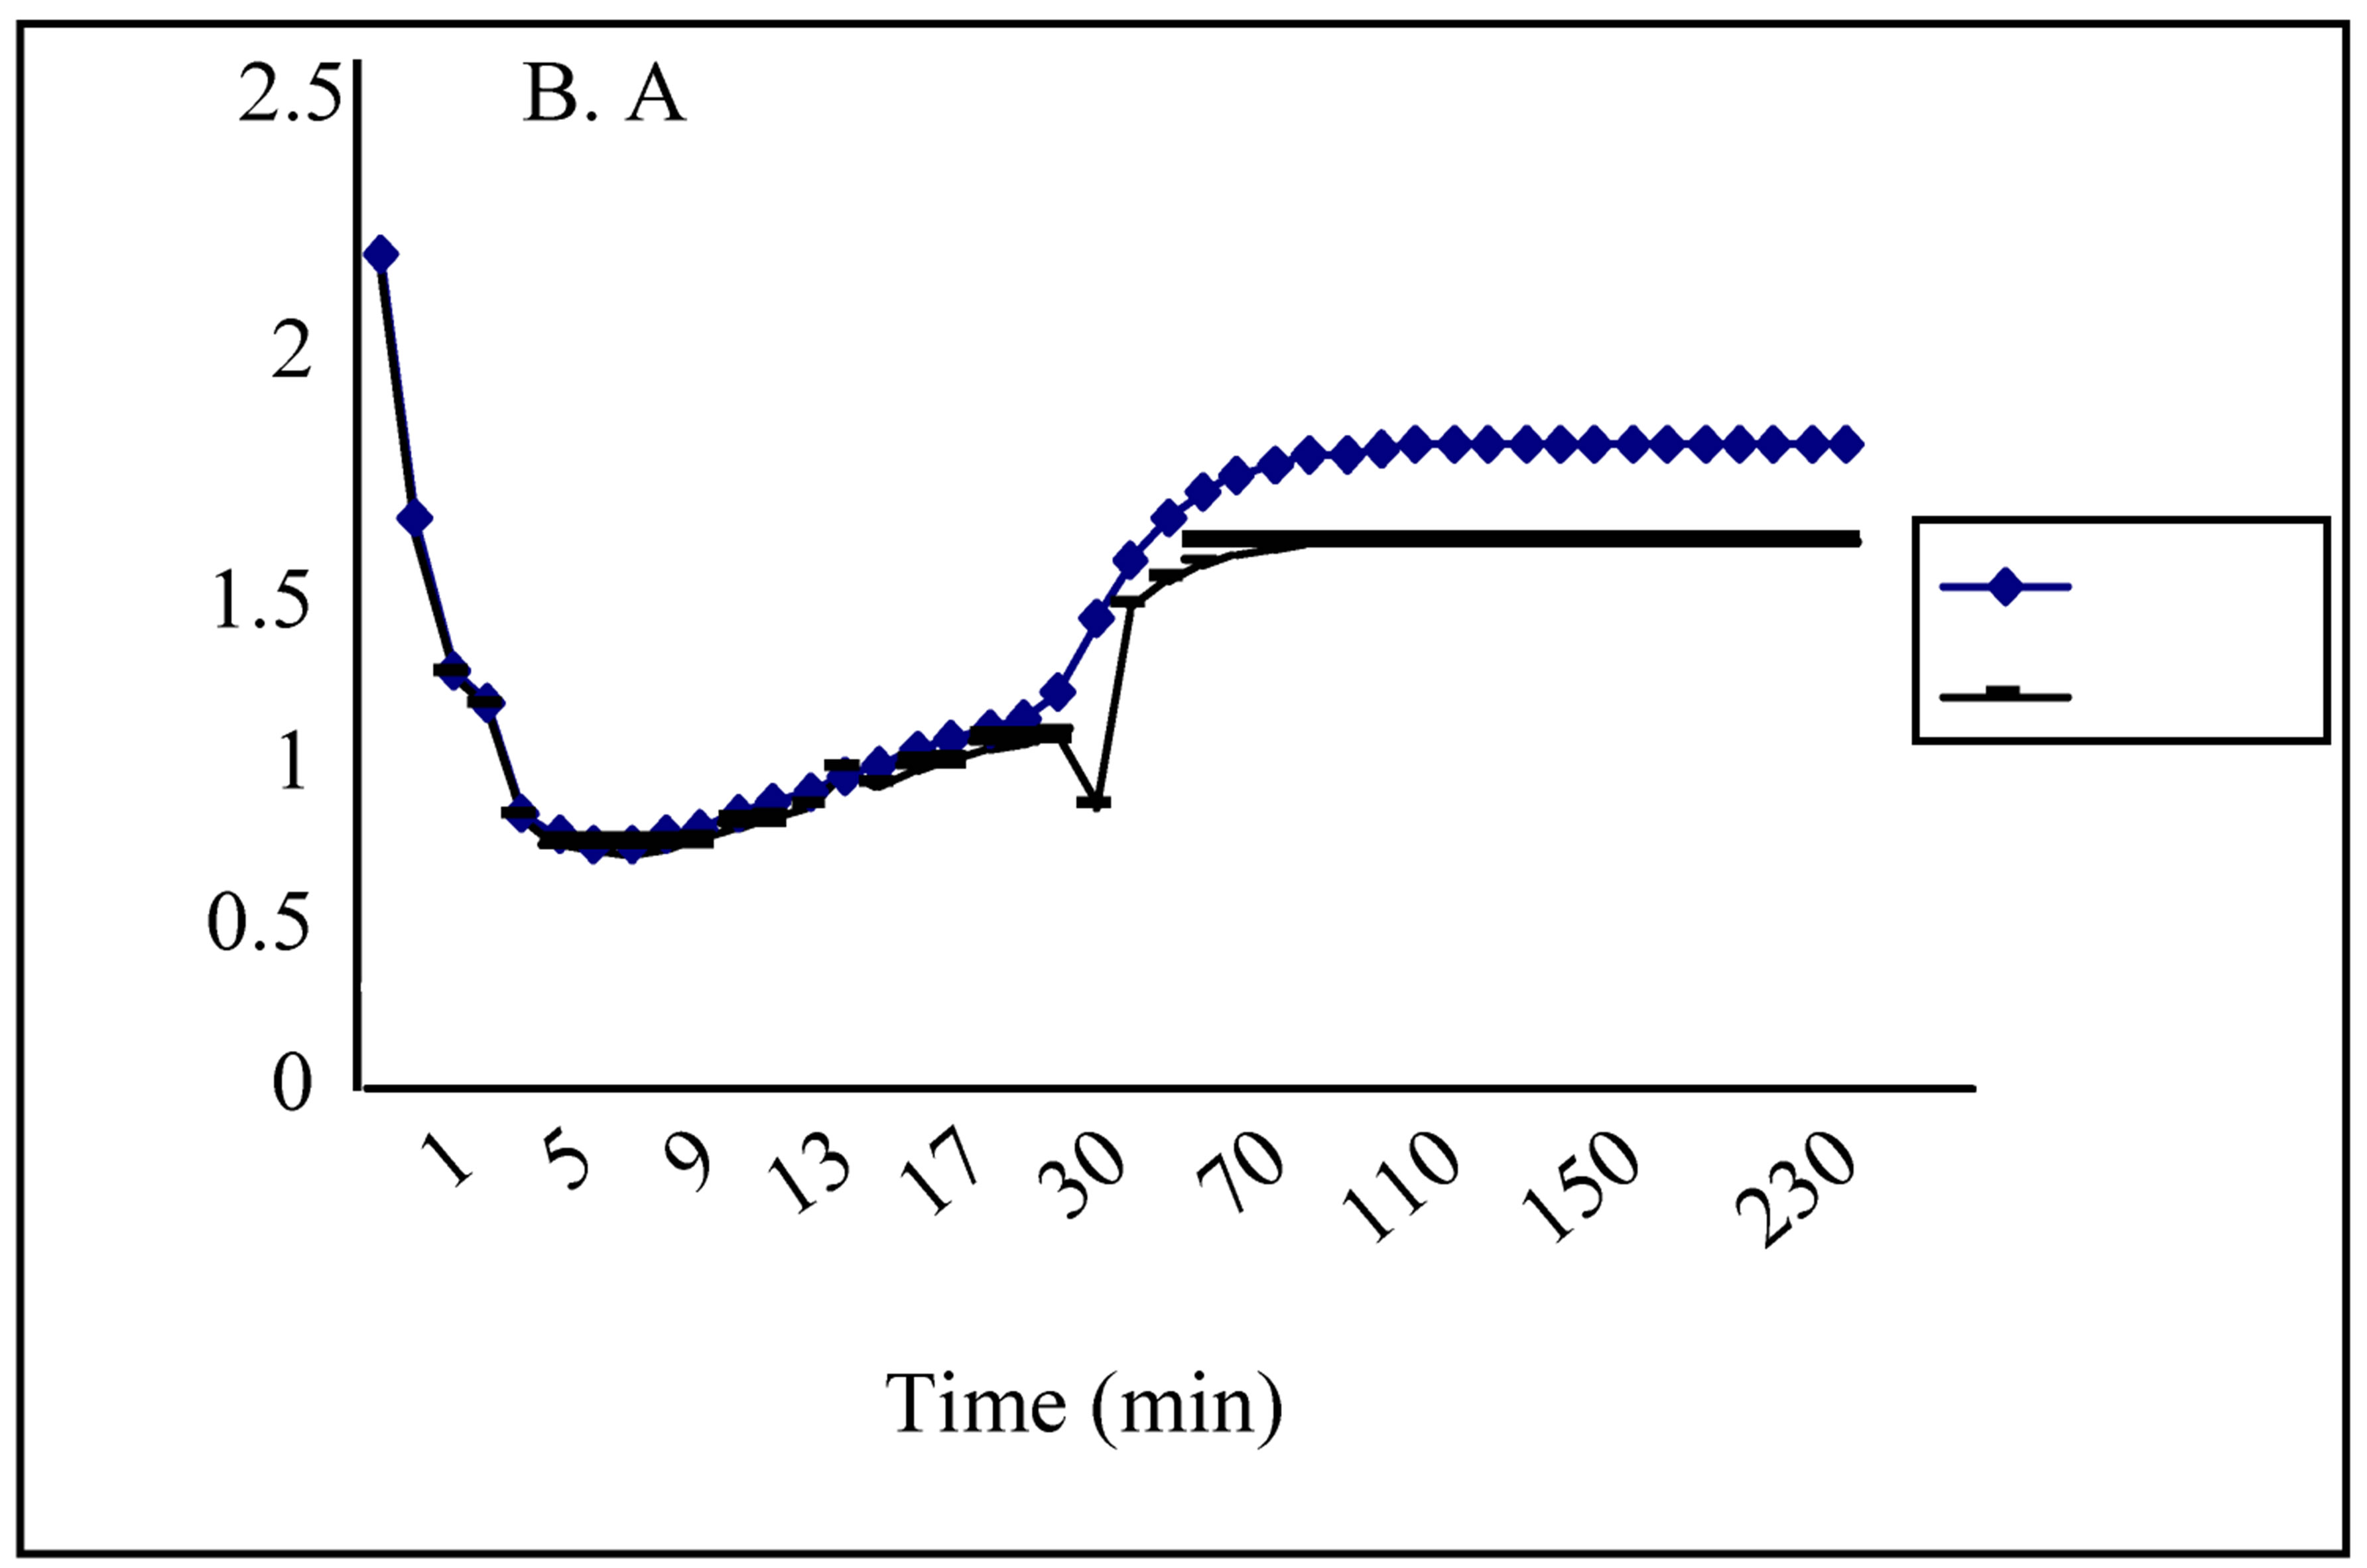
Figure 4. Variation of the baraoreceptor activity (B.A) for two values of glomerular filtration rate (Гgf) during a dialysis session (Гgf = 30 ml/min , Гgf = 75 ml/min
 ).
).
in the Figure 5.
We remark a fast decrease of the sympathetic activities in the first 7 min of session, to attain a minimum of about 1.45, followed by a progressive increase to reach a maximum of about 2.2 (respectively 1.7) for (Γgf = 75 ml/min) respectively (Γgf = 30 ml/min)) at 90 min and maintain those values until the end of session. We notice closed sympathetic activity values for both situation (Γgf = 75 ml/min) and (Γgf = 30 ml/min) in the first 30 min and after a net difference is recorded which becomes more clear later.
The mean systolic blood pressure variation for the tow values of glomerular filtration rate was mentioned in Figure 6. Comparison between calculated and measured systolic blood pressure is in Figure 7.
The measured values were taken from the bibliography and represent the mean systolic blood pressure from 32 hemodialysis patients [19]. We remark that the global walk of the three curves is the same A complete validation of the model necessitates to compare the other parameters to those measured, which is a handicap. But, because the systolic blood pressure is considered as the result from the interaction between all the control parameters in the different body compartments of the pa-
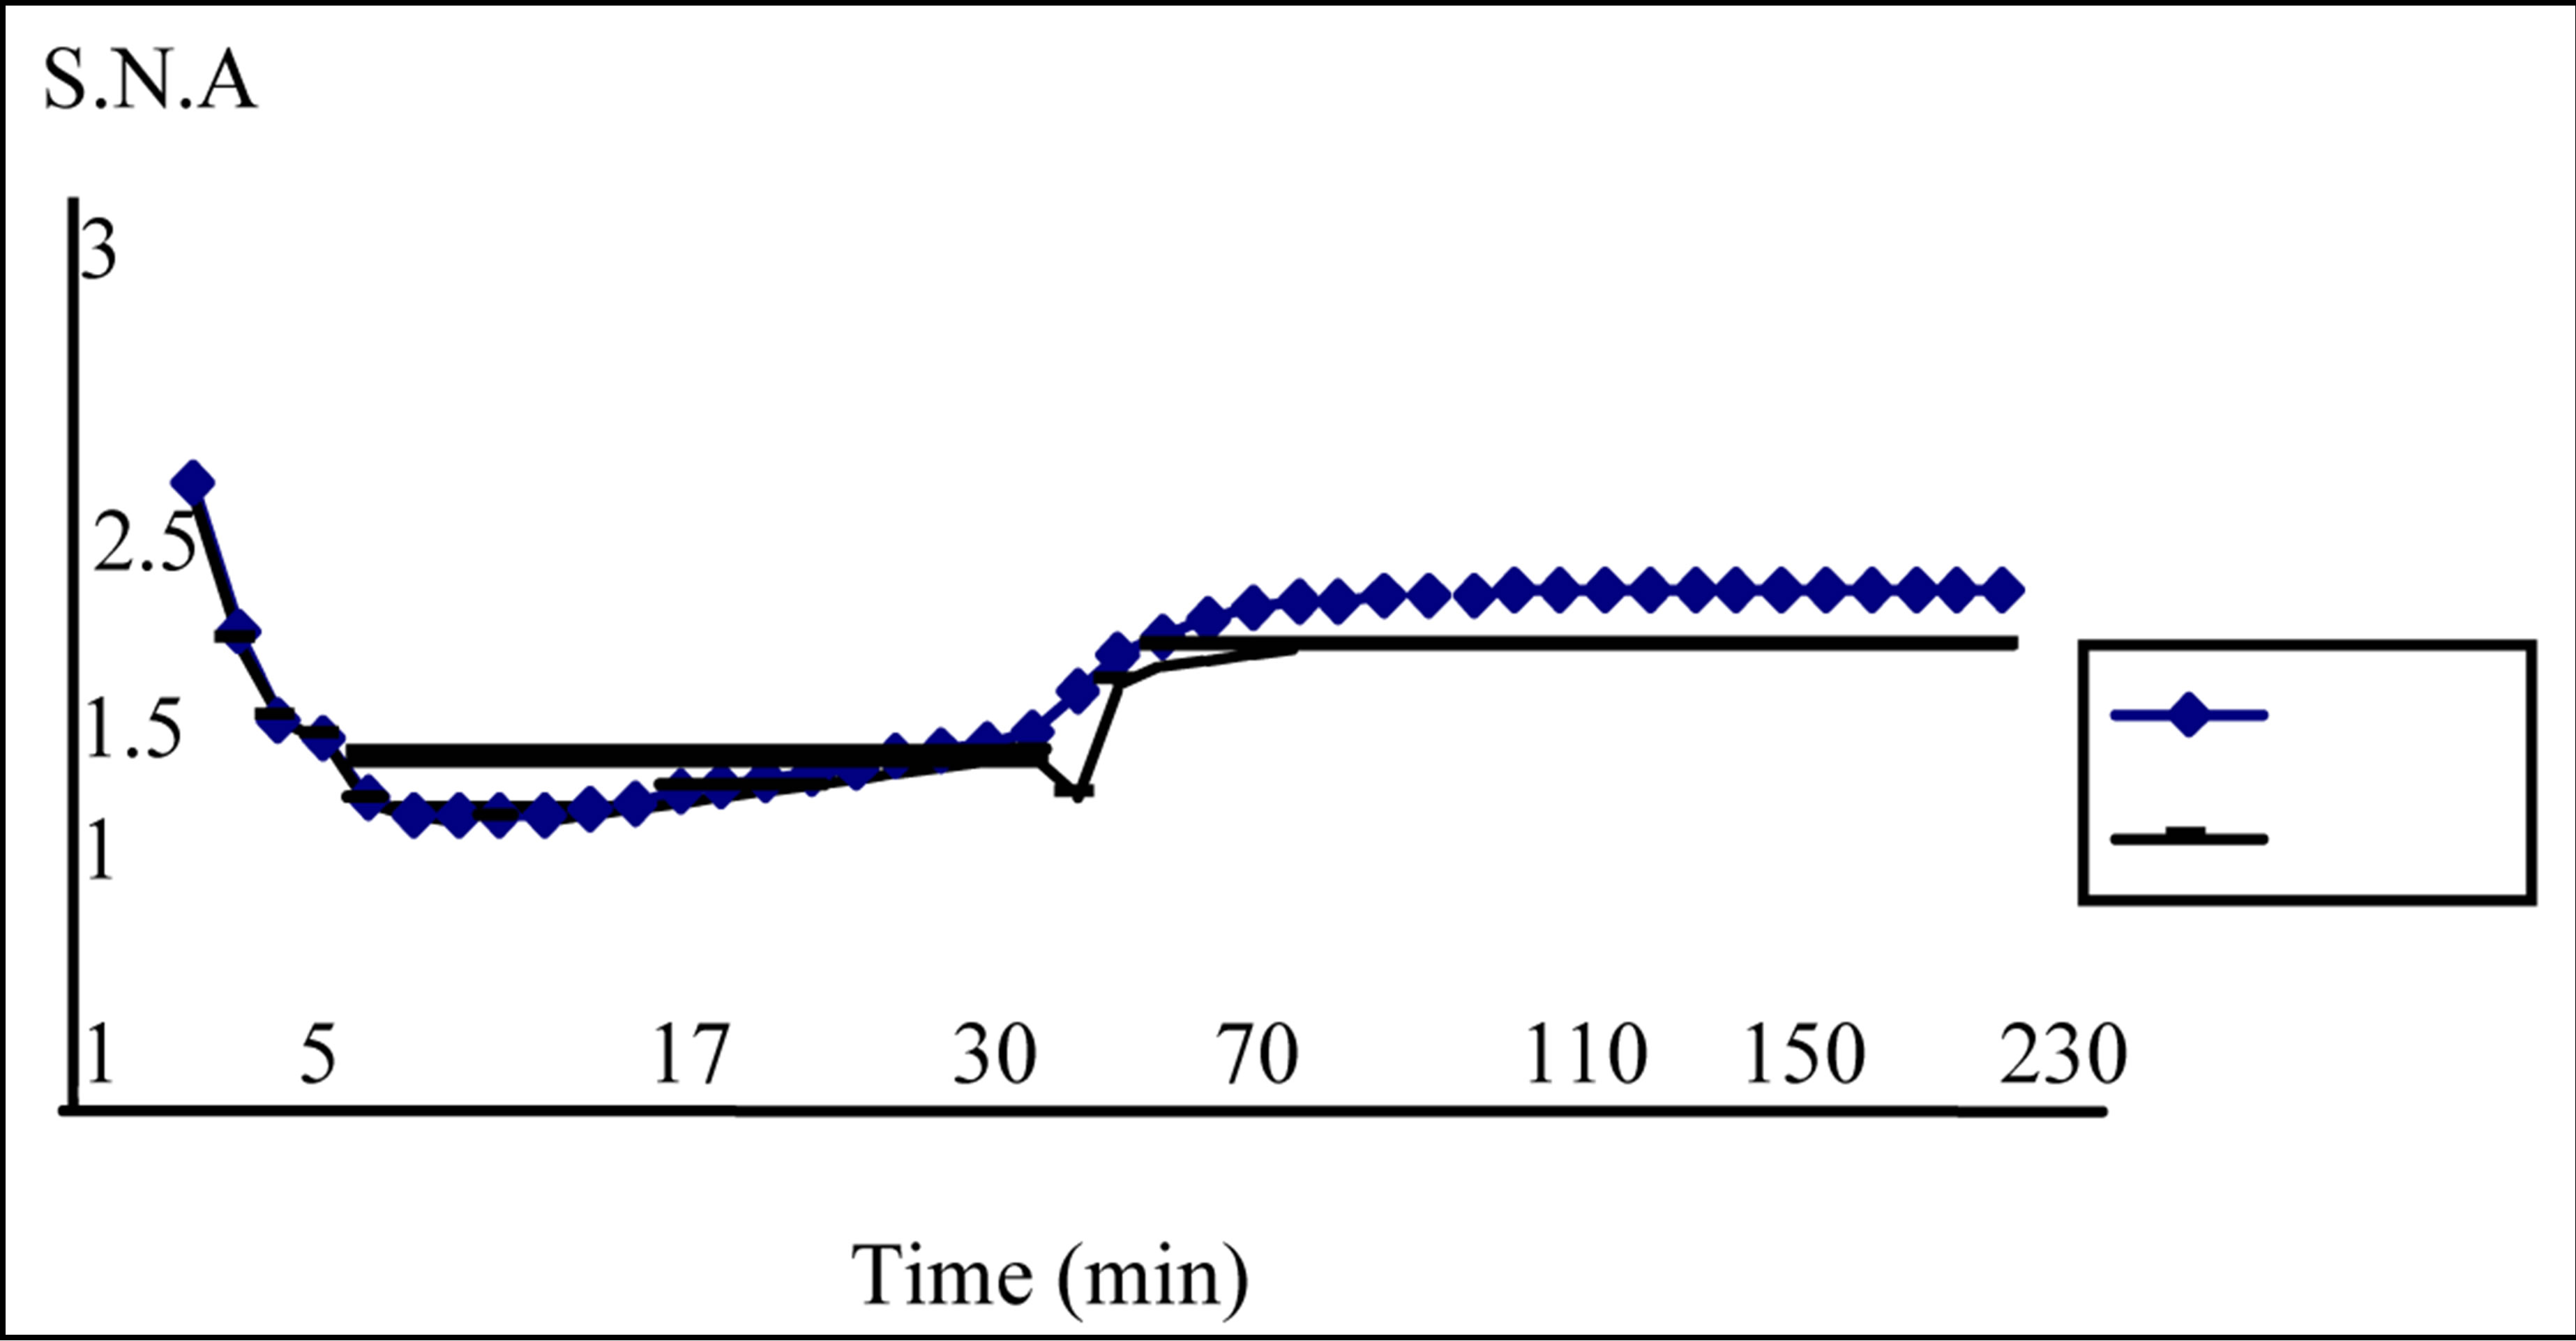
Figure 5. Variation of the sympathetic nerve activity (S.N.A.) for two values of glomerular filtration rate (Гgf) during a dialysis session (Гgf = 75 ml/min , Гgf = 30 ml/min
 ).
).
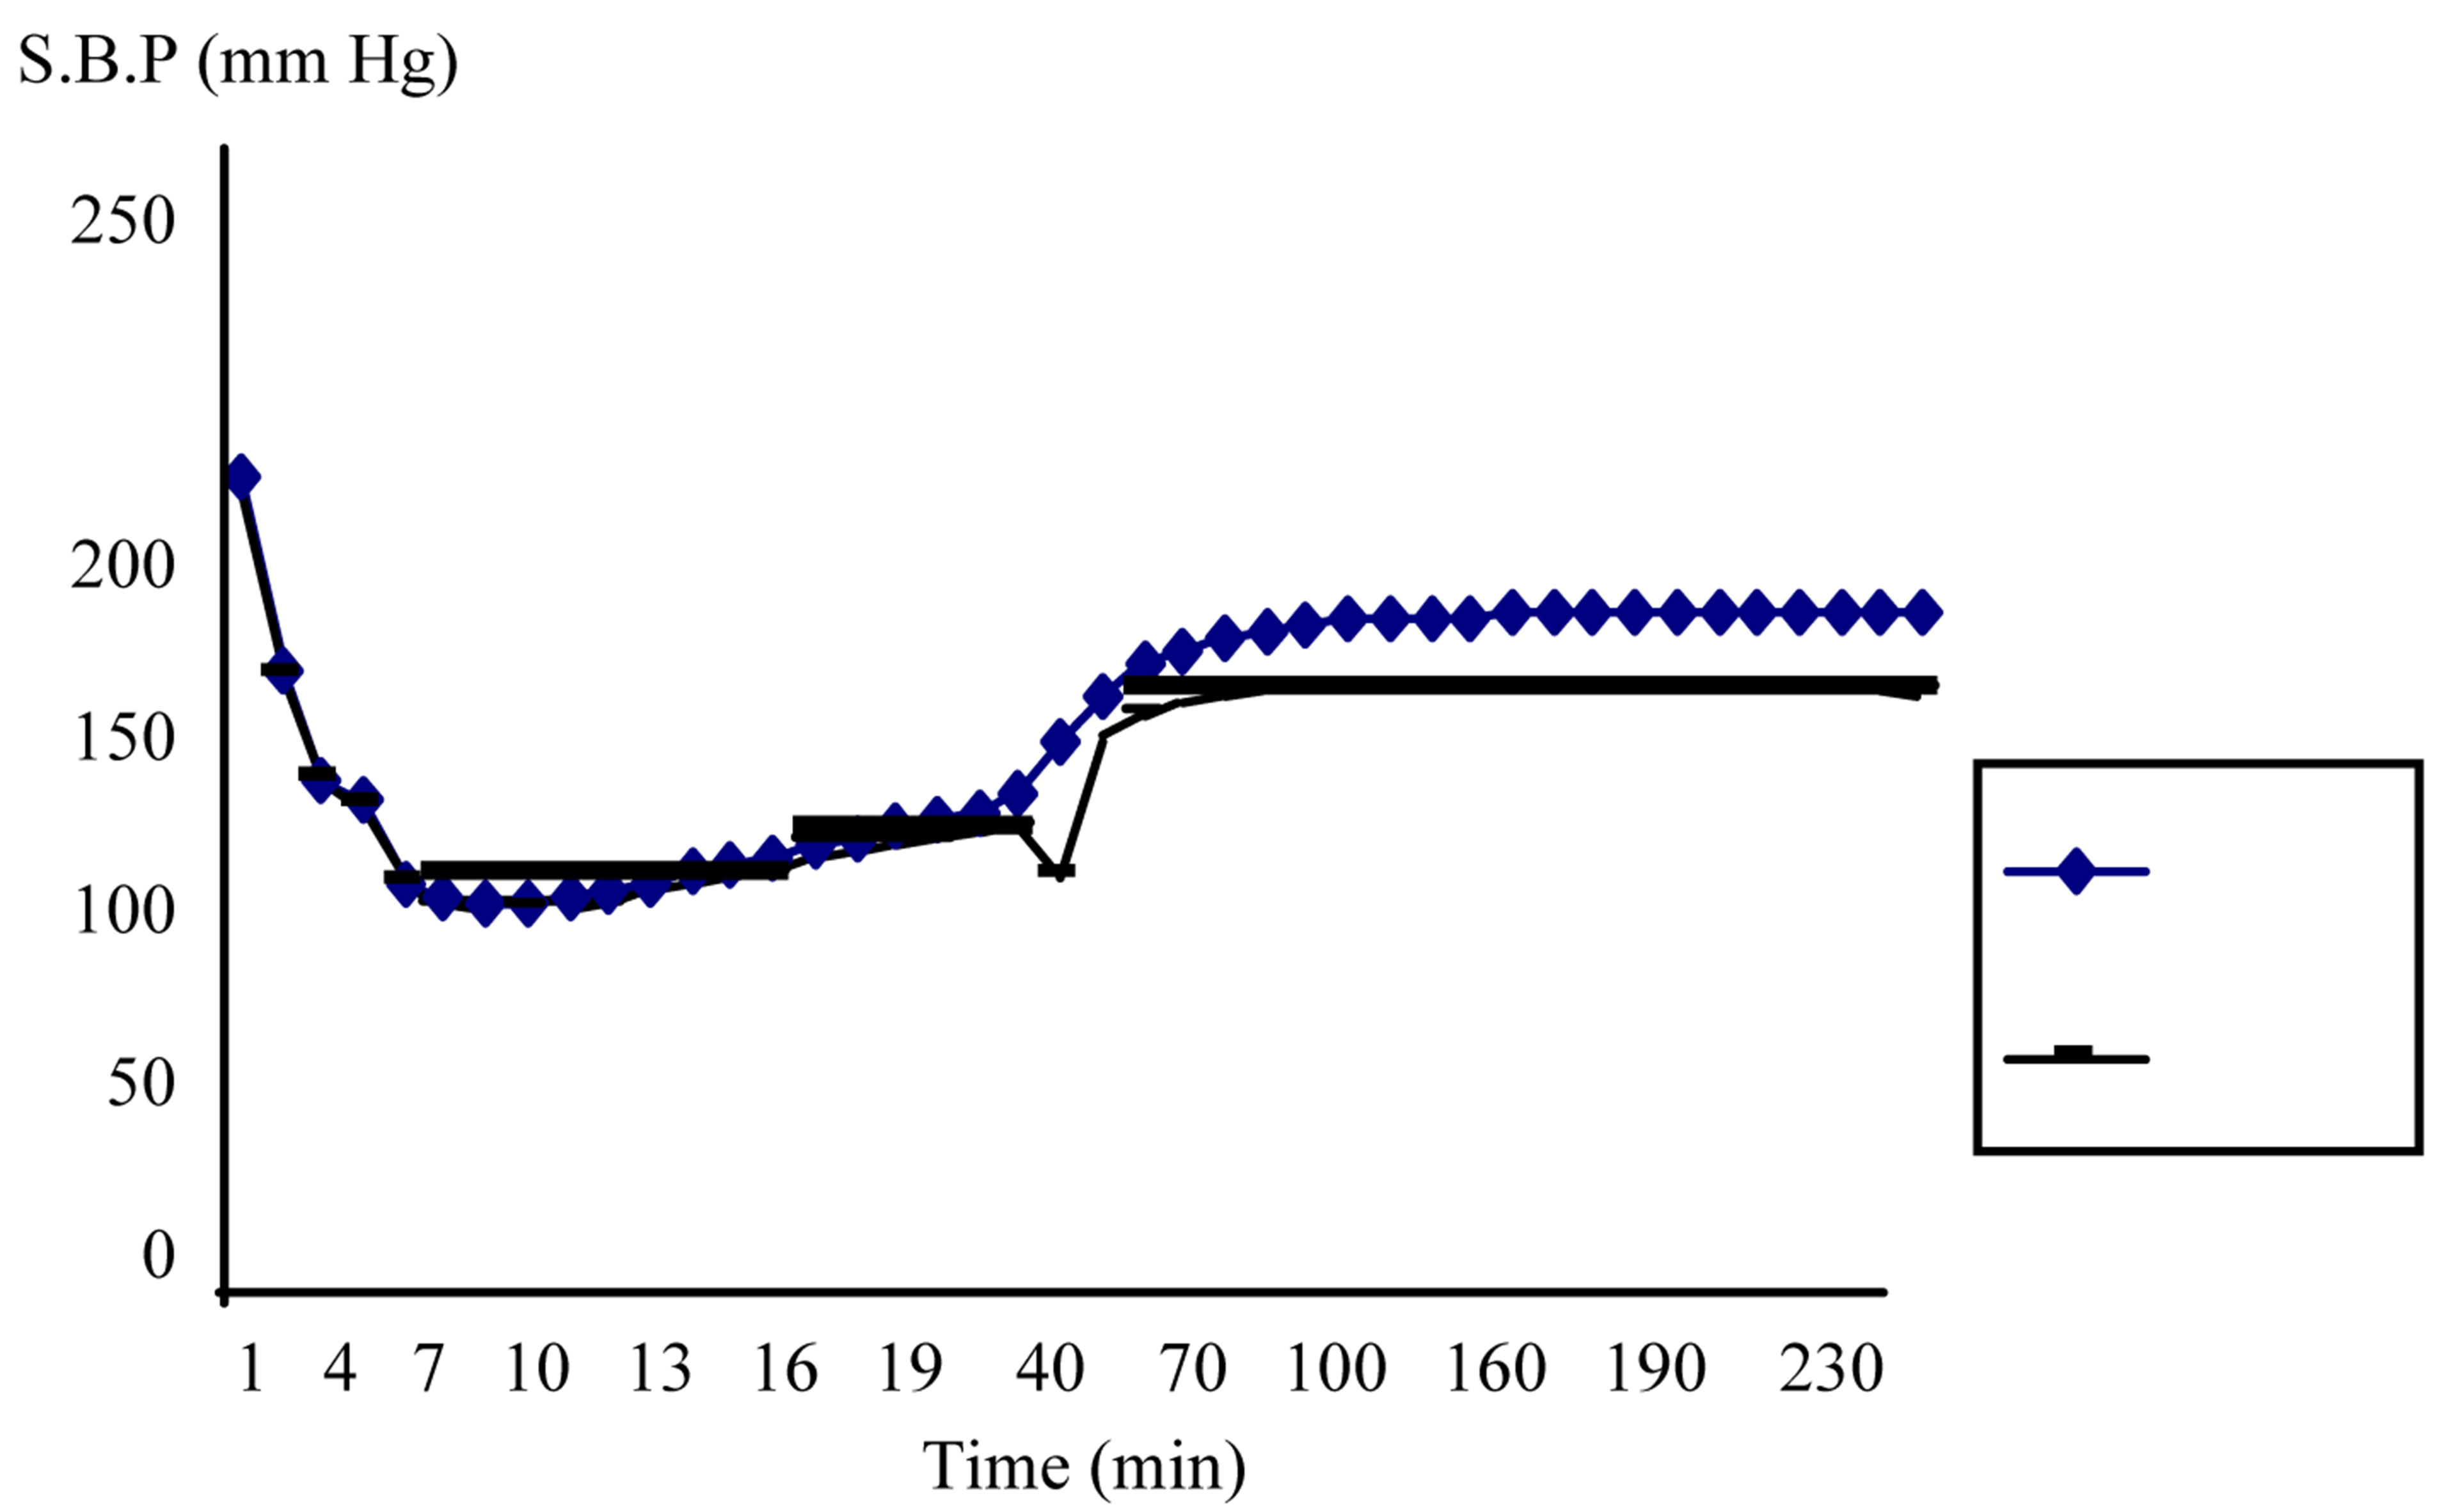
Figure 6. Variation of the systolic blood pressure (S.B.P) for two values of glomerular filtration rate (Гgf) during a dialysis session (Гgf = 75 ml/min , Гgf = 30 ml/min
 ).
).
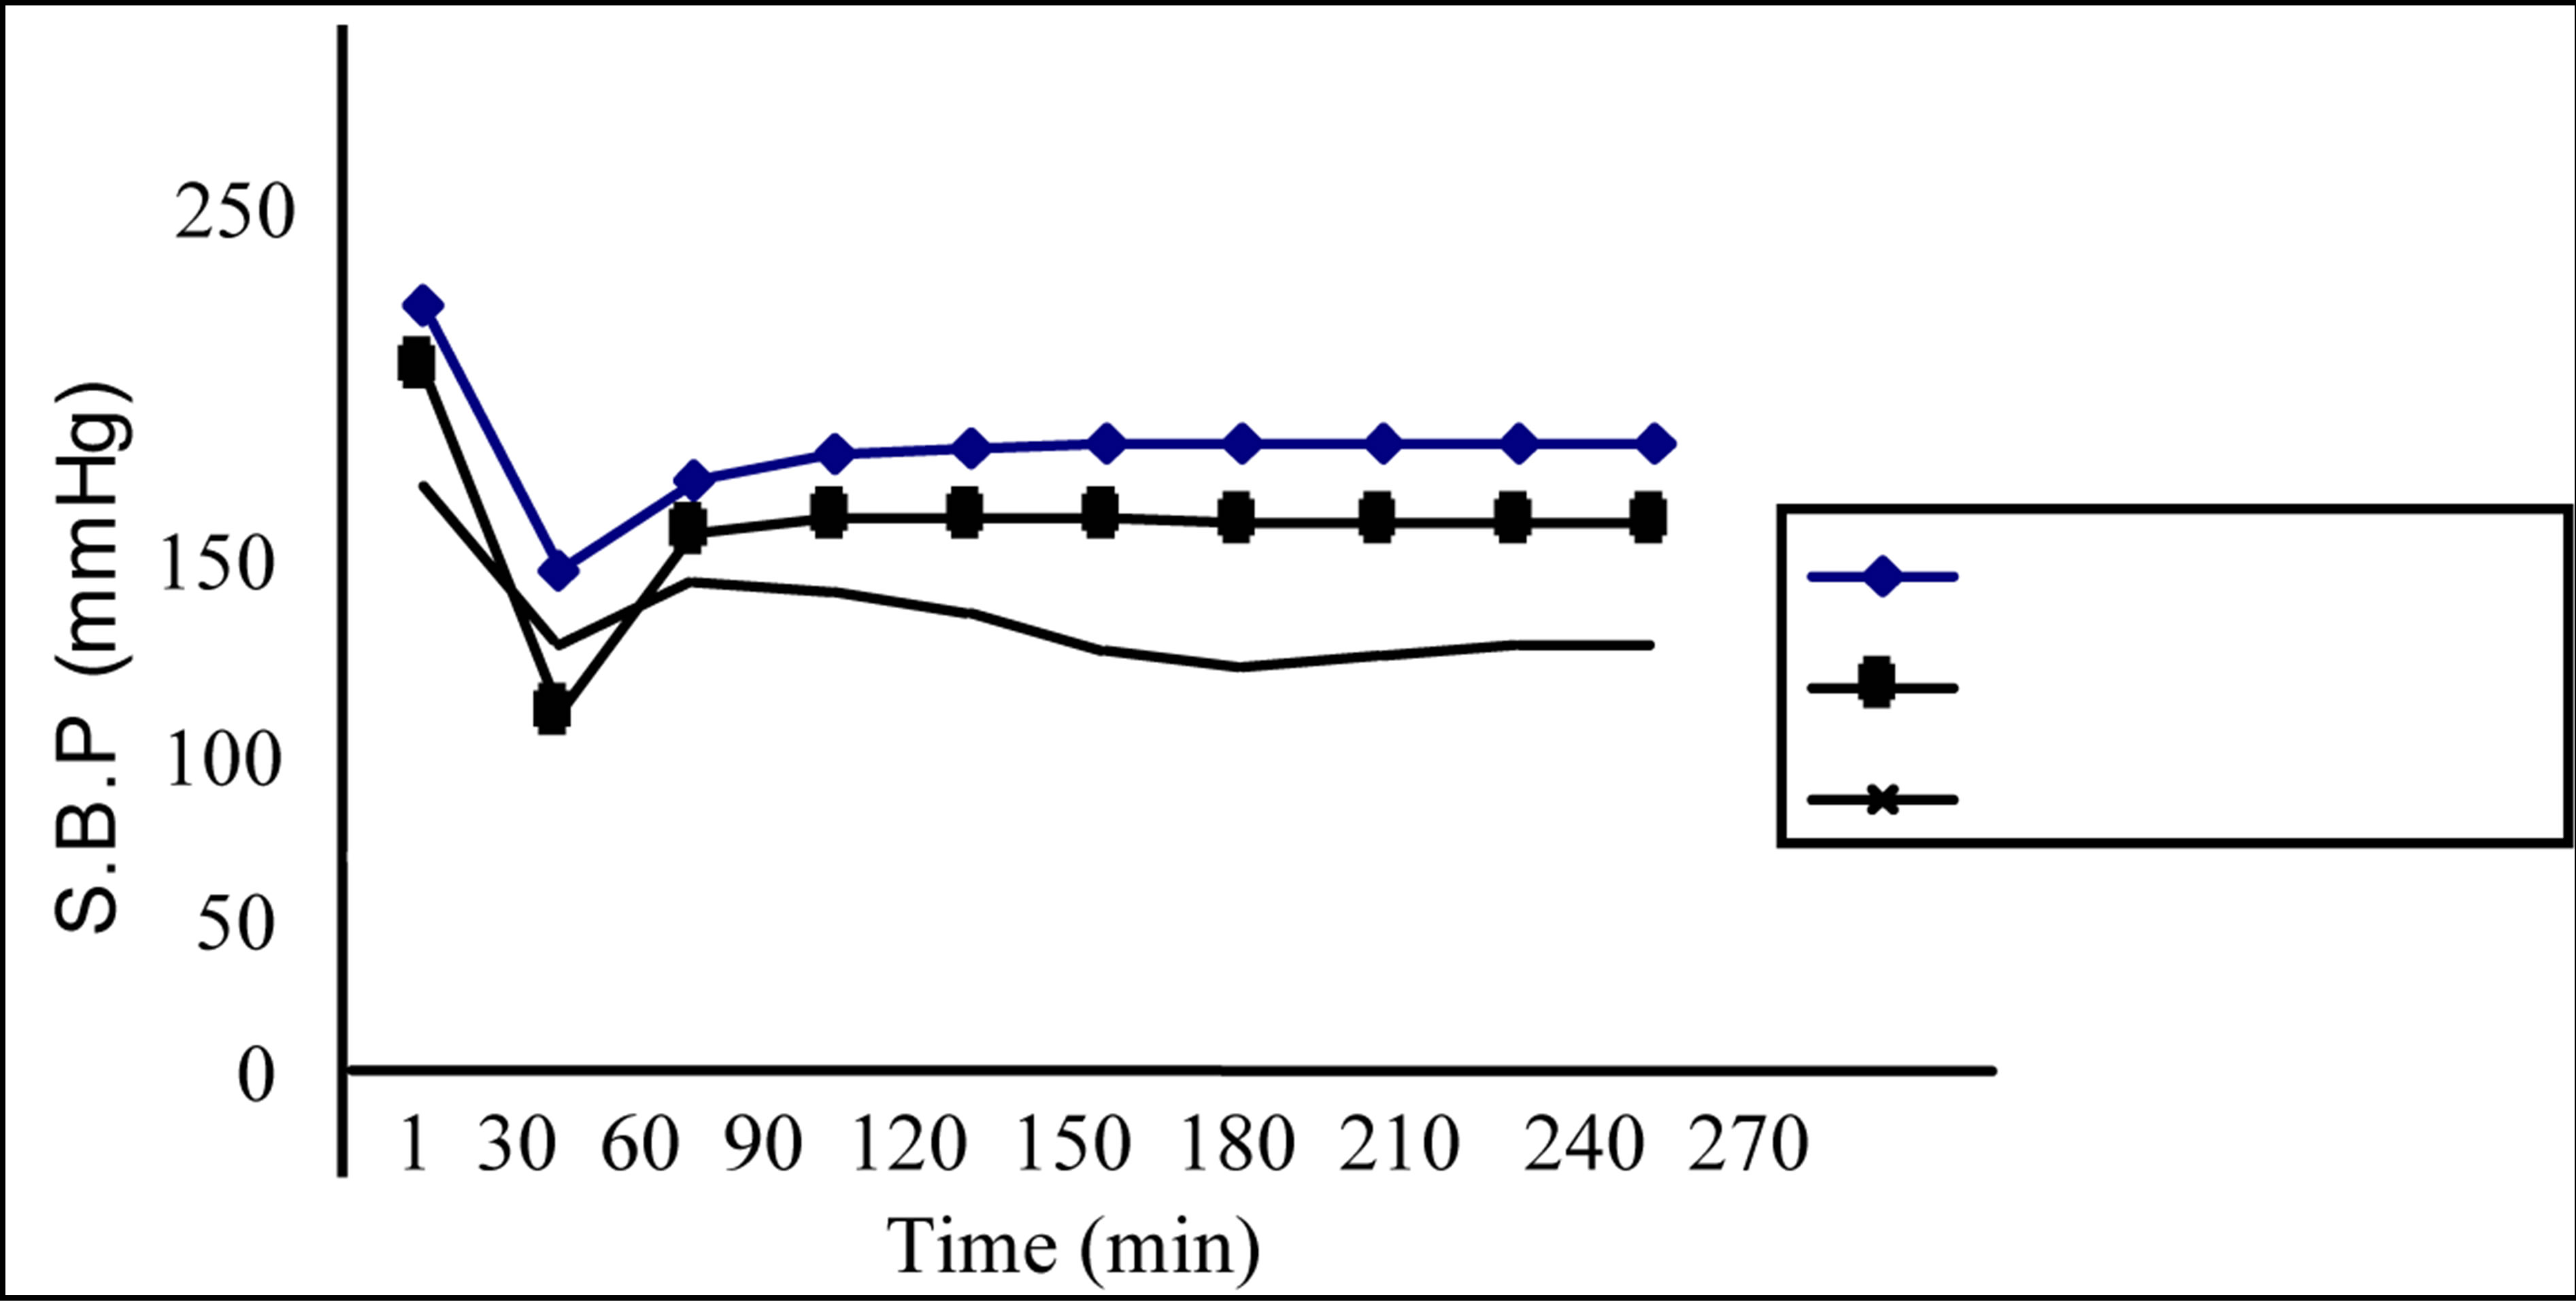
Figure 7. Comparing calculated systolic blood pressure (C.S.B.P) for two values of glomerular filtration rate (Гgf) to that measured (M.S.B.P) during a dialysis session (Гgf = 75 ml/min , Гgf = 30 ml/min
 , M.S.B.P*).
tient and the mirror of their normal functioning we can say that if validated for the systolic blood pressure the model can be judged satisfying.
A comparison between the trends of the five parameters variations calculated by the model (CO2 concentration, CO2 arterial blood pressure, baroreceptor activity, sympathetic activity and systolic blood pressure) shows a certain synchronization between them and that the same tendency is recorded. Which approve the right functioning of the model and its controlling role. In fact that synchronisation can be explained when reminding that blood pressure oscillates with a respiratory cycle, and that ventilation causes changes in intra-thoracic pressure. Those changes affect venous return, cardiac output, blood flows (brain, pulmonary and renal) and arterial pressure. This, in turn, activates both arterial and cardiopulmonary baroreceptors, inhibit vasoconstriction while increasing kidney filtration and renal blood flow. The kidney, help to regulate the blood pressure by increasing or decreasing the blood volume and also by the renninangiotension system. The baroreceptors, pressure sensitive nerve endings, are sensitive to the changes in arterial pressure due to changes in blood flow. The arterial baroreceptors are integrated with the autonomic nervous system and stimuli sent from the baroreceptors will either increase sympathetic tone or diminish sympathetic tone of the arterial system when the glomerular filtration rate is not in the normal band. In fact, the renal responses on the reduction of the total renal blood flow are characterized by sodium and water retention and, subsequently, rising cardiac filling pressures. This increase is mediated by sympathetic neurons which release norepinephrine in the vicinity of the authorythmic cells.
So the frequency band corresponding to sympathetic activity is deviated from its normal value. It is assumed that the overall aim of renal auto regulation is to maintain a constant glomerular filtration rate despite large changes in afferent blood pressure. The detection of an eventual imbalance can be done only by detection of the total carbon dioxide concentration and the carbon dioxide arterial blood pressure at any compartment. In fact, changes in oxygen, carbon dioxide and hydrogen ion concentration have very potent effects on blood flow.
When oxygen supply does not meet the metabolism demand, then there is a build-up of metabolites and an increase in its production. This build-up of metabolites will then cause a reflex vasodilation to adjust blood flow and an increase in local flow that accompanies an increase in local metabolism. Which will influence the kidney/dialyser function and the status of the hemodialysis patient. The reason is that an increase in carbon dioxide reacts with water to form hydrogen ions and bicarbonate and an increased carbon dioxide is most probably exerted on the arterial side. Out of their normal boundaries (carbon dioxide concentration and carbon dioxide arterial blood pressure), we can say that there is dysfunction at any level so we must verify the dialysis dose, the time of dialysing, and the state of the membrane. We can also detect the eventual dysfunction if the frequency corresponding to the sympathetic activity of one organ is not in the normal band. In fact, progressive systolic dysfunction of the heart results in a diminishing cardiac output, increasing systemic vacular resistance, smaller effective circulating volume, lower arterial blood pressure, andultimately, a reduction of arterial blood pressure below the renal auto-regulatory capacity [20,21].
6. Conclusions
As a way to get better assessment of the hemodialysis patient during dialysis session and to control his status, we have developed a model combining between different levels and systems of the body and describes mathematically processes related to homodynamic, sympathetic nervous system, ventilation, cerebral blood flow, and renal/dialyser clearance. In fact, we have sub-devised the human body into five compartments (brain, lung, cardiovascular system, body tissue, kidney/dialyser) and we have made integration over all of them. This integration is backed by the argument that blood pressure is controlled by several physiological mechanisms acting in combination and that the body compartments work as entity in a closed circuit and every one uses the parameters furnished by the other. So we have applied for every compartment the equations of transfer after considering the usual relationships between flow, concentration and pressure. We have obtained, then, a set of simple differential equations for which we have tried to give analytical solutions. They permit us to quantify the change that can undergo the carbon dioxide arterial blood pressure, the systolic blood pressure, the blood flow and the sympathetic nerve activity in each body compartment when there is any anomaly in the kidney/dialyser system. To test the running of the model, we have made the calculus by considering a unique system embedding the four compartments and by treating the kidney dialyser compartment as regulator of all the system. So if we change a parameter in the kidney/dialyser compartment, we must record a change for the parameters indicators of the functioning of the other compartments with a proportional sensibility.
The parameter indicator of the kidney/dialyser efficiency for which we have made a change is the glomerular filtration rate. We have recorded a clear discard between the two situations for the parameters indicators of the system functioning. The rate of change recorded is about 16.9% for the CO2 arterial blood concentration, 47.8% for the CO2 arterial blood pressure, 7.8% for the baroreceptor activity, 4.5% for the sympathetic nerve activity and 4.8% for the systolic blood pressure. To validate the model, we have compared the systolic blood pressures calculated by the model with those measured during a dialysis session taken from bibliography. The global walk of the three curves is the same. A complete validation of the model necessitates to compare the other parameters (sympathetic nerve activity, CO2 arterial blood pressure and concentration, baroreceptor activity) with those measured, which means we have to propose relationships that govern the measurable parameters, makes predictions, perturbs the object, and observes the fidelity with which the model describes the behaviour of the system.
Finally, we can say that this approach, if completely validated, could prove to be utile to workers undertaking physiologic modeling in a variety of area and it provides practical examples of use in a clinical setting. In fact the model presented can be used to prepare a clinical practice guidelines that present useful equations to the laboratory assessment and as a framework within which clinical phenomena can be better understood by searching ideal biomarkers for acute kidney injury and to evaluate their accuracy as diagnostic tests for the risk identification phase, surveillance phase, diagnosis phase and prognosis phase. Those biomarkers, formulated in the text, would help clinicians and scientists diagnose the most common form of acute kidney injury in hospitalised patients, early and accurately and may aid to risk-stratify patients with acute kidney injury by predicting the need for renal replacement therapy, the duration of acute kidney injury, the length of stay and mortality. So it can participate in differentiating between patients who would benefit from early initiation of renal replacement therapy and those from whom support should be withheld or withdrawn.
REFERENCES
- H. J. Kemp, A. Pham and C. R. Tomson, “Urea Kinetic Modelling: A Measure of Dialysis Adequacy,” Annals of Clinical Biochemistry, Vol. 38, 2001, pp. 20-27. doi:10.1258/0004563011900245
- R. W. De Boer, J. M. Karemaker and J. Strackee, “Hemodynamic Fluctuation and Baroreflex Sensitivity in Humans: A Beat-to-Beat Model,” American Journal of Physiology-Heart and Circulatory Physiology, Vol. 253, No. 3, 1987, pp. H680-H689.
- K. Kotani, K. Takamasu, Y. Ashkenazy, H. Eugene Stanley and Y. Ya mamoto, “Model for Cardio Respiratory Synchronization in Humans,” Physical Review E, Vol. 65, 2002, pp. 1-9.
- H. Seidel and H. Herzel, “Bifurcations in a Non Linear Model of the Baroreceptor Cardiac Reflex,” Physica D: Non Linear Phenomena, Vol. 115, No. 1-2, 1998, pp. 145-160.
- L. Chiari, G. Avanzolini, F. Grandi and G. Gnudi, “A Simple Model of the Chemical Regulation of Acid-Base Balance in Blood,” Proceedings of 16th International Conference IEEE-EMBS, Baltimore, 3-5 November 1994, pp. 1025-1026.
- L. Chiari, G. Avanzolini and M. Ursino, “Acid-Base Regulation in Hemodialysis Patients Modeled by a Simple Respiratory Chemostat,” 18th Annual International Conference of the IEEE Engineering in Medicine and Biology Society, Amsterdam, 1996, pp. 1810-1812.
- F. Grandi, L. Chiari, A. Cappello and G. Avanzolini, “A New Analytic Model of UREA Kinetic Oriented to Parameter Estimation,” International Conference of IEEEEMBS, Maryland, 3-5 November 1994, pp. 1164-1165.
- M. Ursino, L. Coli, C. Brighenti, L. Chiari, A. De Pascalis and G. Avanzolini, “Predictioof Solute Kinetcis, Acid-Base Status and Blood Volume Changes during Profiled Hemodialysis,” Annals of Biomedical Engineering, Vol.28, No. 2, 2000, pp. 204-216. doi:10.1114/1.245
- M. C. Khoo, R. E. Kronauer, K. P. Strohl and A. S. Slutsky, “Factors Inducing Periodic Breathing in Humans. A General Model,” Journal of Applied Physiology: Respiratory, Environmental & Exercise Physiology, Vol. 53, No. 3, 1982, pp. 644-659.
- M. C. Khoo, “Modelling and Parameter Estimation in Respiratory Control,” Academic Press, New York, 1977.
- S. Timischl, “A Global Model for the Cardiovascular and Respiratory System,” Ph.D. Thesis, Unversität Graz, Graz, 1998, p. 109.
- A. S. Levey, J. P. Bosch, J. B. Lewis, T. Greene, N. Rogers and D. Roth, “A More Accurate Method to Estimate Glomerular Filtration Rate from Serum Creatinine: A New Prediction Equation,” Annals of Internal Medicine, Vol. 130, No. 6, 1999, pp. 461-470. doi:10.7326/0003-4819-130-6-199903160-00002
- J. T. Daugirdas, “Chronic Hemodialysis Prescription: A Urea Kinetic Approach,” In: Handbook of Dialysis, Little, Brown and CO., Boston, 1994, pp. 92-120.
- F. A. Gotch, “Kt/V Is the Best Dialysis Dose Parameter,” Blood Purification, Vol. 18, No. 4, 2000, pp. 276-285. doi:10.1159/000014449
- L. A. Stevens and A. S. Levey, “Clinical Implications of Estimating Equations for Glomerular Filtration Rate,” Annals of Internal Medicine, Vol. 141, No. 12, 2004, pp. 959-961. doi:10.7326/0003-4819-141-12-200412210-00013
- P. A. Stewart, “How to Understand Acid-Base: A Quantitative Acid-Base Primer for Biology and Medicine,” Elsevier North Holland Publication, city, 1981.
- V. Bordin, C. Catalano, A. Berto, G. Silvestrin, D. Di Landro and F. Fabbian, “Determining the Prescription for Online Predilution Hemofiltration: Our Experience and a Review of the Literature,” Dialysis and Transplantation, Vol. 31, No. 6, 2002.
- B. A. Molitoris, V. Y. Melnikov, M. D. Okusa and J. Himmelfarb, “Technology Insight: Biomarker Development in Acute Kidney Injury: What Can We Anticipate?” Nature Clinical Practice Nephrology, Vol. 4, No. 3, 2008, pp. 1- 8.
- C. Silvio, C. Andrea, S. Stefano, B. Fabio, B. Stefano, G. Andrea, C. Leonardo and S. Antonio, “Model-Based Study of the Effects of the Hemodialysis Technique on the Compensatory Response to Hypovolemia,” Kidney International, Vol. 65, 2004, pp. 1499-1520. doi:10.1111/j.1523-1755.2004.00523.x
- S. C. Malpas, “Sympathetic Nervous System Overactivity and Its Role in the Development of Cardiovascular Disease,” Physiological Reviews, Vol. 90, No. 2, 2010, pp. 513-557. doi:10.1152/physrev.00007.2009
- R. Zhang, J. A. H. R. Claassen, S. Shibata, S. Kilic, K. Martin-Cook, R. Diaz-Arrastia and B. D. Levine, “Arterial-cardiac. Baroreflex Function: Insights from Repeated Squat-Stand Maneuvers,” American Journal of Physiology-Regulatory, Integrative and Comparative Physiology, Vol. 297, 2009, pp. R116-R123. doi:10.1152/ajpregu.90977.2008