Open Journal of Applied Sciences
Vol.3 No.1(2013), Article ID:29441,6 pages DOI:10.4236/ojapps.2013.31008
Nondestructive Testing Electrical Methods for Sensing Damages in Cement Mortar Beams
1Department of Electronics, Technological Educational Institute of Athens, Athens, Greece
2School of Engineering and Design, Brunel University, Brunel, UK
Email: csterg@teiath.gr
Received October 23, 2012; revised November 24, 2012; accepted December 2, 2012
Keywords: Non-Destructive Testing; Electrical Resistance; Acoustic and Electrical Current Emissions; Cement
ABSTRACT
This paper discusses the experimental results of concurrently measured Electrical and Acoustic Emissions in order to evaluate the mechanical health status of cement mortar beams subjected to three-point bending mechanical tests. In particular, the Electrical Resistance and the Electrical Current emissions are recorded concurrent with Acoustic Emissions and the experimental results are discussed under the concept of crack initiation and propagation processes. For the first time, the electrodes that are used for conducting the measurements are placed in the bulk of the specimen, near the tensile zone, during its preparation. The damage evolution is examined by monitoring the fractional change of the Electrical Resistance and the variation of the Electrical Current in combination with the Acoustic Emission recordings.
1. Introduction
Non-destructive testing for detecting the mechanical status of construction materials has attracted the attention of scientists and engineers. This is because such tests provide significant flexibility on evaluating the mechanical status in both laboratory and field conditions. Ordinary Portland Cement (OPC) is the most common type of cement in general use around the world. There is a growing interest at an international level for real-time health monitoring of cement based constructions without causing damage to the structure by extracting specimens in order to conduct mechanical status tests. Such techniques are widely known as non-destructive testing techniques. Such kind of monitoring provides information for the time and condition at which damage occurs, thereby facilitating the evaluation of the damage cause. In addition, real-time monitoring may contribute to the study of the damage evolution, while a set of currently used models [1,2] may indicate and anticipate the possibility of a damage process to be evolved to a failure process. Until recently, methods such as Acoustic Emissions (AE) [3] have been used for experimental observation of the damage evolution. Regarding the cement-based materials the AE technique has been used to monitor the microfracture processes taking place in the bulk of a specimen [4]. Laboratory measurements conducted when cement-based specimens are subjected to externally applied mechanical loading [5,6] have provided significant information regarding the characteristics of the AE recordings during all ranges of the mechanical behavior of the specimen. An interesting method for monitoring damages in cement-based materials involves the study of the Electrical Resistance behavior when a specimen is subjected to mechanical loading. The Electrical Resistance measurements are characterized by the variability of the resistance to changes while, at the same time, it reveals microscopic and reversible effects [7]. Thus, it is significant to test and validate such a monitoring tool on cement-based beams that during their lifecycle suffer from aging, fatigue, natural disasters and excessive loading.
Previous papers that refer to laboratory experiments of compressive loading applied on cement paste specimens [8] for measuring the Electrical Resistance manifest that this method is effective for monitoring damage infliction and subsequent microcrack opening as well as monitoring the healing process due to the microcrack closing. Generally, the damage of the material causes the Electrical Resistance to increase and healing causes the Electrical Resistance to decrease [8].
Another, recently introduced, non-destructive testing, experimental technique based on the recording of weak electrical current emissions. These emissions are generated when a cement-based material is subjected to mechanical loading. This technique is known as Pressure Stimulated Current (PSC) technique [9-11]. It is of great interest to detect and study the electrical current emissions during Three Point Bending tests. Such electrical signals have been introduced and studied for cementbased beams [9] and marble specimens [12].
This paper introduces the use of Electrical Resistance and Electrical Current measurements during Three Point Bending (3PB) tests for monitoring the damages in cement-based materials. The measurements and the discussion of the experimental results are further supported by AE recordings that were concurrently conducted. For detecting the Electrical Resistance and the Electrical Current emissions a novel electrode topology was selected. Two copper made, gold-plated electrodes were integrated in the tensile zone of the specimens during their preparation. Finally, the variation of the recorded Electrical Resistance value and the detected electrical signal are correlated with AE recordings in an attempt to reveal information related to the damage initiation and propagation caused by the increasing mechanical loading.
2. Materials and Electrical Sensors
The specimens (beams) were prepared using OPC. The OPC was mixed with sand consisted of fine aggregates and water. The mixing ratio in terms of weight was 1:3:0.5 respectively. By examining the produced beams, porosity was estimated at approximately 8%. Mixing was performed at a low speed to enable better moisturizing of the cement grains. The specimen preparation process is discussed in detail in previous works [9].
Consequently, the mixture was poured into wooden molds with oiled internal surfaces of rectangular prismatic form. The dimensions of the produced specimens were 200 mm long with a square cross-section of 50 mm edge. The specimens remained in the molds for 24 h and then they were stored at constant ambient temperature of 22˚C and 75% - 80% humidity. The specimens were used three months after their preparation in order to reach 95% of their total strength [13]. Preliminary 3PB strength tests have shown that the fracture limit of the produced specimens was .
.
The integration of the copper made, gold-plated electrodes took place during the pouring of the mixture in the molds. They placed in parallel with the loading axis (see Figure 1). Their shape was orthogonal with dimensions 4 mm × 3 mm, thickness 0.1 mm and their intermediate distance was chosen to vary between 35 mm and 45 mm. The electrode distance and the selection of a soft material like copper is mandatory in order to avoid the fact that the electrodes constitute points of failure which may affect the fracture plane during the 3PB-tests or degrade the mechanical strength of the specimens. After conducting preliminary experiments it was observed that
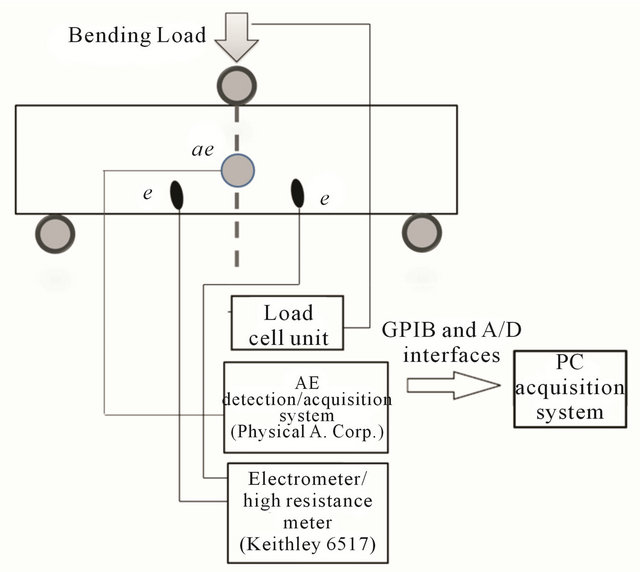
Figure 1. Typical experimental setup, e: gold plated copper electrodes for measuring the Electrical Resistance or the PSC, ae: AE sensor.
when the distance between the electrodes was shorter than 32 mm, the fracture plane was guided by the electrodes.
3. Experimental Setup
In Figure 1, the experimental setup for measuring the Electrical Resistance, the PSC and the AE is shown. The cement mortar beam was supported by two rigid cylindrical rods. The distance of each rod from the centre of the beam is 85 mm. Teflon plates are installed between the rods that support the specimen and the loading system in order to avoid any impact on the mechanical behavior of the specimen. The Electrical Resistance and the PSC were measured using a sensitive high resistance/low current electrometer. All data were transferred and stored in a hard disk of a computer via a GPIB channel. The applied bending load was measured through a load cell and recorded by the use of the a Keithley model 6517 analogue-to-digital data acquisition device. The setup was placed in a Faraday shield for avoiding interference due to external noise sources for both the electrical and the AE recordings. The system that was used to detect and record the AE signals is the 2-channel PCI-2 AE acquisition system (Physical Acoustics Corp). The AE sensor was attached on the expected fracture plane of the specimen as shown in Figure 1. As the cracking process is developed at this particular region, a sensor placed at the centre of this region will be able to better capture the generated acoustic events (AE). A layer of silicon grease was applied between the AE sensor and the surface of the specimen in order to improve the coupling.
4. Experimental Results
A series of preliminary experiments were conducted in order to evaluate the sensitivity of the Electrical Resistance. During all the experiments the distance of the electrodes was 40 mm. A threshold of 40 dB was set at the AE detection system in order to avoid recording lower AE amplitudes. Additionally, a low frequency cutoff filter was installed at the AE system in order to reject AE events of lower than 20 kHz average frequency.
A mechanical process of 3PB loading/unloading was applied on the specimens (see Figure 2(a)). The variation of the Electrical Resistance and AE signals were concurrently recorded. The experimental results are discussed taking into consideration the three ranges of the mechanical loading. A pre-load of 0.3 kN was applied on the specimen at the beginning of the experiment. Range A is the load increase process at a constant rate of 38 N/s approximately until reaching the level of 1.4 kN. During range B the loading remained constant at the level of 1.4 kN for 140 s. Sequentially, at range C a process of gradual unloading was conducted.
The Figures 2(b) and 2(c) show the temporal variation of the Electrical Resistance and the corresponding fractional change in resistance at range A, B, and C respectively.
When the specimen was unloaded the value of the Electrical Resistance was about Ro = 791 MΩ. When the specimen was subjected to the pre-load level of 0.3 kN, the value of the Electrical Resistance practically remained at the previous value. During range A (i.e. loading at a constant load rate) a linear increase of the Electrical Resistance value was recorded (see Figure 2(b)). When reaching the maximum loading value of 1.4 kN, the value of the Electrical Resistance was 796 MΩ. This value corresponds to a fractional change  of 0.7% (see Figure 2(c)). During range A, AE events are also recorded (see Figure 2(d)). It is significant to notice that some of these events are of high amplitudes indicating the existence of microfracture processes that take place in the region that the AE sensor was placed. As also discussed in literature the Electrical Resistance increase during such loading procedures is mainly attributed to the damage development processes [7,8].
Consequently, during range B (i.e. constant mechanical load of 1.4 kN), the Electrical Resistance was continuously increasing for a considerable amount of time showing a restoration tendency at a fractional change value of 0.9%. This behavior may be attributed to the further increase of the damage initiation and propagation processes (even in small scale) that are mainly caused by the opening of microcracks generated during loading. This is further supported by monitoring the AE events
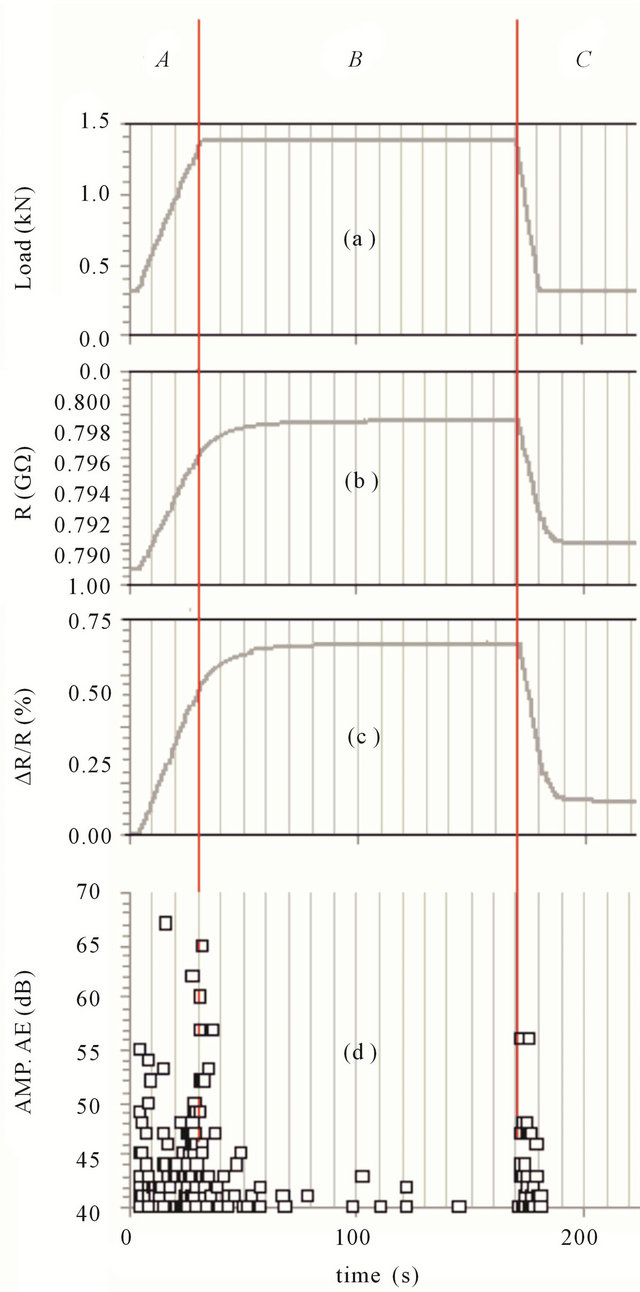
Figure 2. Temporal behavior of the (a) mechanical load, (b), Electrical Resistance, (c) fractional change of the resistance and (d) the corresponding amplitude values of the AE events.
during this range (see Figure 2(d)). When the AE events were significantly reduced, the value of the Electrical Resistance was settled to a practically constant value of 798 MΩ approximately.
During range C (i.e. unloading process) a significant reduction of the Electrical Resistance was observed as significant reduction of the Electrical Resistance was observed as a consequence of a process related to damage healing, indicating the reversible (not permanent) nature of damaging. It must be noted that the value of the Electrical Resistance after the unloading procedure was settled and remained practically constant at a higher, but close, value than the initial value of Ro.
A second series of experiments were conducted aiming at the study of Electrical Resistance variations during a process of continuous loading of a cement mortar beam at a constant loading rate up to fracture. In these experiments, the distance between the electrodes was 45 mm, while the AE configuration was maintained as described above. During the time that the specimen was not subjected to any mechanical load, the value of the Electrical Resistance was Ro = 892 MΩ approximately. This initial value of the measured resistance Ro was expected to vary for each different experiment since it depends on the distance between the electrodes and the random distribution of the sand grains or the pores located in the specimen.
Figure 3(a) shows the temporal variation of the mechanical load following a rate of 26 N/s approximately.
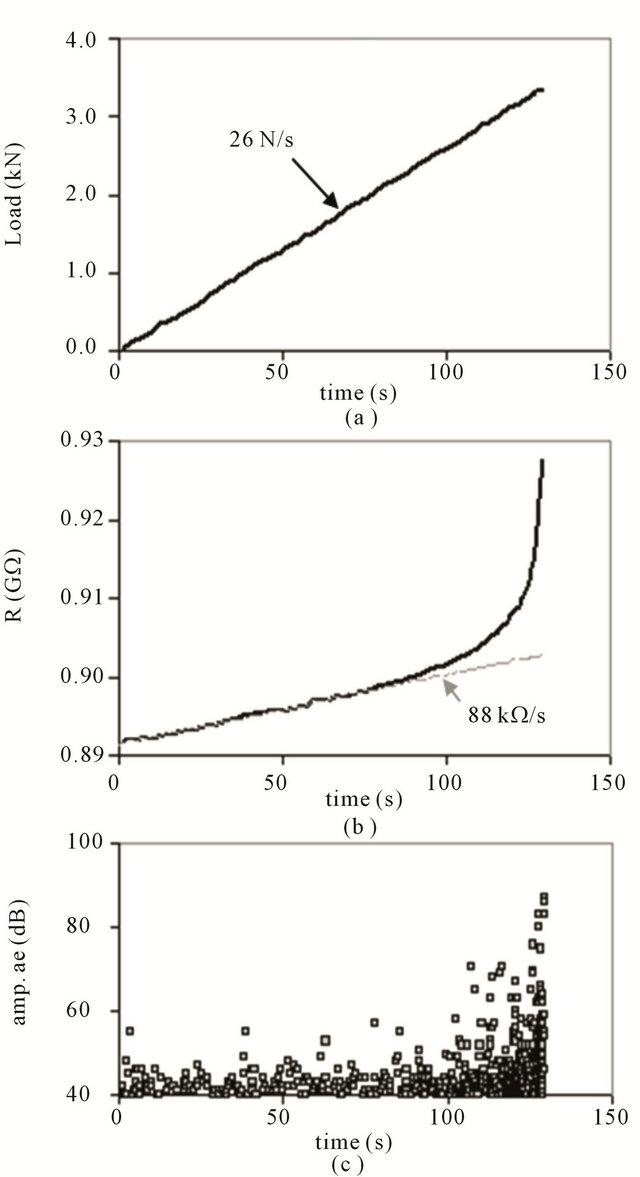
Figure 3. The temporal variation of the (a) mechanical load, (b) Electrical Resistance and (c) the corresponding amplitudes of the AE events.
At the fracture of the specimen the mechanical load value recorded was 3.36 kN. The corresponding variation of the Electrical Resistance is shown in Figure 3(b). The amplitudes (dB) of the AE events recorded are shown in Figure 3(c). These events were generated because of the externally applied mechanical load. From the beginning of the process  up to the time value of
  that the mechanical strength of the beam reached the 66% of its ultimate mechanical strength, a linear increase of the Electrical Resistance was observed at a rate of 88 kΩ/s (see Figure 3b). The rate of the corresponding AE events was relatively low and their amplitudes did not exceed the level of 55 dB (see Figure 3(c)). On the contrary, when the mechanical load became greater than 66% the increase of the Electrical Resistance was more intense following a continuously increasing rate which became very high in the vicinity of fracture.
The representation of the fractional change in resistance  using a logarithmic scale in correlation to the normalized bending load
  is quite interesting (see Figure 4).
In Figure 4 three ranges of interest are designated regarding the level of the applied bending load. These ranges show in a discrete way the variation of the fractional change in Electrical Resistance. The first range 1), corresponds to the preliminary levels of load
 including low but continuously increasing values of
 . The second range 2) corresponds to the intermediate levels of load (0.3 Lfr to 0.8 Lfr). Within this range an empirical exponential law seems to domi-
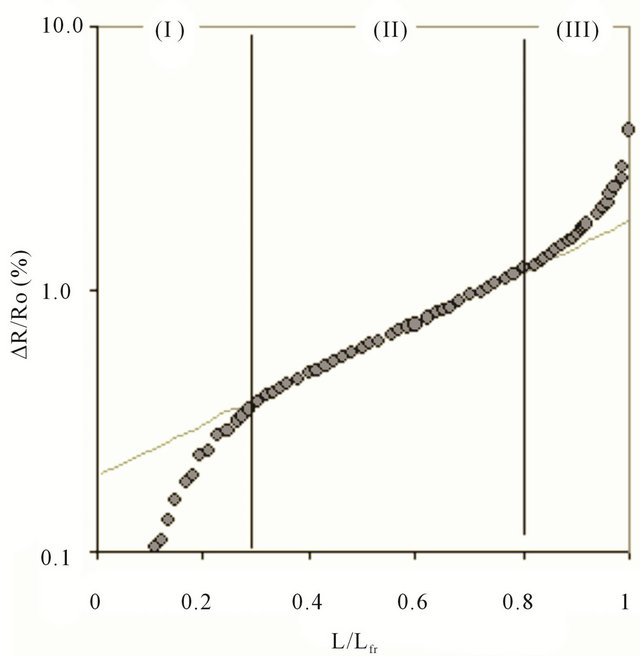
Figure 4. Fractional change of the Electrical Resistance  with respect to the normalized bending load
 .
.
nate. This law can be described by the following equation:
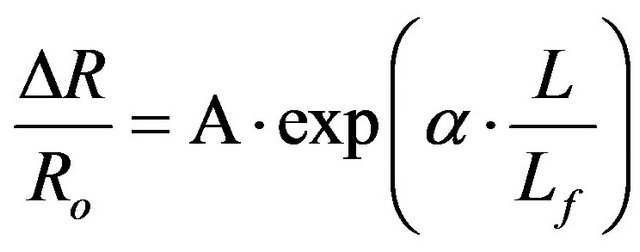 (1)
(1)
where Α and α are constant quantities.
Repeated experiments performed on the same kind of beams, made by the same mixture and having the same dimensions, prove the validity of the proposed law within practically similar ranges of loading. The values of the coefficient α were between 2 and 2.8. When the load exceeded the level of 0.8 Lfr, a clear deviation of the law was observed showing that the fractional change in Electrical Resistance was more intense and became higher when reaching fracture. This variation observed to the fractional change rate of the resistance for 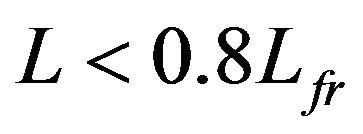 seems to constitute a criterion for estimating the oncoming damage.
Finally, by exploiting the presence of integrated electrodes in the beams, another set of experiments were conducted for the detection and measurement of electrical current emissions under 3PB tests. Figure 5(a) shows a typical recording of such an electrical current. This
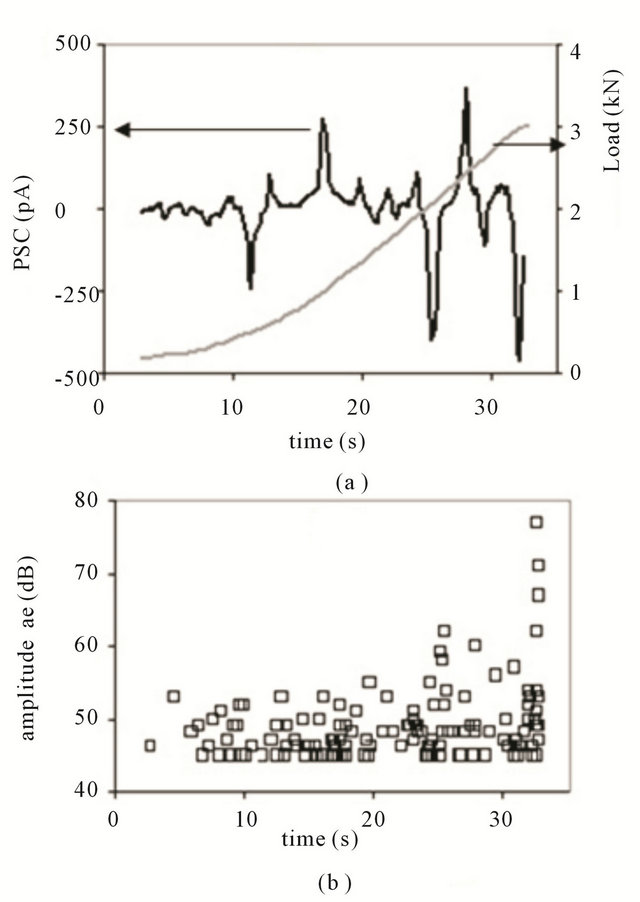
Figure 5. The temporal variation of the PSC (a), and the corresponding mechanical load (a), the amplitudes of the AE events (b).
electrical signal is the result of creation, evolution and spread of microcracks as during these processes charge separation phenomena are observed [9,11]. Because of the random orientation of the evolution and spread of the microcracks an intense fluctuation of the electrical signal was observed. The fluctuation becomes significant as the time of fracture was approaching.
Figure 5 shows, in time correspondence with the PSC signal, the amplitudes of the AE events that are greater than 45 dB. The cumulative energy of the AE events was calculated and normalized with respect to the maximum value that was detected at the exact time of fracture. The corresponding cumulative energy of the electrical signal was also calculated.
The temporal variation of the normalized cumulative energies of the AE and the PSC is shown in Figure 6. A good correlation is evident and clear since abrupt changes of the cumulative energy values co-exist for the PSC and AE emissions.
5. Conclusions
Combined laboratory experiments are conducted involving the detection and measurement of Electrical Resistance variations, as well as the detection and recording of electrical currents and acoustic emissions when 3PB mechanical loading is applied on cement mortar beams. The adopted experimental techniques seem to act in a supplementary way for monitoring the damage initiation and propagation processes. The electrodes used to conduct the electrical measurements where incorporated in the bulk of the specimens in order to provide reliable and reproducible results.
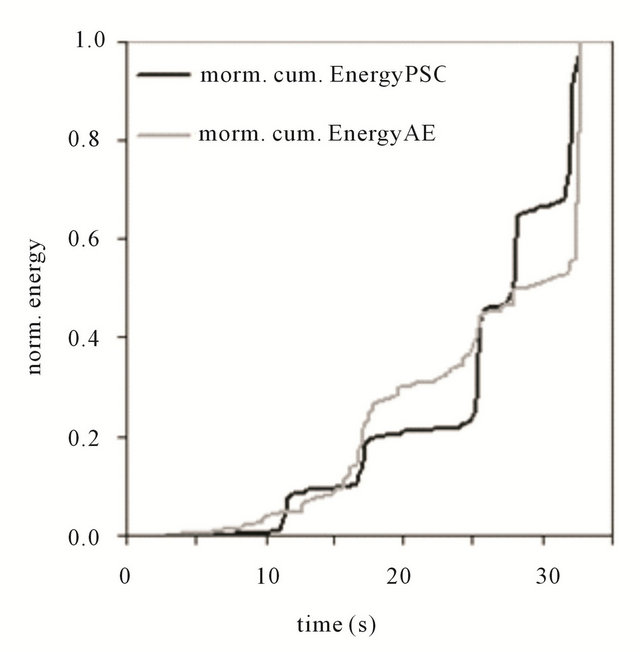
Figure 6. The temporal variation of the normalized cumulative energies of the AE events and the corresponding PSC.
The research showed a good correlation of variations in the Electrical Resistance with the AE events. In a cement mortar beam that is subjected to 3PB tests the damage occurred in the bulk of the material causes discontinuities regarding the conductive path between the electrodes. This results in the increase of the Electrical Resistance. During the loading process and especially in the vicinity of fracture, the Electrical Resistance of the beam is severely changed.
The exploitation of Electrical Resistance behavior together with the PSC and AE recordings seems to be a practical tool for detecting the upcoming damages of a cement-based material.
6. Acknowledgements
This research has been co-funded by the European Union (European Social Fund) and Greek national resources under the framework of the “Archimedes III: Funding of Research Groups in TEI of Athens” project of the “Education & Lifelong Learning” Operational Programme.
REFERENCES
- V. Pensee, D. Kondo and L. Dormieux, “Micromechanical Analysis of Anisotropic Damage in Brittle materials,” Journal of Engineering Mechanics, Vol. 128, No. 8, 2002, pp. 889-897.
- R. Mahnken, D. Tikhomirov and E. Stein, “Implicit Integration Scheme and Its Consistent Linearization for an Elastoplastic-Damage Model with Application to Concrete,” International Journal of Computers and Structures, Vol. 75, No. 2, 2000, pp. 135-143. doi:10.1016/S0045-7949(99)00089-9
- E. N. Landis, “Micro-Macro Fracture Relationships and Acoustic Emissions in Concrete,” International Journal of Construction and Building Materials, Vol. 13, No. 1, 1999, pp. 65-72. doi:10.1016/S0950-0618(99)00009-4
- C. U. Grosse and M. Ohtsu, “Acoustic Emission Testing. Basic for Research—Applications in Civil Engineering,” Springer-Verlag, Berlin Heidelberg, 2008. doi:10.1007/978-3-540-69972-9
- E. N. Landis and S. P. Shah, “The Influence of Microcracking on the Mechanical Behavior of Cement Based Materials,” Advanced Cement Based Materials, Vol. 2, No. 3, 1995, pp. 105-118. doi:10.1016/1065-7355(95)00003-A
- E. N. Landis, “Micro-Macro Fracture Relationships and Acoustic Emissions in Concrete,” Construction and Building Materials, Vol. 13, No. 1, 1999, pp. 65-72. doi:10.1016/S0950-0618(99)00009-4
- D. D. L. Chung, “Damage in Cement-Based Materials, Studied by Electrical Resistance Measurement,” Materials Science and Engineering R: Reports, Vol. 42, No. 1, 2003, pp. 1-40. doi:10.1016/S0927-796X(03)00037-8
- S. H. Wen and D. D. L. Chung, “Damage Monitoring of Cement Paste by Electrical Resistance Measurement,” Cement and Concrete Research, Vol. 30, No. 12, 2000, pp. 1979-1982. doi:10.1016/S0008-8846(00)00351-3
- A. Kyriazopoulos, C. Anastasiadis, D. Triantis and J. C. Brown, “Non-Destructive Evaluation of Cement-Based Materials from Pressure-Stimulated Electrical EmissionPreliminary Results,” International Journal of Construction and Building Materials, Vol. 25, No. 4, 2011, pp. 1980-1990. doi:10.1016/j.conbuildmat.2010.11.053
- A. Alexandridis, D. Triantis, I. Stavrakas and C. Stergiopoulos, “A Neural Network Approach for Compressive Strength Prediction in Cement-Based Materials through the Study of Pressure-Stimulated Electrical Signals,” Construction and Building Materials, Vol. 30, 2012, pp. 294- 300. doi:10.1016/j.conbuildmat.2011.11.036
- D. Triantis, I. Stavrakas, A. Kyriazopoulos, G. Hloupis and Z. Agioutantis, “Pressure Stimulated Electrical Emissions from Cement Mortar Used as Failure Predictors,” International Journal of Fracture, Vol. 175, No. 1, 2012, pp. 53-61.
- P. Kyriazis, C. Anastasiadis, I. Stavrakas, D. Triantis and J. Stonham, “Modelling of Electric Signals Stimulated by Bending of Rock Beams,” International Journal of Microstructure and Materials Properties, Vol. 4, No. 1, 2009, pp. 5-18. doi:10.1504/IJMMP.2009.028429
- S. H. Kosmatka, B. Kerkoff and W. C. Panarese, “Design and Control of Concrete Mixtures,” 14th Edition, The Portland Cement Association, Portland, 2002.