Advances in Microbiology
Vol. 3 No. 2 (2013) , Article ID: 32359 , 10 pages DOI:10.4236/aim.2013.32028
Determining the Minimum Inhibitory Concentration of Bacteriophages: Potential Advantages*
Microbiology Team, Gangagen Biotechnologies Pvt. Ltd., Raghavendra Layout, Opp. MEI Ltd., Bangalore, India
Email: #sripad@gangagen.com
Copyright © 2013 Aradhana Vipra et al. This is an open access article distributed under the Creative Commons Attribution License, which permits unrestricted use, distribution, and reproduction in any medium, provided the original work is properly cited.
Received February 11, 2013; revised March 11, 2013; accepted April 11, 2013
Keywords: Bacteriophage K; MIC; Phage 44AHJD; Phage P954; Staphylococcus aureus; Temperate Phage
ABSTRACT
The minimum inhibitory concentration (MIC) is the concentration at which an antibacterial agent experiences the complete inhibition of organism growth. Bacteriophages represent a rich and unique resource of anti-infectives to counter the growing world-wide problem of antibiotic resistance. In this study, we compared the host range of lytic bacteriophages and temperate phagesbelonging to various genera, namely Staphylococcus, E. coli and Salmonella, with a range of clinical isolates using two methods: the classical agar overlay method and a newly developed MIC method. MIC was only observed with isolates that were susceptible to phage infection, which correlated with the agar overlay assay, whereas no MIC was detected with isolates that were resistant to phage infection. The simple MIC method was useful in determining phage adsorption and host range, and detecting possible prophage contamination in phage preparations. Interestingly, this method was also applicable to strain differentiation through phage susceptibility testing using a 96-well, high throughput format that proved to be easy, cost-effective, fast and reliable.
1. Introduction
In the early twentieth century, Frederick Twort and Felix d’Herelle discovered bacteriophages that caused the lysis of bacterial cells [1]. Since their discovery, phages have been used in various practical applications, including in human and veterinary medicine [2-4]. Phages are widely distributed throughout nature in substances such as soil, water, air, surfaces, oceans, freshwater, the rhizosphere, plants, food, industrial fermentations and on the outside and in the body cavities of humans and animals [5]. Up to 9 × 10⁸ PFU∙mL−1 has been found in sea water, and up to 70% of marine bacteria may be infected by phages according to Prescot’s (1993) report [6]. For a considerable time, a diverse population of bacteriophages has been known to be present in the rumens of sheep and cattle [7-10]. These phages probably play a major role in the population dynamics of ruminal bacteria. Phages are widely distributed in soil, air and the intestines of animals, where bacterial hosts are prevalent. Between 10% and 20% of planktonic marine bacteria are lysed by viruses (phages) each day, according to Suttle [11].
Phages have also been used in the identification and differentiation of bacterial genera due to their specificity; that is, up to 6 orders of magnitude in sensitivity to the same titer of phage [12]. The approval and designation of phages that have earned the “generally regarded as safe” (GRAS) status from the US FDA for controlling Listeria monocytogenes in ready-to-eat meat and cheese products represents an acceptance of phages among regulated antibacterials as the next generation of antimicrobials [4].
The first step in bacterial identification or differentiation using bacteriophages is the adsorption of the phage to the bacterial surface. The extent of this binding is defined as the host range of a phage that is one of the defining biological characteristics of a particular bacterial virus [13].
Phages’ resistance to adsorption could be due to a variety of factors including the loss of phage receptor molecules on hosts; physical barriers such as capsules masking the receptor molecules; and restriction-modification mechanisms such as phage-genome uptake blocks, super-infection immunity and restriction modification [14].
To use phages for diagnostic or therapeutic purposes, the differentiation of phage types is a critical parameter. The common gold standard method for enumerating and differentiating phages is the double agar overlay assay [15]. This method, however, is limited by its inability to differentiate between various types of phages, such as virulent or temperate, because it distinguishes between phages according to phenotypic marker differences such as plaque morphology or the phages’ host range [16].
In 1992, the American Public Health Association (APHA) proposed a single-agar-layer plaque for coliphage enumeration from ground and surface water samples. In general, the limitations of this agar-based method are poor plaque visibility [17], false positive results caused by non-viral toxic material [18], poor adsorption of phages on the bacterial surface [19], superinfection immunity [20] and its restriction modification system [21] in which the success of a phage infection depends on the host’s restriction-modification (R-M) system, which depends on issues such as the activities of the host methyltransferase, the restriction endonuclease and the number of susceptible sites in the phage genome.
To overcome the problems associated with the various methods of phage enumeration, phage host range determination and bacterial differentiation, we attempted a simple and robust method for detecting phage sensitivity that also proved to be a simple technique for differentiating between phage types.
We realized that any bacterial isolate’s sensitivity to a particular antibacterial agent, such as an antibiotic, is measured by establishing the minimum inhibitory concentration (MIC) or breakpoint, defined as the lowest concentration (conventionally tested in doubling dilutions) of antibiotic at which an isolate cannot produce visible growth after overnight incubation. MICs can be determined using agar or broth dilution techniques and following the reference standards established by various authorities such as the Clinical and Laboratory Standards Institute (CLSI, US), the British Society for Antimicrobial Chemotherapy (BSAC, UK), the Agence Francaise de Securite Sanitaire des Produits de Sante (AFFSAPS, France), the Deutsches Institutfür Normunge.V. (DIN, Germany) and the International Society of Chemotherapy (ISC)/World Health Organization (WHO). The antimicrobial resistance of bacterial pathogens is a major problem in the treatment of animal and human patients with bacterial diseases. Determining the MIC of antibiotics designed to fight bacteria plays a crucial role in the study of their bacterial resistance.
We tried extrapolating the MIC concept to include bacteriophages, expressing their MIC in terms of multiplicity of infection (MOI), which indicates the number of phage particles required to achieve the absence of visible bacterial growth. There could be significant advantages to determining the MIC of a phage; for instance, assays samples could be simultaneously assayed in a cost-effective, less laborious manner that would require simple equipment including a spectrophotometer and an incubator shaker for MIC determination.
It has been speculated that the MIC method might be useful in phage adsorption studies. The various phages that have been tested to determine their MICs include Staphylococcus phages K and 44AHJD [22,23]; the temperate Staphylococcus phage P954 [4,24]; the Salmonella phage P16; a virulent T1 type phage isolated in our laboratory; and the well known E. coli phages T4, T7 and lambda [25]. The results for the MICs for all of these phages are subsequently disclosed.
2. Materials and Methods
2.1. Bacterial Strains and Bacteriophages
Fifty Staphylococcus aureus isolates comprising 27 methicillin-resistant Staphylococcus aureus (MRSA) and 23 methicillin-sensitive Staphylococcus aureus (MSSA) collected from hospitals in and around Bangalore, India and 36 global strains (33 MRSA and 3 MSSA) were used to assess the bactericidal activity of one of the virulent staphylococcus bacteriophages (K) and one lysogenic phage (P954). Thirty distinct, typed isolates of global representation were obtained in the US from the Public Health Research Institute (PHRI), New Jersey. Phage K (NC07814-02) was obtained in the UK from the Health Protection Agency Culture Collections. All of the strains were cultured in LB broth at 37˚C on a rotary shaker (200 rpm), unless otherwise stated. While Salmonella phage P16 was isolated in-house and the Salmonella isolates were from poultry farms, the E. coli phages T4, T7, lambda and LE392 were purchased from Bangalore Genei Pvt. Ltd., in Bangalore, India and the listed isolates were collected from various hospitals in India.
2.2. Propagation of Bacteriophages
Phage K and phage P954 were propagated in a prophage free S. aureus host RN4220, because we have observed that prophage free hosts produce pure homogenous phage preparations with no prophage contamination (Nirmal et al., 2012), whereas phage 44AHJD was propagated in RN4220 cells carrying heterologous endolysin pGMB540, as previously described (Nirmal et al., 2012). Although the E. coli phages T4 and T7 were propagated in BL21 cells, the lambda phage was propagated in LE392 E. coli cells. For propagation of Salmonella gallinarum phage P16, cells of Salmonella gallinarum were used.
Briefly, the propagating hosts were grown at 37˚C in LB broth to an absorbance of ~0.8 at 600 nm and infected with respective phages at an MOI of 0.1, then further incubated for upto 4 hours. Phages were harvested after the centrifugation of the culture lysate at 3000 × g for 10 min (Plastocrafts, Mumbai, India) to remove the debris. The supernatants were further filtered through a 0.2 µm filter and the preparation was evaluated for phage titer.
2.3. Host Range Determination of Phage Lysates by Agar Plaque Assay
Phage plaques were enumerated and titers were determined by the agar overlay method [26]. The host range of the phage was determined by the agar overlay method and scored as three different types. The hosts in which phages propagated and showed visible plaques were classified as susceptible/propagating range (PR) hosts. The hosts in which the phages killed the hosts only at a high MOI through the “lysis from without” phenomenon were classified as killing range (KR) hosts. The hosts that were resistant to phage action were classified as resistant (R) hosts. These terminologies are henceforth used in this article to differentiate between strain types, unless otherwise mentioned.
2.4. Determining the MIC of Phages
The MICs of phages, both virulent and temperate, were determined using the microbroth dilution method in a 96-well microplate for the three host types (PR, KR and R). The test strains were grown overnight on LB agar and individual colonies picked from the plates were suspended in LB broth to match the 0.5 McFarland standard (~1 × 10⁸ CFU∙mL−1), then distributed in 100 µL volumes into a 96-well microtiter plate. The phage preparations were diluted to contain different numbers of phages, ranging from ~109 to 10−3 PFU, and 100 µL of phage dilutions were added to wells containing bacterial cells. Corresponding cell controls, phage controls and media controls were maintained. The microtiter plates were incubated at 35˚C overnight without shaking. The lowest concentration of phage at which no turbidity was seen was regarded as the MIC.
2.5. Determining Cell Viability Using MTT Assay and Its Application to the MIC Method
Microculture tetrazolium assays (MTAs) have been used to probe the relationships between the cell survival, growth and differentiation that rely on the cellular reduction of tetrazolium salts to their intensely colored formazans in mammalian cells [27,28]. This reagent has also been used effectively to differentiate between live and dead bacteria because only live bacteria convert the dye into an insoluble purple formazan measured at 560 nm
[29]. We adopted this method of quantifying dead cells by MTT assay in the MIC method of bacterial differenttiation using phages. The tetrazolium compound used was 3-[4,5-dimethylthiazol-2-yl]-2,5-diphenyltetrazolium bromide (MTT), prepared by dissolving MTT in a cellbased assay buffer at 5 mg∙mL−1. We used the MIC assay, as previously described, to visually differentiate between the live and dead cells, and after a 16 h incubation period, 20 µL of MTT reagent was added to each well and observed for color development after 2 h.
2.6. Phage Adsorption as Detected by MIC
The adsorption of phage K was conducted on RN4220 cells at 37˚C for 20 min and spun at 10 K with the supernatant filtered through a 0.2 µm filter. The samples were then serially diluted and 100 µL from each dilution was added to a microtiter plate, each well of which contained 100 µL of RN4220 (1 × 10⁵ CFU∙mL−1).The plate was incubated at 35˚C for 18 h and observed for MIC. E. coli C cells were taken as a negative control for the adsorption studies.
The results were correlated by spotting the supernatants on the RN4220 lawn to detect unadsorbed phages. The MIC to detect the adsorption of phage K was conducted on one sensitive isolate with PR, one sensitive isolate with KR and one resistant isolate. The phages were exposed for 20 min on each isolate, individually, at 37˚C, and then spun at 10 K for 5 min while the supernatant was collected and filtered through a 0.2 µm filter and serially diluted before being used for the MIC on RN4220 to detect adsorption by observing shifts in the MIC well.
All of the figures depicted in this article are representtative examples from the selected set of MIC studies that show the residual viable cells after the MIC studies using the MTT dye. These are purely meant to show the nonviable cells in hosts in which cells were killed through the “lysis from without” phenomenon, by a high MOI of phages.
3. Results
3.1. Bacteriophage Amplification, Enumeration and Host Range Determination
The host range of all of the bacteriophages was assessed on a panel of isolates that included both antibiotic resistant clinical isolates isolated from various hospitals and poultry farms. From this panel, we chose isolates based on their phage susceptibility status (PR, KR and R).
3.2. Determining the MICs of Phages by MTT Assay
Only the live bacterial cells produced the formazan color with no exceptions in any of the MIC data presented in this article. For Staphylococcus phage K, an MIC of 0.0006 MOI was observed for its propagating host, RN4220, and ranged between 0.0016 - 2.0 MOI for the clinical isolates tested. Among these isolates, the MIC for the three strains of USA 100 ranged between 0.0016 and 0.125 MOI while the three strains of USA 300 ranged between 0.002 and 0.1 MOI. The MICs for S. aureus USA 400 (MW2) and USA 500 were 2.0 and 0.0057 MOI, respectively. The MIC for the S. aureus Newman strain was 0.10 MOI. The results are presented in Table 1. Interestingly, MIC values of 400 MOI and more were seen for the KR isolates, whereas no MICs were detected for the resistant isolates. The MIC data correlated well with the agar overlay results.
Table 2 compares phage susceptibility by agar overlay and MIC method for S. aureus isolates. The data demonstrate that only strains in which the phage 44AHJD propagates showed MICs between the range of 0.01 and 0.02 MOI, while for isolates exhibiting killing by the “lysis from without” phenomenon, the MICs were in the range of 100 and 1000 MOI. No MICs were detected for resistant isolates.
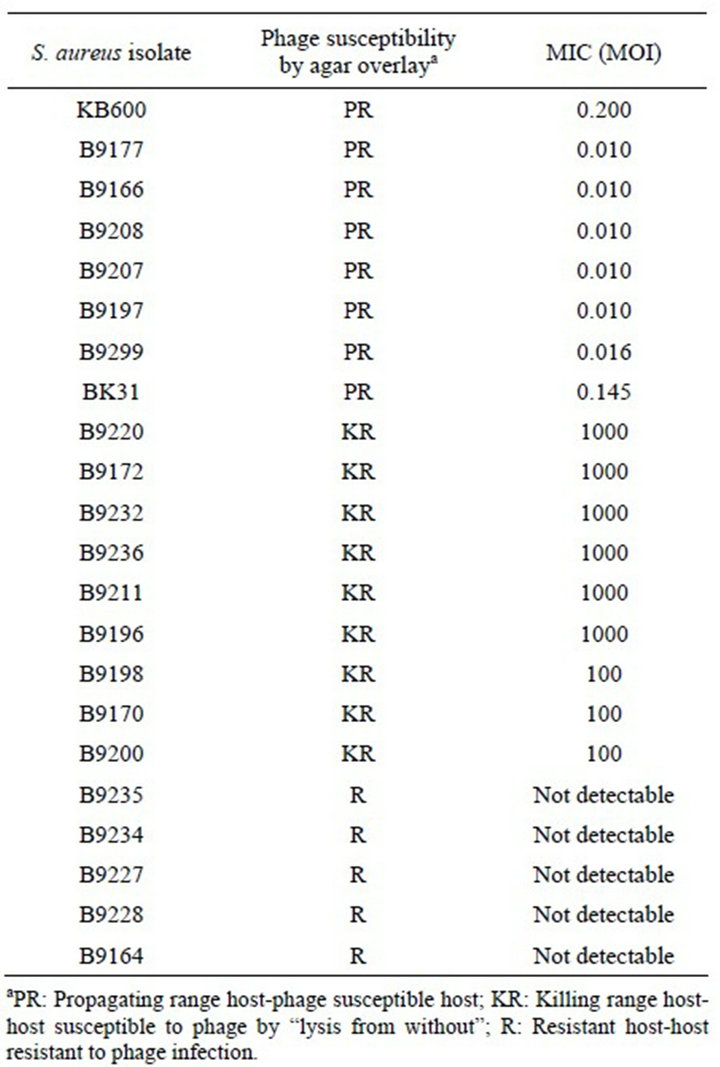
Table 1. Phage K susceptibility testing.
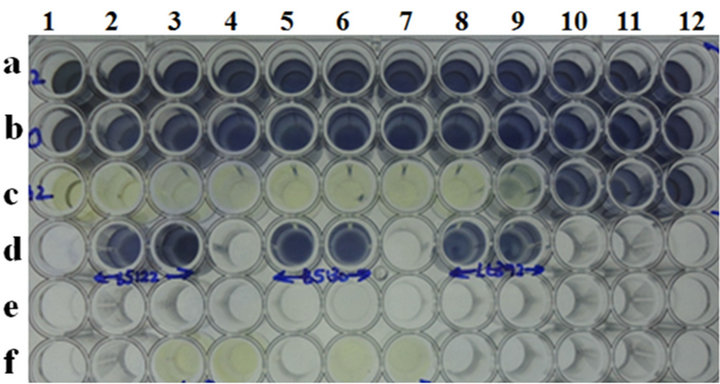
Our recent work on the 44AHJD phage demonstrated that the phage plaque on the S. aureus 8325 host did not reveal any phage plaques on its derivatives (8325-4 and RN4220) unless supplemented by heterologous endolysin [14]. We wanted to determine whether such a difference could also be detected using the MIC method. Our results indicate that an MIC of 0.0342 MOI was achieved for the phage on the host 8325 while the hosts 8325-4 and RN4220 showed MICs of 382 and 1000 MOI, respecttively, for the same phage. In RN4220 cells with endolysin supplementation, the same phage exhibited an MIC of >5250 MOI (Figure 1). The lesser MIC of the
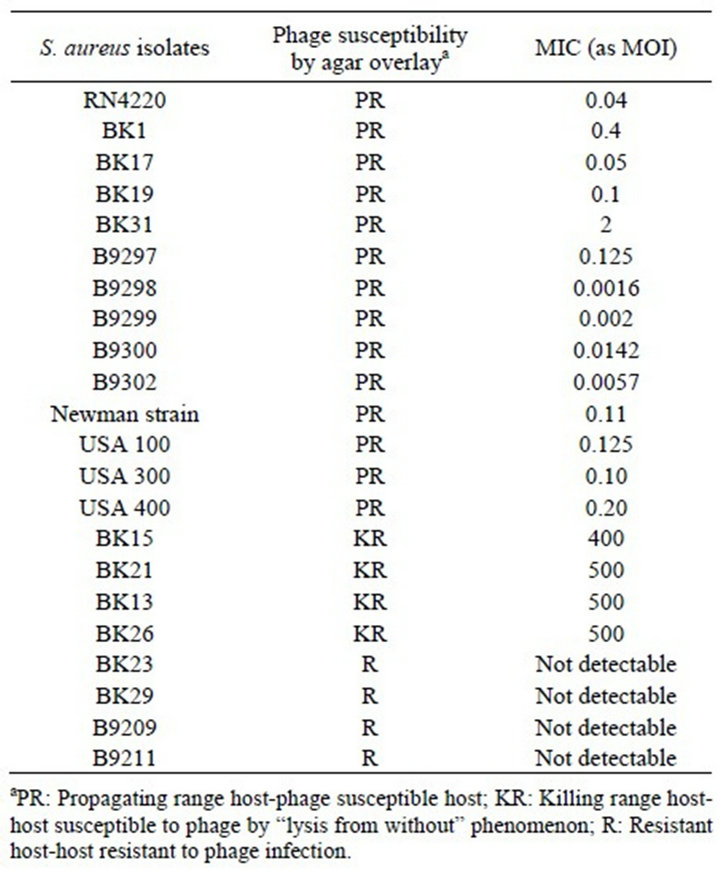
Table 2. Phage 44AHJD susceptibility testing.
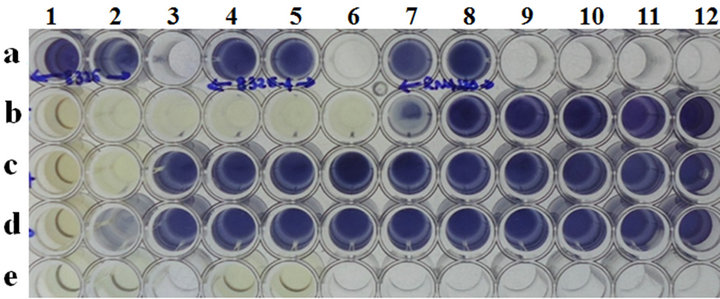
Microtiter plate wells a1 and a2: Cell control of 8325, wells a4 and a5: cell control of 8325-4; wells a7 and a8: cell control of RN4220; wells b1 to b12: 8325 cells with 44AHJD phage at various MOI’s (6842 to 0.00000006842); wells c1 to lanes c12: cells of 8325-4 with 44AHJD phage at various MOI’s (6842 to 0.00000006842); wells d1 to d12: cells of RN4220 with 44AHJD phage at various MOI’s (6842 to 0.00000006842); wells e1 and e2: media control and well e4 and e5: 44AHJD phage control.
Figure 1. MIC determination of 44AHJD virulent phage for selected S. aureus hosts by MTT assay.
44AHJD phage with the RN4220 strain, compared with its parent 8325 cells, can be explained by the presence of prophages in the wells containing 8325 cells and the 44AHJD, supporting our hypothesis that 44AHJD releases prophages when propagated in cells carrying prophages [14].
3.3. MIC Determination of Temperate Staphylococcus Bacteriophage P954
S. aureus isolates with various degrees of susceptibilities to the phage P954 were chosen. As expected, this phage only exhibited MICs on two susceptible hosts: BK18 and RN4220. No MIC was observed on the resistant isolates B9226, BK30 and BK1 (Table 3). In addition, the MIC was >1111 MOI for a KR isolate.
3.4. Phage Susceptibility of Salmonella gallinarum Phage P16
It is evident that the MIC of this phage was only detected for propagating hosts ranging between 0.00002 and 13 MOI, with no MIC detected for resistant isolates. Table 4 presents a comparison of the agar overlay and the MICs for a panel of clinical isolates of Salmonella from a poultry farm. For the MTT assay, we chose three hosts: one PR, Salmonella gallinarum G23; one KR, Salmonella Enteritidis32; and one R, Salmonella Enteritidis1. The results show that MICs were only detected in the PR host (MOI of 10 and below) and the KR host (MOI of ~80), but not in the resistant host (Figure 2). These results correlate very well with the agar overlay results.
3.5. MIC Determination of E. coli Bacteriophages
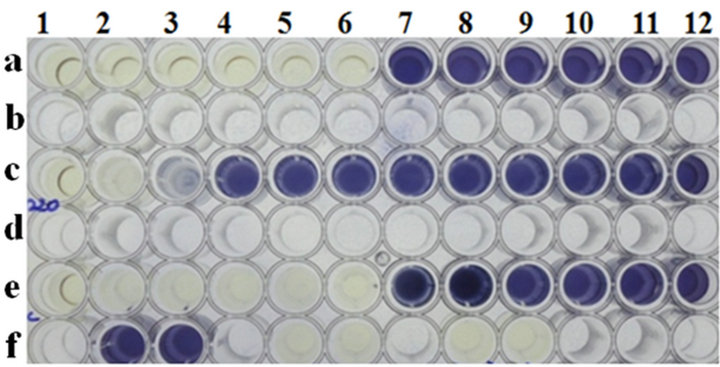
Gram-negative bacteriophages such as lambda, T4 and T7 were used in this study. While the T4 and T7 phages exhibited MICs of 0.0136 and 0.000272, respectively, it was only on propagating host BL21cells, with no detectable MIC on its resistant isolates B5122 and B5130, respectively (Table 5, Figure 3(a)). Phage lambda showed
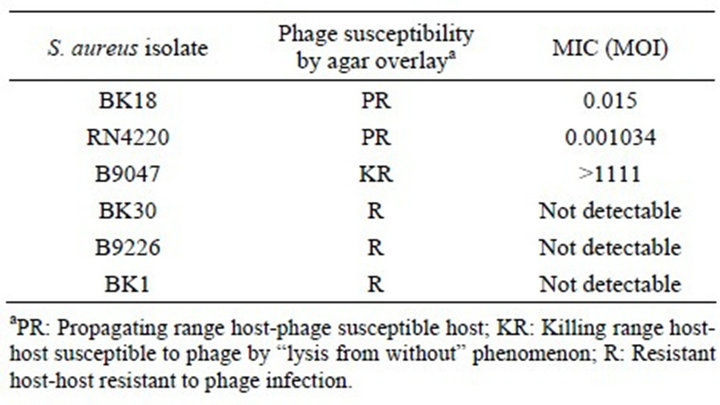
Table 3. Phage susceptibility testing of temperate Staphylococcus aureus phage P954.
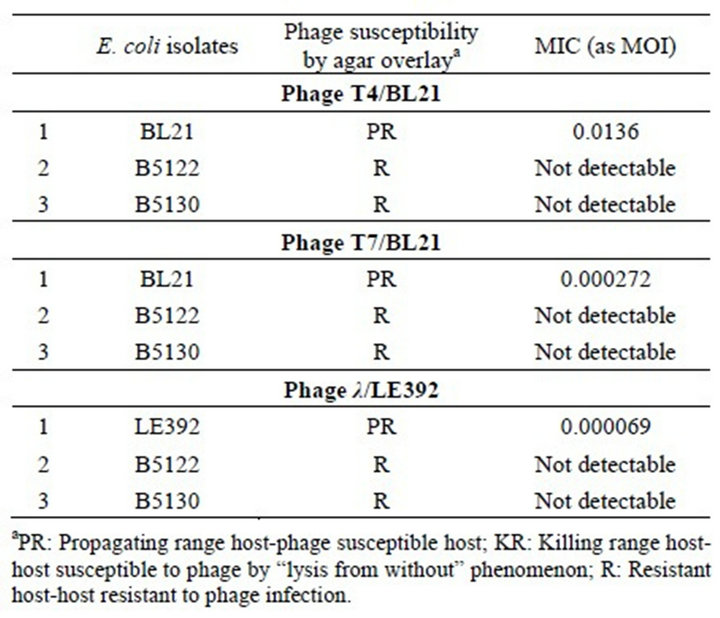
Table 4. MIC of S. gallinarum phage P16 on various clinical isolates of Salmonella spp.
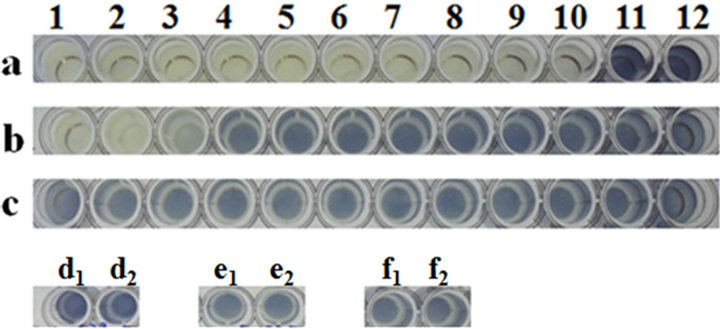
Microiter plate well nos. a1 to a12: Salmonella Gallinarum G16 cells with P16 phage at various MOI’s (4280 to 0.00000004280); wells b1 to b12: Salmonella enteritidis Ent 32 cells with P16 phage at various MOI’s (4280 to 0.00000004280); wells c1 to c12: Salmonella Enteritidis 1 cells with P16 phage at various MOI’s (4280 to 0.00000004280). wells d1 and d2: cell control of S. Gallinarum; wells e1 and e2; cell controls of S. Enteritidis 32; f1 and f2: cell controls of S. Enteritidis 1.
Figure 2. MIC determination of Salmonella phage P16 on three selected isolates of Salmonella gallinarum, Salmonella enteritidis 32 and Salmonella enteritidis 1 by MTT assay.
an MIC of 0.000069 MOI only for its propagating host, LE392, and it did not show any MIC on resistant isolates B5122 and B5130 (Table 5, Figure 3(b)). Because we did not have any isolates in the KR category, such isolates were not included for these phages in this study.
3.6. MIC to Detect Phage Adsorption
It is evident from Figure 4(a) that phage K on the RN4220 lawn resulted in a drastic reduction in phage titers after adsorption to RN4220 cells, as described in the material and methods section. Such a result correlates well with the observed reduction in the MIC of residual phage K after adsorption to RN4220 cells (Figure 4(b)).
4. Discussion
Antibiotic resistance amongst bacterial pathogens is a
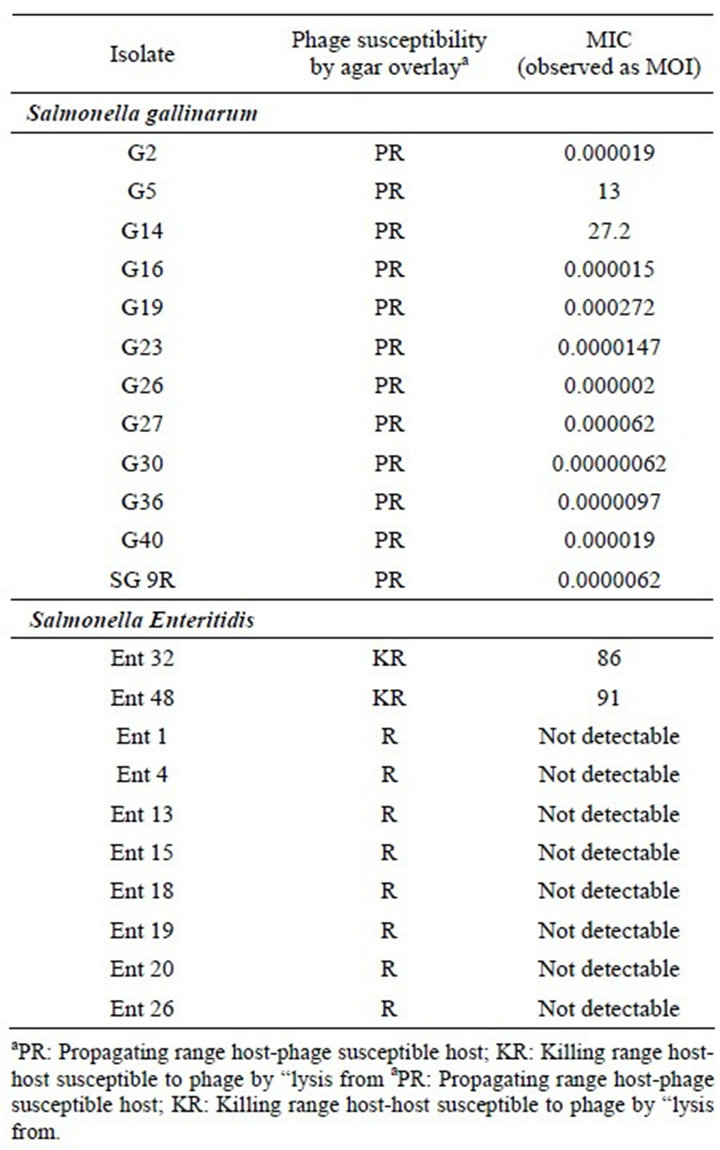
Table 5. Plaque test of selected Gram negative phages on E. coli clinical isolates and a lab strain.
cause of widespread concern. Despite continuous and vigorous efforts, the discovery of new anti-bacterials has not kept pace with the requirements of the medical profession. Bacteriophage therapy, all but forgotten in the wake of the antibiotic era, has been attracting the attention of many research groups [30] and efforts are being made to develop this naturally occurring agent into a preventive or therapeutic product. Virulent phages appear to be somewhat similar to antibiotics because they display remarkable antibacterial activity. Recent reports on the effects that such agents and their derivatives [24, 31-34] have on antibiotic resistant strains suggest a significant clinical advantage. One study has shown that phages are more effective than antibiotics in treating certain infections in humans and experimentally infected animals [35].
Bacteriophage preparations were used in the pre-antibiotic days to treat human infections. At that time, not much was known about the nature of bacteriophages and the system of approving a drug for human use was not as
 (a)
(a)
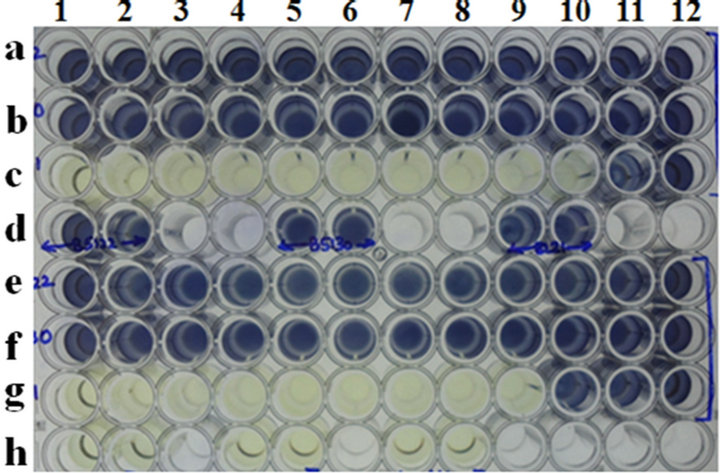
Microtiter plate well nos. a1 to a12: cells of B5122 with T4 phage at various MOI’s (27272 to 0.000000272); wells b1 to b12: cells of B5130 with T4 phage at various MOI’s (27272 to 0.000000272); well nos. c1 to c12: cells of BL21 with T4 phage at various MOI’s (27272 to 0.000000272); wells d1 and d2: B5122 cell controls; wells d4 and d5: B5130 cell controls; wells d7 and d8: BL21 cell controls. Microtiter plate well nos. e1 to e12: Cells of B5122 with T7 phage at various MOI’s (136000 to 0.00000136); wells f1 to f12: cells of B5130 with T7 phage at various MOI’s (136000 to 0.00000136); well nos. g1 to g12: cells of BL21 with T7 phage at various MOI’s (136000 to 0.00000136); wells h1 and h2: T4 phage controls; wells h4 and h5: T7 phage controls; wells h7 and h8: media controls.
 (b)
(b)
Microplate well nos. a1 to a12: cells of B5122 with lambda phage at various MOI’s (6956 to 0.00000006956); wells b1 to b12: cells of B5130 with lambda phage at various MOI’s (6956 to 0.00000006956); well nos. c1 to c12: Cells of LE392 with lambda phage at various MOI’s (6956 to 0.00000006956); wells d2 and d3: B5122 cell controls; wells d5 and d6: B5130 cell controls; wells d8 and d9: LE392 cell controls.
Figure 3. (a) MIC determination for Gram negative phages by MTT assay. (a) MIC of T4 and T7 phage on selected clinical isolates of E. coli and one lab strain of E. coli; (b) MIC of lambda phage on E. coli clinical isolate B5122 and B5130 and one lab strain of E. coli.
rigorous and standardized as it is today. Because a phage is a complex molecule and does not diffuse like an antibiotic, it is not possible to use a test similar to the disc diffusion test for this particular purpose. In this study, we examined whether a test similar to the determination of minimum inhibitory concentration can be applied to phage preparations so that clinical laboratories might test the sensitivity of clinical isolates to identify the causative organism and future courses of action and treatment.
In addition to their potential therapeutic uses, bacteriophages are also being used in various practical appli-
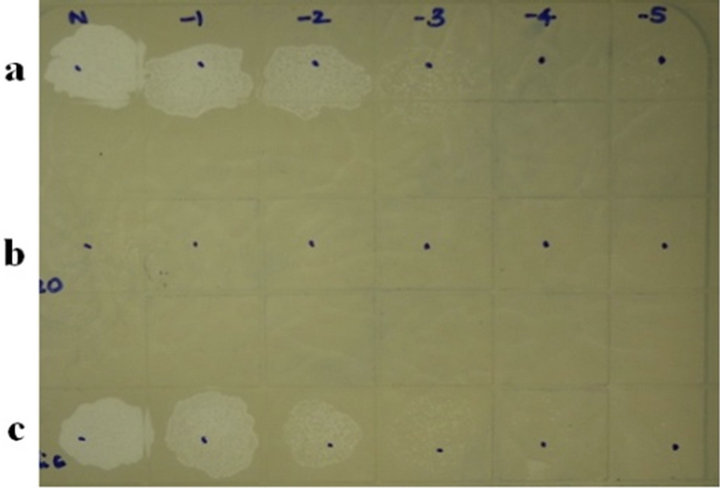 (a)
(a)
Panel a: phage K plaques by routine test dilutions before adsorption to RN4220 cells; panel b: phage K titres after adsorption; panel c: phage K titer after adsorption to a non-adsorbing host E. coli C.
 (b)
(b)
Microtiter plate wells a1 to a12: cells of RN4220 with phage K at various MOI’s (400 to 0.000000004); wells c1 to c12: cells of RN4220 with phage K at various MOI’s (0.1 to 0.000000000001) after a brief adsorption on RN4220 to estimate residual titers; wells e1 to e12: cells of RN4220 with phage K at various MOI’s (400 to 0.000000004) after adsorption to a non-adsorbing host E. coli C; wells f2 and f3: RN4220 cell controls; wells f5 and f6: media control; wells f8 and f9: phage control. Note that there is no loss of titer of phage K after adsorption to its non-adsorbing host E. coli C.
Figure 4. (a) Detection of phage adsorption by MIC method followed by MTT assay. (a) Phage K titers by routine test dilution method on RN4220 lawn; (b) Phage K MIC estimation by MTT assay before and after adsorption.
cations ranging from decontaminating foods to differenttiating between bacterial strains for therapeutic purposes. Therefore, it is important to determine their concentrations quickly and reliably, and the proposed MIC method appears to be both reliable, and reproducible. Bacteriophages are extremely specific, and their host ranges are dictated by the presence of suitable receptors on the surface of the infected host and by the phage adsorption rate, which dictates the success of phage infection. In some cases, although the phages show no visible plaques, it becomes important to examine whether there are recaptors for the phage in question by performing phage adsorption tests, which are also a method for differentiating between the various bacteria reported several years ago [36].
Routinely, phage adsorption is achieved by incubating suitable host cells (108 CFU∙mL−1) with a phage lysate at an MOI of 0.1 at 37˚C. At intervals, aliquots of the mixture are centrifuged to sediment the phage-adsorbing cells and the cell-free supernatant fluids are assayed for unadsorbed free phages [37]. This method is laborious and time consuming, and the proposed MIC method appears to be an interesting alternative. In addition, one of the main factors affecting plaque formation is the density of the indicator cells on the plates, because a very dense confluent lawn would affect infection by phage, resulting in very small plaques [38]. None of these factors affect the MIC method of detecting phage adsorption, which is novel, time-saving, easy and could even be applied to mammalian viruses for titer estimation.
To bind with a bacterial cell, a phage’s tail fiber (or attachment protein) and various other appendages must recognize the receptors on the host cell surface [39,40], and only a few phage gene products, usually in the range of one to three, are involved in the adsorption process, such that the success of observing a phage plaque using the agar method is not absolute. The proposed MIC method for the detection of phage adsorption is simple and capable of deftly handling several samples simultaneously.
Our present observations regarding the MICs of phages between 100 and 1000 MOI for isolates that are lysed by the “lysis from without” phenomenon (KR) support the literature, which notes that “lysis from without” is usually observed with a high MOI of phage, a phage/bacteria ratio of >100 and a high phage titer (≥109 phages∙mL−1) [41,42]. The proposed MIC method has exhibited applicability in both the temperate and virulent phages while our observations regarding the usefulness of this method of classifying hosts based on MOI values will certainly be beneficial. Based on our results, we claim that when the MIC values for any phage are below 10 MOI, then the host can be classified as a susceptible (propagatingPR) host. When the values are between 100 and 1000 MOI, the host can be classified as adsorbing, but not susceptible (KR). Meanwhile, the resistant host resists phage adsorption and hence any further action by the phages. Given that not all of the phages have demonstrated the ability to cause “lysis from without”, and because the number of phages required per cell to elicit this effect is not clear and probably highly variable depending on the host [43], the results for the MICs of uncharacterized phages must be interpreted with caution.
A rapid microtiter plate assay to determine the phage sensitivity of Lactococci and Enterococci has recently been developed. Based on the bacterial cells’ ability to grow in the presence of various phage concentrations, the acid-base indicator undergoes a color change due to acid production and it is used to measure phage adsorption to bacterial cells through the enzyme-linked immunosorbent assay (ELISA) technique, which uses anti-phage antibodies [44]. The disadvantage of this method is the need to generate phage antibodies in every case and the fact that the color change experienced by the acid-base indicator depends on the number of cells used.
Respiration provides a suitable measure of cell metabolic activity, delivering information on the effects of various conditions on bacterial cell viability [45]. It has been estimated using electron transport system (ETS) activity in bacteria [46,47]. As an indicator of reducing systems such as the ETS, tetrazolium salts have proven useful in a number of enzymatic assays. Von Bielig et al. [48] were the first to use a tetrazolium dye, 2-p-iodophenyl-3-(p-nitrophenyl)-5-phenyltetrazolium chloride (INT) to differentiate between bacterial cells in 1949, and it continues to be used routinely for detecting viable bacteria cells [49]. The reduction of INT is linked to the metabolic pathways of virtually all bacteria in aerobic and some anaerobic environments [47].
Other dyes, such as MTT and XTT, are now being used routinely by researchers to detect viable bacterial cells. Very recently, the tetrazolium reagent (2,3-bis-(2-methoxy-4-nitro-5-sulfophenyl)-5- [(phenylamino)carbonyl]-2H-tetrazoliumhydroxide (XTT), which is metabolically reduced in viable cells to a water-soluble formazan product, has proven useful in that it allows direct absorbance readings, therefore eliminating a solubilization step and shortening the micro culture growth assay procedure.
The MTT colorimetric bactericidal assays have been shown to produce comparable results with S. aureus, E. coli, L. monocytogenes and B. abortus cells [29], supporting our observations regarding the applicability of this dye in measuring viability in S. aureus, Salmonella, E. coli and Klebsiella. The MIC test can be conducted manually or it can be completely automated, depending on particular lab situations to handle several samples simultaneously. The MIC method could prove very useful in the diagnosis of bacterial strains through phage typing, and the results of this study determine the presence of prophages in any bacterial host, which is both novel and interesting.
5. Acknowledgements
The authors thank Dr. Janakiraman Ramachandran, Chairman, GangaGen Inc., US., for his constant support and encouragement. Thanks are also due to Dr. M. Jayasheela, Head, Clinical Research and Regulatory Affairs, Gangagen Biotechnologies Pvt. Ltd., Bangalore for his guidance during this study. Mr. N. Naveen Kumar’s initial assistance in one of the experiments is duly acknowledged.
REFERENCES
- D. H. Duckworth, “Who Discovered Bacteriophage?” Bacteriology Reviews, Vol. 40, No. 4, 1976, pp. 793-802.
- A. Sulakvelidze and P. Barrow, “Phage Therapy in Animals and Agri Business,” In: E. Kutter and A. Sulakvelidze, Eds., Bacteriophages: Biology and applications, CRC Press, Boca Raton, 2005, pp. 335-380.
- A. Sulakvelidze and E. Kutter, “Bacteriophage Therapy in Humans,” In: E. Kutter and A. Sulakvelidze, Eds., Bacteriophages: Biology and application, CRC Press, Boca Raton, 2005, pp. 381-436.
- V. D. Paul, S. Sudarson, R. S. Saravanan, S. Hariharan, K. Nanjundappa, S. Padmanabhan, B. Sriram and J. Ramachandran, “Lysis Deficient Phages for Controlling Bacterial Infection,” BMC Microbiology, Vol. 11, 2011, p.195. doi:10.1186/1471-2180-11-195
- H.-W. Ackermann and D. Prangishvili, “Prokaryote Viruses Studied by Electron Microscopy,” Archives of Virology, Vol. 157, No. 10, 2012, pp. 1-78. doi:10.1007/s00705-012-1383-y
- L. Prescott, “Microbiology,” Wm. C. Brown Publishers, Dubuque, 1993.
- J. C. Adams, J. A. Gazaway Jr., M. D. Brailsford, P. A. Hartman and N. L. Jacobson, “Isolation of Bacteriophages from the Bovine Rumen,” Experientia, Vol. 22, No. 11, 1966, pp. 717-718. doi:10.1007/BF01901335
- M. J. B. Paynter, D. L. Ewert and W. Chalupa, “Some Morphological Types of Bacteriophages in Bovine Rumen Contents,” Applied Microbiology, Vol. 18, No. 5, 1969, pp. 942-943.
- A. E. Ritchie, I. M. Robinson and M. J. Allison, “Rumen Bacteriophage: Survey of Morphological Types,” In: P. Favard, Ed., Microscopie electronique, Societe Francaise de Microscopie Electronique, Vol. 3, Societe Francaise de Microscopie Electronique, Paris, 1970, pp. 333-334.
- A. V. Klieve and T. Bauchop, “Morphological Diversity of Ruminal Bacteriophages from Sheep and Cattle,” Applied and Environmental Microbiology, Vol. 54, No. 6, 1988, pp. 1637-1641.
- C. A. Suttle, “The Significance of Viruses to Mortality in Aquatic Microbial Communities,” Microbial Ecology, Vol. 28, No. 2, 1994, pp. 237-243. doi:10.1007/BF00166813
- K. Holmfeldt, M. Middelboe, O. Nybroe and L. Riemann, “Large Variabilities in Host Strain Susceptibility and Phage Host Range Govern Interactions between Lytic Marine Phages and Their Flavobacterium Hosts,” Applied and Environmental Microbiology, Vol. 73, No. 21, 2007, pp. 6730-6739. doi:10.1128/AEM.01399-07
- P. Hyman and S. T. Abedon, “Bacteriophage Host Range and Bacterial Resistance,” Advances in Applied Microbiology, Vol. 70, 2010, pp. 217-248. doi:10.1016/S0065-2164(10)70007-1
- G. P. Nirmal Kumar, S. Sudarson, V. D. Paul, S. Nandini, S. R. Sanjeev, S. Hariharan, S. Bharathi and S. Padmanabhan, “Use of Prophage Free Host for Achieving Homogenous Population of Bacteriophages: New findings,” Virus Research, Vol. 169, No. 1, 2012, pp. 182-187. doi:10.1016/j.virusres.2012.07.026
- M. R. J. Clokie and A. M. Kropinski, “Bacteriophages: Methods and Protocols,” 1st Edition, Humana Press, New York, 2008.
- D. Refardt, “Within-Host Competition Determines Reproductive Success of Temperate Bacteriophages,” The ISME Journal, Vol. 5, No. 9, 2011, pp. 1451-1460. doi:10.1038/ismej.2011.30
- M. M. Ijzerman and C. Hagedorn, “Improved Method for Coliphage Detection Based on β-Galactosidase Induction,” Journal of Virological Methods, Vol. 40, No. 1, 1992, pp. 1-36. doi:10.1016/0166-0934(92)90004-W
- M. D. Sobsey, “Quality of Currently Available Methodology for Monitoring Viruses in the Environment,” Environment International, Vol. 7, No. 1, 1982, pp. 39-51. doi:10.1016/0160-4120(82)90149-0
- S. J. Labrie, J. E. Samson and S. Moineau, “Bacteriophage Resistance Mechanisms,” Nature Reviews in Microbiology, Vol. 8, No. 5, 2010, pp. 317-327. doi:10.1038/nrmicro2315
- Z. Csiszovszki, Z. Buzás, S. Semsey, T. Ponyi, P. P. Papp and L. Orosz, “Imm X Immunity Region of Rhizobium Phage. 16-3: Two Overlapping Cistrons of Repressor Function,” Journal of Bacteriology, Vol. 185, No. 15, 2003, pp. 4382-4392. doi:10.1128/JB.185.15.4382-4392.2003
- F. N. Enikeeva, K. V. Severinov and M. S. Gelfand, Restriction-modification systems and bacteriophage invasion: Who wins?” Journal of Theoretical Biology, Vol. 266, No. 4, 2010, pp. 550-559. doi:10.1016/j.jtbi.2010.07.006
- S. O’Flaherty, R. P. Ross, W. Meaney, G. F. Fitzgerald, M. F. Elbreki and A. Coffey, “Potential of the Polyvalent Anti-Staphylococcus Bacteriophage K for Control of Antibiotic-Resistant Staphylococci from Hospitals,” Applied and Environmental Microbiology, Vol. 71, No. 4, 2005, pp. 1836-1842. doi:10.1128/AEM.71.4.1836-1842.2005
- D. Vybiral, M. Takáč, M. Loessner, A. Witte, U. von Ahsen and U. Blasi, “Complete Nucleotide Sequence and Molecular Characterization of Two Lytic Staphylococcus Aureus Phages: 44AHJD and P68,” FEMS Microbiology Letters, Vol. 219, No. 2, 2003, pp. 275-283. doi:10.1016/S0378-1097(03) 00028-4
- C. B. Appaiah, S. Sudarson, B. R. Anupama, S. Bharathi and S. Padmanabhan, “Staphylococcus Bacteriophage Tails with Bactericidal Properties: New Findings,” Biotechnology and Applied Biochemistry, Vol. 59, No. 6, 2012, pp. 495-502. doi:10.1002/bab.1052
- G. Mosig, and F. Eiserling, “T4 and Related Phages: Structure and Development,” In: R. Calender, Ed., The Bacteriophages, 2nd Edition, Oxford University Press, New York, 2006, pp. 1-131.
- B. Anderson, M. H. Rashid, C. Carter, G. Pasternack, C. Rajanna, T. Revazishvili, T. Dean, A. Senecal and A. Sulakvelidze, “Enumeration of Bacteriophage Particles: Comparative Analysis of the Traditional Plaque Assay and Real-Time QPCRand Nanosight-Based Assays,” Bacteriophage, Vol. 1, No. 2, 2011, pp. 86-93. doi:10.4161/bact.1.2.15456
- D. A. Scudiero, R. H. Shoemaker, K. D. Paull, A. Monks, S. Tierney, T. H. Nofziger, M. J. Currens, D. Seniff and M. R. Boyd, “Evaluation of a Soluble Tetrazolium/Formazan Assay for Cell Growth and Drug Sensitivity in Culture Using Human and Other Tumor Cell Lines,” Cancer Research, Vol. 48, No. 17, 1988, pp. 4827-4833.
- N. J. Marshall, C. J. Goodwin and S. J. Holt, “A Critical Assessment of the Use of Microculture Tetrazolium Assays to Measure Cell Growth and Function,” Growth Regulation, Vol. 5, No. 2, 1995, pp. 69-84.
- M. G. Stevens and S. C. Olsen, “Comparative Analysis of Using MTT and XTT in Colorimetric Assays for Quantitating Bovine Neutrophil Bactericidal Activity,” Journal of Immunological Methods, Vol. 157, No. 1-2, 1993, pp. 225-231. doi:10.1016/0022-1759(93)90091-K
- A. Sulakvelidze, Z. Alavidze and G. J. Morris Jr., “Bacteriophage Therapy,” Antimicrobial Agents and Chemotherapy, Vol. 45, No. 3, 2001, pp. 649-659. doi:10.1128/AAC.45.3.649-659.2001
- V. A. Fischetti, “Bacteriophage Endolysins: A Novel Anti-Infective to Control Gram-Positive Pathogens,” International Journal of Medical Microbiology, Vol. 300, No. 6, 2010, pp. 357-362. doi:10.1016/j.ijmm.2010.04.002
- V. D. Paul, S. S. Rajagopalan, S. Sundarrajan, S. E. George, J. Y. Asrani, R. Pillai, R. Chikkamadaiah, M. Durgaiah, B. Sriram and S. Padmanabhan, “A Novel Bacteriophage Tail-Associated Muralytic Enzyme (TAME) from Phage K and Its Development into a Potent, Antitaphylococcal Protein,” BMC Microbiology, Vol. 11, 2011, p. 226. doi:10.1186/1471-2180-11-226
- S. E. George, R. Chikkamadaiah, M. Durgaiah, A. A. Joshi, U. P. Thankappan, S. N. adhusudhana and B. Sriram, “Biochemical Characterization and Evaluation of Cytotoxicity of Anti Staphylococcal Chimeric Protein P128,” BMC Research Notes, Vol. 5, 2012, p. 280. doi:10.1186/1756-0500-5-280
- A. A. Vipra, S. N. Desai, P. Roy, R. Patil, J. M. Raj, N. Narasimhaswamy, V. D. Paul, R. Chikkamadaiah and B. Sriram, “Anti-Staphylococcal Activity of Bacteriophage Derived Chimeric Protein P128,” BMC Microbiology, Vol. 12, 2012, p. 41.doi:10.1186/1471-2180-12-41
- L. Gravitz, “Turning a New Phage,” Nature Medicine, Vol. 18, 2012, pp. 1318-1320. doi:10.1038/nm0912-1318
- F. Schumacher-Perdreau, G. Pulverer and K. H. Schleifer, “The Phage Adsorption Test: A Simple Method for Differentiation between Staphylococci and Micrococci,” Journal of Infectious Diseases, Vol. 138, No. 3, 1978, pp. 392-395. doi:10.1093/infdis/138.3.392
- K. Watanabe and S. Takesue, “Use of L-Rhamnose to Study Irreversible Adsorption of Bacteriophage PL-1 to a Strain of Lactobacillus casei,” Journal of General Virology, Vol. 28, No. 1, 1975, pp. 29-35. doi:10.1099/0022-1317-28-1-29
- I. Rabbani, U. Radoja, S. Ray, A. Selim and C. Weston, “The Dynamics of Bacteriophage T4 Binding to Escherichia coli,” Journal of Experimental Microbiology and Immunology, Vol. 5, 2004, pp. 61-64.
- I. Katsura, “Tail Assembly and Injection,” In: R. W. Hendrix, J. W. Roberts, F. W. Stahl and R. A. Weisberg, Eds., Lambda II, Cold Spring Harbor Laboratory Press, New York, 1983, pp. 331-346.
- E. Goldberg, L. Grinius and L. Letellier, “Recognition, Attachment, and Injection,” In: J. W. Drake, K. N. Kreuzer, G. Mosig, D. H. Hall and F. A. Eiserling, Eds., Molecular Biology of Bacteriophage T4, American Society for Microbiology, Washington DC, 1994, pp. 347-356.
- S. T. Abedon, “Lysis from Without,” Bacteriophage, Vol. 1, No. 1, 2011, pp. 46-49. doi;10.4161/bact.1.1.13980
- L. M. Kasman, A. Kasman, C. Westwater, J. Dolan, M. G. Schmidt and J. S. Norris, “Overcoming the Phage Replication Threshold: A Mathematical Model with Implications for Phage Therapy,” Journal of Virology, Vol. 76, No. 1, 2002, pp. 5557-5564.
- L. Rodriguez-Rubio, B. Martinez, D. M. Donovan, A. Rodriguez and P. Garcia, “Bacteriophage Virion-Associated Peptidoglycan Hydrolases: Potential New Enzybiotics,” Critical Reviews in Microbiology, 2012, pp. 1-8. doi;10.3109/1040841X.2012.723675
- M. L. Tortorello, K. M. Trotter, S. M. Angelos, R. A. Ledford and G. M. Dunny, “Microtiter Plate Assays for the Measurement of Phage Adsorption and Infection in Lactococcus and Enterococcus,” Analytical Biochemistry, Vol. 192, No. 2, 1991, pp. 362-366. doi;10.1016/0003-2697(91)90549-9
- P. Roslev and G. M. King, “Application of a Tetrazolium Salt with a Water-Soluble Formazan as an Indicator of Viability in Respiring Bacteria,” Applied and Environmental Microbiology, Vol. 59, No. 9, 1993, pp. 2891- 2896.
- R. Zimmermann, R. Iturriaga and J. Becker-Birck, “Simultaneous Determination of the Total Number of Aquatic Bacteria and the Number Thereof Involved in Respiration,” Applied and Environmental Microbiology, Vol. 36, No. 6, 1978, pp. 926-935.
- T. T. Packard, “Measurement of Electron Transport Activity of Microplankton,” In: H. Jannasch and P. J. Leb Williams, Eds., Advances in Aquatic Microbiology, Vol. 3, Academic Press, London, 1985, pp. 207-261.
- H. G. Von Bielig, G. A. Kausche and H. Haardick, “Uber den Nachweiß von Reduktion in Bakterian,” Zeitschrift für Naturforschung, Vol. 46, 1949, pp. 80-91.
- P. Dufour and M. Colon, “The Tetrazolium Reduction Method for Assessing the Viability of Individual Bacterial Cells in Aquatic Environments: Improvements, Performance and Applications,” Hydrobiologia, Vol. 232, No. 3, 1992, pp. 211-218. doi;10.1007/BF00013706
NOTES
*MIC of bacteriophages.
#Corresponding author.