Journal of Sustainable Bioenergy Systems
Vol.4 No.1(2014), Article ID:44252,12 pages DOI:10.4236/jsbs.2014.41008
Thermogravimetric Analysis of Swine Manure Solids Obtained from Farrowing, and Growing-Finishing Farms
Mahmoud Sharara, Samy Sadaka*
Department of Biological and Agricultural Engineering, University of Arkansas Division of Agriculture, Little Rock, USA
Email: *ssadaka@uaex.edu
Copyright © 2014 by authors and Scientific Research Publishing Inc.
This work is licensed under the Creative Commons Attribution International License (CC BY).
http://creativecommons.org/licenses/by/4.0/


Received 15 January 2014; revised 13 February 2014; accepted 3 March 2014
ABSTRACT
The modern trend of increasing the number of pigs at production sites led to a noticeable surplus of manure. Separation of manure solids provides an avenue of their utility via thermochemical conversion techniques. Therefore, the goal of this paper was to assess the physical and thermal properties of solid separated swine manure obtained from two different farms, i.e., farrowing, and growing-finishing, and to determine their pyrolysis kinetic parameters. Swine manure solids were dried and milled prior to assessing their properties. Differential and integral isoconversional methods (Friedman, and Flynn-Wall-Ozawa) were used to determine the apparent activation energy as a function of the conversion ratio. Significant differences were observed in the proximate, ultimate composition between both manure types. The higher heating value (HHV) for the manure solids from farrowing, and growing-finishing farms reached 16.6 MJ/kg and 19.4 MJ/kg, respectively. The apparent activation energy computed using Friedman and FWO methods increased with the increase in the degree of conversion. Between 10% and 40% degrees of conversion, the average activation energies, using Friedman method, were103 and 116 kJ/mol for the farrowing and growing-finishing manure solids, respectively. On the other hand, the same activation energies, calculated from FWO method, were 98 and 104 kJ/mol, for solid manure obtained from farrowing and growing-finishing farms, respectively. The findings in this study will assist in the effort to optimize thermochemical conversion processes to accommodate swine waste. This could, in turn, minimize swine production impacts on the surrounding ecologies and provide sustainable energy and biochar streams.
Keywords:Manure Solids; Thermogravimetric Analysis; Pyrolysis; Isoconversional Methods

1. Introduction
Swine production is increasingly becoming the world’s largest meat production enterprise. Global consumption of pork meat, currently at 110 million metric tons per year, exceeds beef and chicken meat consumption, 67 and 104 million metric tons, respectively [1] . The latest inventory puts the total number of US hogs at 68.3 million head, 62.5 million of which are market hogs and 5.8 million head are breeding hogs [2] . Most swine production in the US, however, is clustered around feed production, i.e., corn growing regions, in few Midwestern states. Moreover, intensive livestock production replaced conventioJnal farming which lead to increased productivity and a drop in the number of livestock operations [3] . Unintended consequence of these changes, however, is the large volumes of generated manure, which surpass the assimilative capacity of nearby fields. Using an estimate of daily manure productivity for growing-finishing hogs, i.e., 4.54 kg manure per head [4] , shows that the inventory of market hogs alone produce 0.28 million metric tons of manure daily. Separating the nutrient-rich manure solids can offer an opportunity to utilize or transport the manure nutrients in a sustainable, environmentally safe manner.
In this process, the manure slurry is separated into a solids-rich fraction (containing 80% of the total solids) and a low-solids effluent, i.e., low in nutrients, which can be safely recycled to clean the stalls, or applied to nearby fields. Separation systems include stationary and vibrating screens, belt presses, and screw presses [5] . The separated solids were shown to be a more suitable feedstock for anaerobic digestion than raw, diluted slurries [6] . Alternatively, the separated solids can be further dried and/or blended with coal or wood and converted to bioenergy sources via thermochemical processes [7] [8] .
Thermochemical processes offer rapid disposal capabilities while generating a continuous stream of heat and/or gaseous and liquid fuels. The solids separation method applied was found to influence the energy content of the manure solids [9] . Mechanically separated solids were shown to be more favorable, in terms of energy content, when compared to chemically separated solids. The high energy density of swine manure, 17.9 to 19.3 MJ/kg (dry-basis),compared to dry poultry litter, 12.0 to 14.8 MJ/kg [10] , or dry cattle manures: 6.3 to 16.6 MJ/kg [11] , makes it a more suitable candidate for energy conversion. Despite its high energy density, however, swine manure solids contain ash minerals, typically between 10% and 20% of the dry weight, more than other biomass feedstocks with similar calorific value, i.e., wood or switchgrass. These ash residues were shown to be problematic to thermochemical conversion, especially at elevated temperatures, since they form oxides with low-melting temperatures that cause slagging and agglomeration [12] . In poultry litter and pinewood-bedding mixtures, separation of the fine particles was found to improve the litter fuel properties [13] .
Despite the variety of swine manure handling and separation strategies, only few studies looked into the decomposition kinetics of swine manure solids [14] [15] . Studying decomposition kinetics via thermogravimetric analysis offers insight into the behavior of the feedstock under thermochemical conversion conditions. Several methods, i.e., model-fitting methods and isoconversional methods were developed to formulate the mathematical expression describing feedstock decomposition. Isoconversional methods (model-free methods) were shown to be more robust and reliable compared to model-fitting methods [16] . Oxidation kinetics for swine manure solids was determined using isoconversional methods, i.e., Vyazovkin method, and Flynn-Wall-Ozawa method [15] . No studies were found in the literature that used isoconversional methods to determine the pyrolysis kinetics of swine manure solids. The goal of this study was to determine the pyrolysis kinetics of swine manure solids obtained from two different farms using two different isoconversional methods.
2. Materials and Methods
2.1. Swine Manure Collection
Swine manure solids were collected from two different hog farms in Arkansas. The first is a commercial breeding farm (farrowing) (2450 heads) in Yell County, whereas the second is a growing-finishing farm (818 heads) in Washington County, which is part of the Dale Bumpers College of Agricultural, Food & Life Sciences at the University of Arkansas. The farrowing farm employs a two-step solids separation system, i.e., a mechanical screw press to separate the larger solids, then a chemical separation basin in which flocculants are used to facilitate aggregation and sedimentation of finer solids. This separation system was installed in order to reduce the phosphorous loading of the aqueous effluent. Such measures are typical in regions where the soil phosphorous levels are elevated. The surplus manure phosphorous, therefore, has to be moved off-farm. In this study, the manure studied was sampled from the solids separated in the first step, i.e., mechanically separated solids. In the growing-finishing farm, the effluent from the hog houses is pumped directly to a settling pond before it collects in a storage lagoon. No mechanical or chemical separation is practiced in this farm. For the purpose of this study, the solids were collected directly from the settling pond using a sample collection bag. The sampling bag is made from fine-pored fabric fitted on a triangular metal frame. The settled solids were sampled from different parts of the pond, and then later mixed, to ensure representative sampling.
2.2. Swine Manure Collection
The swine manure solids were first oven-dried (72˚C for 48 hours) to prepare the feedstock for subsequent stages: size-reduction (milling), in addition to the various tests and analyses. The dried solids were ground using a cutting mill (Thomas Wiley Mill No.2, Swedesboro, NJ) fitted with a 1-mm (1000 micron) mesh size screen.
2.3. Swine Manure Characterization
All tests were done on triplicates except for the chemical composition, which was determined in one composite sample from each manure source in an analytical laboratory (Huffman laboratories, 4630 Indiana Street Golden, CO). The ash content was determined as the percentage of remaining weight after completely burning off dry samples at 750˚C [17] whereas the volatile matter content is the weight loss lost after holding the sample at 800˚C in an oxygen-free environment for 10 minutes. The calorific values were determined using oxygen bomb calorimetry (Parr instruments, Model 1341) according to standard [18] .
2.4. Thermogravimetric Analyses
A programmable thermogravimetric analyzer (Model TGA 4000, PerkinElmer, Inc. Waltham, MA) was used in this study to examine the decomposition behavior of the manure solids from both farms. Specifications of this analyzer are shown in Table 1. Before running the thermogravimetric analyses, weight and temperature calibrations were conducted according to the manufacturer instructions. Each manure source was analyzed at three different heating rates: 20, 30 and 40˚C/min with nitrogen as the purge gas (30 ml/min) in order to simulate pyrolysis conditions. The thermogravimetric analysis program ran according to the following steps:
1) Heating from 30˚C to 105˚C in a nitrogen environment 2) Isothermal stage at a 105˚C for 10 minutes 3) Heating from 105˚C to 800˚C at the specified heating rate Isothermal stage at 800˚C in an oxygen environment for 10 minutes.
Step 2 was added to ensure samples were completely dry before pyrolysis. In each analysis, temperature and sample weight were continuously recorded at 1-second intervals. TGA sample size was kept at approximately 20 ± 2 mg (mg = 10−3 g) to avoid introducing diffusion-based variability. After each analysis, the sample holder (crucible) was thoroughly cleaned with methanol then completely burnt (purging oxygen at 800˚C for 10 minutes) to eliminate any residues. The following section outlines the theory behind the methods used to extract the pyrolysis kinetics.

Table 1. Specifications of thermogravimetric analyzer used.
2.5. Theory
The degree of conversion (α) is defined as follows:
 (1)
(1)
Where Wo, Wt, and W∞ are the initial sample weight, the sample weight at time t, and the final sample weight, respectively. The rate of conversion is expressed as follows:
 (2)
(2)
Where k is the decomposition rate constant, and  is the reaction model, which expresses the dependence of conversion rate on the conversion ratio. Using the Arrhenius formulation, the rate constant can be expanded:
 (3)
(3)
Where A, Ea, and R are the frequency factor (pre-exponential coefficient), the activation energy, and the universal gas constant, respectively. Under non-isothermal conditions, where the heating rate is known, the sample temperature can be related to time using the following relation:
 (4)
(4)
Where To is the initial temperature, and β is the heating rate. Using Equation (4), the conversion rate can be transformed into a temperature-derivative:
 (5)
(5)
Rearranging Equation (5) to separate the variables α and T, then integrating:
 (6)
(6)
Since , then
 (7)
(7)
Thermogravimetric analysis methods target the determination of the kinetics triplicate, i.e., A, Ea, and f(α) or g(α). The methods that use Equation (5) are referred to as differential methods whereas those using Equation (7) are known as integral methods [19] . Some studies reported the use of a single analysis, one thermogravimetric experiment, to derive the reaction kinetics. A prerequisite to using this approach (model-fitting methods) is assuming a reaction model: f(α), or g(α) in order to extract the activation energy, and the frequency factor. This approach was found to produce erroneous activation energy values that are highly dependent on the assumed reaction model [20] . An alternative approach is the use of multiple thermogravimetric analyses performed at different heating rates, i.e., isoconversional methods, to determine the kinetic parameters.
2.6. Isoconversional Methods
These methods are also known as “model-free methods” because they bypass the need for a specific reaction model in order to compute the decomposition parameters. The underlying basis in these methods is that, at any given conversion ratio (α), the rate of conversion is a function of the temperature alone. Therefore, under isoconversional methods, the activation energy is in fact a range of values that are functions of corresponding conversion ratios (α) [21] . Two different methods were used to analyze the thermogravimetric data, one is differential, i.e., Friedman method [22] while the other is integral, Ozawa-Flynn-Wall method [23] [24] . Details of each method are shown below:
2.7. Friedman Method
Starting with a re-arrangement of Equation (6):
 (8)
(8)
Then, taking the natural logarithm for both sides of Equation (8) yields
 (9)
(9)
For every analysis performed at a given heating rate, a set of l (β(dα/dT)) and 1/T pairs that correspond to different α values, i.e., α = 0.05, 0.10… 0.85 was collected. Then, for manure type, three data points, i.e., ln(β(dα/dT)) and 1/T pairs, representing the same degree of conversion (α) under the studied heating rates were plotted and fitted to a straight line. The result is a family of straight lines, for each manure type, that represent the kinetics of decomposition at different degrees of conversion. The slope of each straight line, (−Ea/R), was used to compute the apparent activation energy Ea, while each intercept, ln(A, f (α)) was a combined expression of frequency factor A and the reaction model f(α) at each degree of conversion.
The raw data of each analysis, i.e., sample weights and temperatures, was retrieved through the equipment software (Pyris™ Software-Version 11.0.0.0449, Perkin Elmer, Inc. Waltham, MA) then imported into MATLAB® R2013b (MathWorks, Inc. Natick, MA) where the differentiation, data filtering, and sampling was performed. Plotting ln(β(dα/dT)) and 1/T pairs, and the determination of slope and intercept were carried out using Microsoft® Excel® 2010 (Microsoft Corp., Redmond, WA).
2.8. Ozawa-Flynn-Wall Method
In this method, Equation (7) was integrated then the Doyle’s approximation [25] was applied to the temperature integral. The resulting equation is:
 (10)
(10)
Alternately,
 (11)
(11)
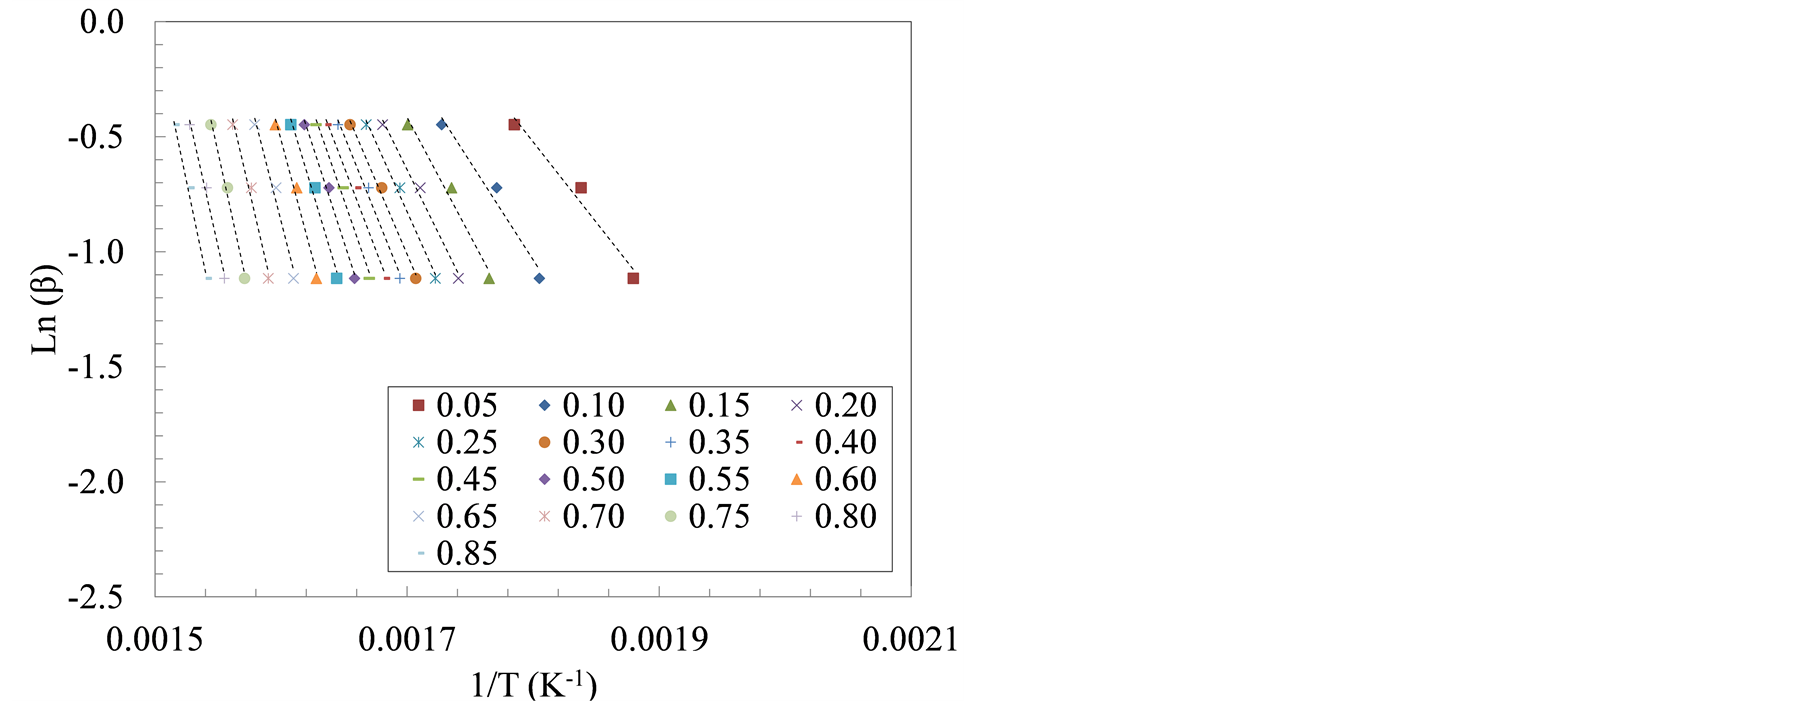
At each degree of conversion, i.e., α = 0.05, 0.10… 0.85, the three pairs of lnβ and 1/T data points, obtained from three heating rates, were plotted and fitted to a straight line. The slope, (−1.052(Ea/R)), represents the apparent activation energy term, while the intercept is a coupled expression of the reaction model in the integral form, g(α), the apparent activation energy Ea, and the frequency factor, A. The same software tools were used to analyze the thermogravimetric data for this method.
3. Results and Discussions
3.1. Proximate and Ultimate Analyses
Table 2 lists the proximate and ultimate analyses of the two types of swine manure solids. The volatile matter in the growing-finishing manure solids were noticeably higher, 7.9% more, than in the farrowing farm solids. The ash content in both farms was slightly below values reported in the literature, i.e., 18% to 25% dry basis [7] but close to reported ash content under mechanical separation, i.e., 9% [9] .
The nitrogen content in the farrowing manure was more than 6 times that in the growing-finishing manure. This elevated nitrogen content, 12%, could be explained by the high amounts of animal hair observable in the solids recovered after screw press separation. Keratin, the main ingredient of animal hair, is a polymer of
Table 2. Characteristics of swine manure solids by source.
*Dry, weight basis; **By difference.
various amino acids. The percentage of nitrogen in amino acids typically varies between 13.4% and 19.3%, by weight, based on the type of amino acid [26] . Screw press separators are generally known to be more effective in separating out larger solids from the manure slurry [5] , which explains the increased amount of animal hair in the mechanically separated solids. On the other hand, the nitrogen content of growing-finishing manure solids, 1.8% by weight, was slightly below the reported values of nitrogen content in manure solids, i.e., between 2% to 5% by weight. No animal hair was observed in the solids collected from the growing-finishing farm. Carbon and hydrogen contents in growing-finishing manure solids were higher than that of farrowing manure solids by 2.6 and 1.3 points, respectively. Both manure solids, however, exhibited levels of carbon comparable to reported values in the literature.
The calorific content of manure solids collected from the growing-finishing farm was noticeably higher than the farrowing farm manure solids. This difference could be attributed to the differences in carbon and hydrogen contents between manure types. A correlation to predict biomass calorific value using the elemental composition [27] was implemented using the elemental composition for both farms listed in Table 2. The predicted heating value for the growing-finishing and the farrowing manure solids were 18.9 MJ/kg, and 16.5 MJ/kg, respectively. The presence of keratin in the farrowing farm manure solids might be responsible for the noticeably low calorific value observed.
3.2. Thermogravimetric Analysis
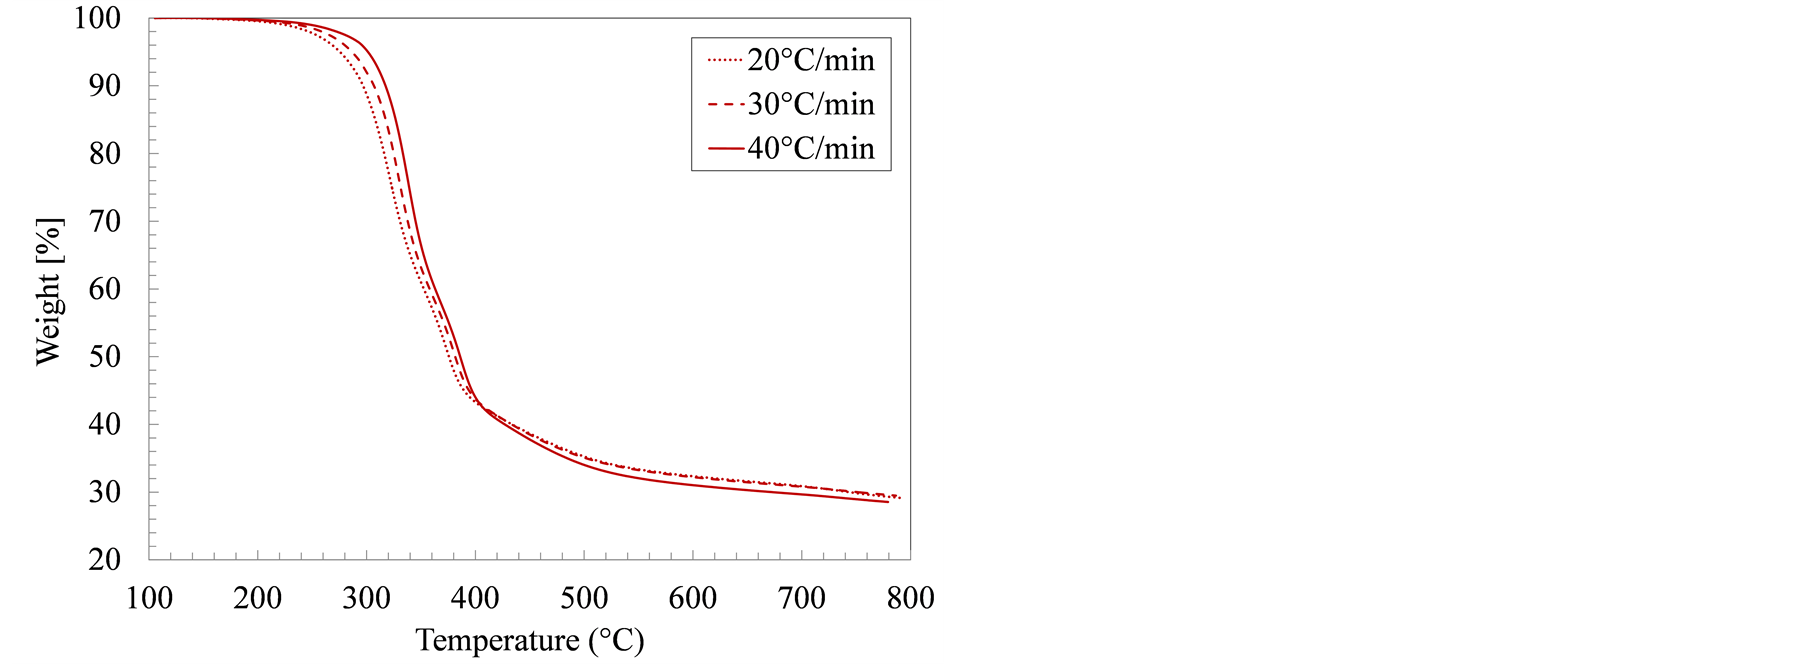
Figure 1 details the weight loss profiles for manure solids from both farms, in an inert atmosphere, as influenced by sample temperature and heating rate. The focus in this study was pyrolytic decomposition, which takes place above 100˚C. As a result, the drying step was not includedin the kinetic analysis. Increasing the sampleheating rate shifted the decomposition temperatures higher, which is in agreement with most thermogravimetry studies. The weight loss in all samples appeared to proceed in three consecutive steps. In the first step, which took place between 100˚C and 250˚C, the sample mostly heated up and only marginal weight loss occurred. The second stage (280˚C - 420˚C) is the active pyrolysis as the easily degradable organic components are devolatilized in sequence. The final stage, known as the passive pyrolysis stage, from 420˚C to 800˚C, is a slow-decomposition phase in which the remaining sample that was carbonized into stable and complex organic species in the active pyrolysis step, partially devolatilized. At the end of the pyrolysis test, the remaining weight represented the combined ash and fixed carbon contents.
The weight loss in the growing-finishing manure solids proceeded faster than in the farrowing farm solids as evidenced by the temperatures at which the sample weight reached 50% of the starting weight, 381˚C and 427˚C, respectively. In all samples, most of the weight loss occurred between 280˚C and 380˚C, the temperature range typically associated with both hemicellulose (220˚C - 315˚C) and cellulose (315˚C - 400˚C) decomposition [28] . From a compositional standpoint, however, swine manure solids contain less structural carbohydrates (cellulose) than lignocellulosic materials such as wood or grasses. In addition, swine manure solids contain higher amounts of protein and lipids [29] . These structural differences yielded decomposition temperatures and decomposition rates that are different from those observed in thermogravimetric tests of typical biomass.
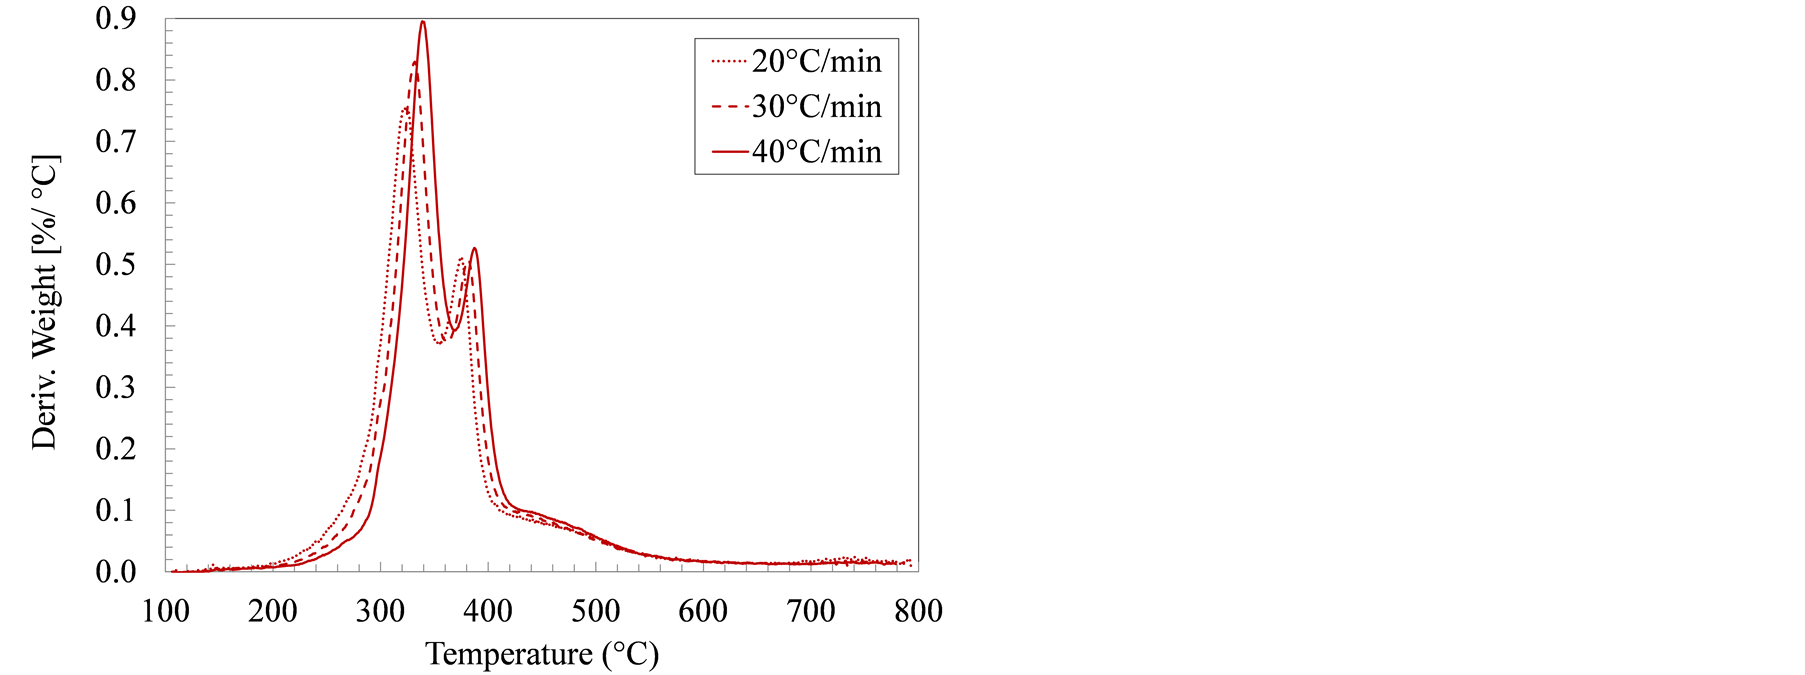
Another point of difference is the ratio of cellulose to hemicellulose in wood and grasses versus that in manure solids, and how this difference influenced decomposition rate curves. In wood and cellulosic material weight-loss derivative curves, one prominent peak is usually observed which corresponds to cellulose decomposition. The cellulose peak is usually preceded by a smaller unseparated peak representing hemicellulose decomposition (typically referred to as the hemicellulose shoulder). The cellulose-to-hemicellulose ratios in wood, typically around 1.56 [30] , confirm the DTA observations. In swine manure solids, however, cellulose/hemicellulose ratios were much lower, reportedly ranged between 0.25 and 0.81 depending on the manure collection and solids separation strategy [31] . In all DTA curves (Figure 2), two overlapping peaks were noticeable between 300˚C and 400˚C. In the growing-finishing farm samples, the height of the first peak was significantly more than the second peak. This first peak is attributable to hemicellulose decomposition as well as the decomposition of both protein (keratin) and lipids [32] [33] . In the farrowing farm manure solids, the maximum decomposition
 (a)
(a)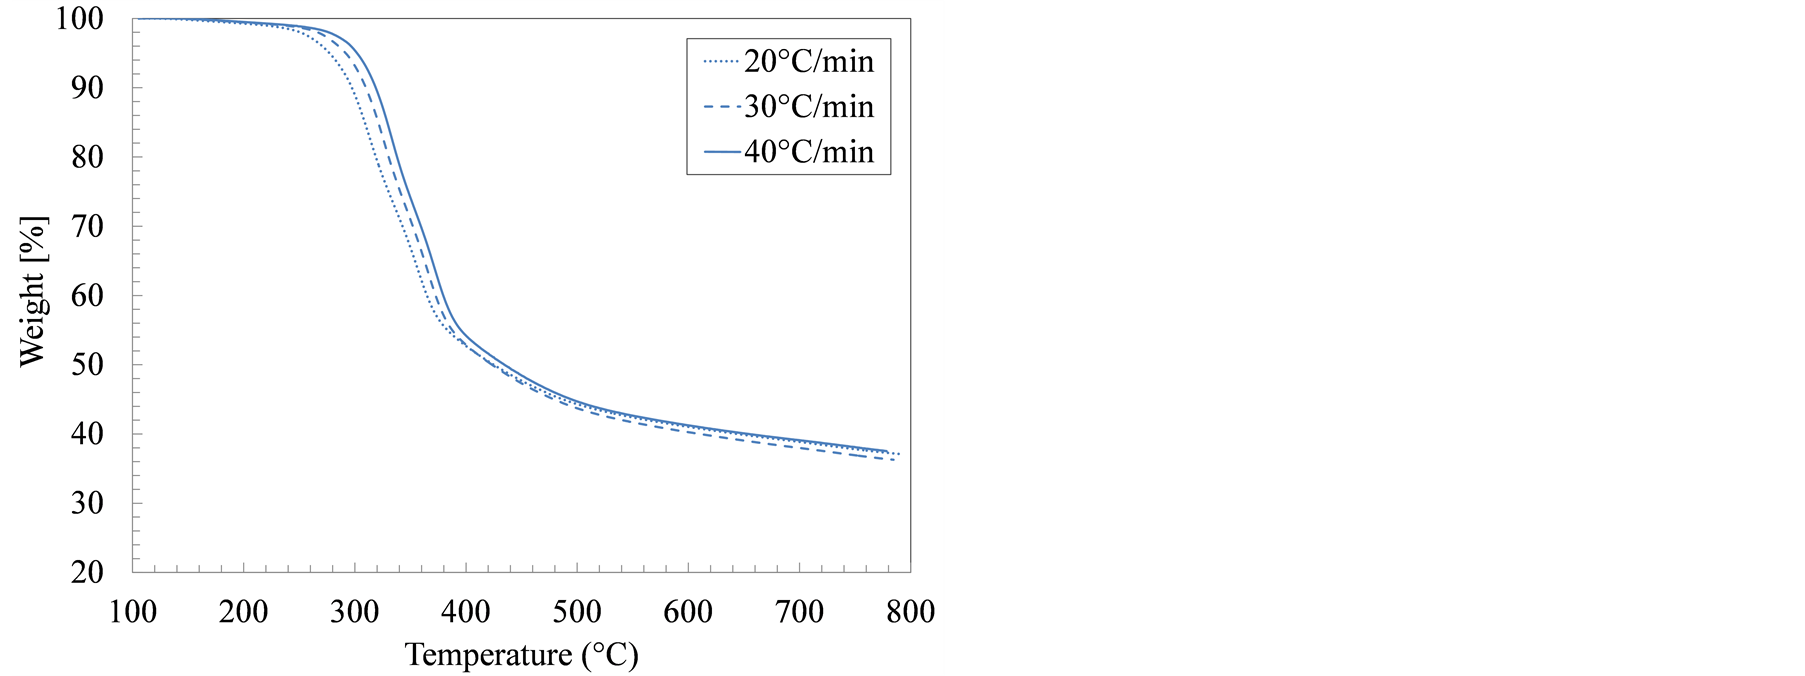 (b)
(b)
Figure 1. Weight loss during thermogravimetric analysis (TGA) for swine manure solids from (a) Farrowing farm; and (b) Growing-finishing farm in nitrogen environment.
 (a)
(a)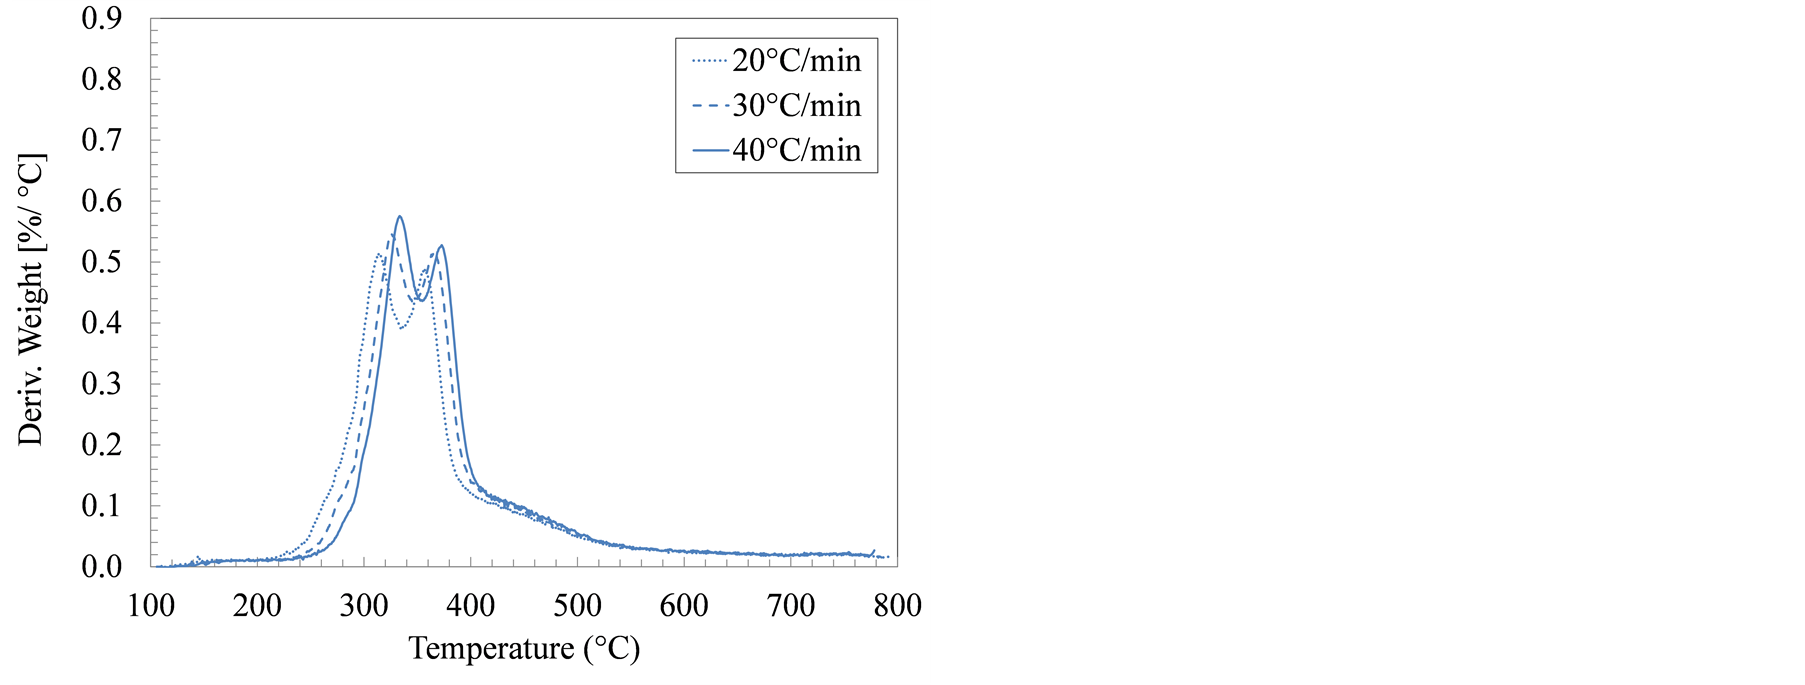 (b)
(b)
Figure 2. Derivative of thermogravimetric analysis (DTA) curves for manure solids from (a) Farrowing farm; and (b) Growing-finishing farm in nitrogen environment.
rate occurred between 318˚C and 335˚C, a temperature range associated with the hemicellulose and keratin decomposition. The maximum decomposition rates in the manure solids from the farrowing and the growing-finishing farms are 0.55% and 0.83% ˚C−1, respectively. These distinct differences in the DTA curves for swine manure solids from different farms further confirm the earlier observations that various compositional ingredients: starch, keratin, lipids, and cellulose are not uniform. These observations can help in customizing the feedstock to suit the thermochemical conversion conditions.
3.3. Pyrolysis Kinetics
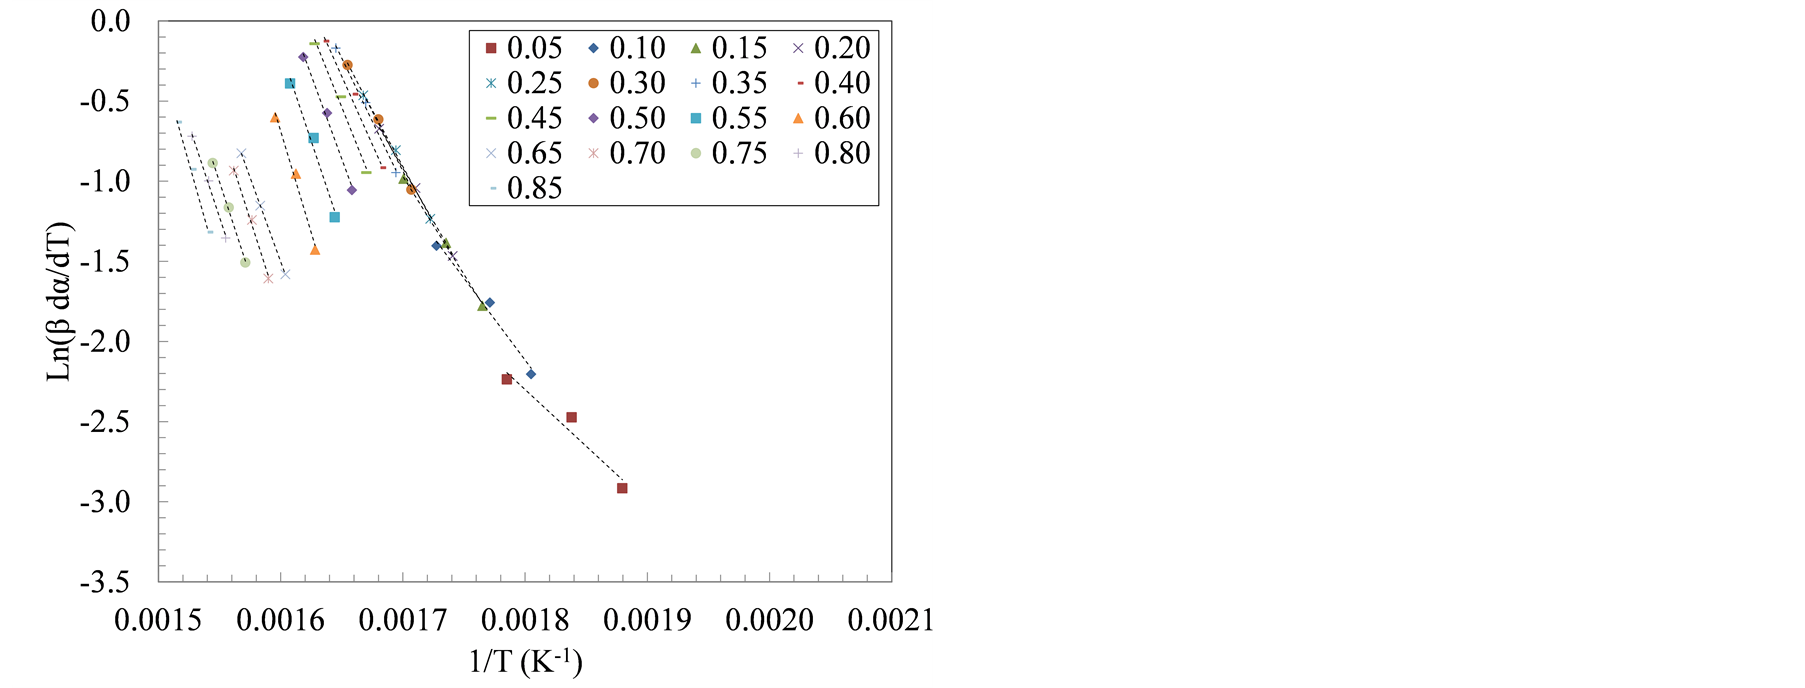
Decomposition kinetics during active pyrolysis stage (T ≤ 420˚C) were determined using two isoconversional methods, i.e., Friedman and Flynn-Wall-Ozawa (FWO) at degrees of conversion (α) ranging from 0.05 to 0.85. The isoconversional lines used in both methods are shown in Figure 3. The slopes of these lines, (−Ea/R) in the Friedman method and −1.052 (Ea/R) in the FWO method, were used to extract the apparent activation energy (Ea) as shown in Tables 3 and 4.
Figure 3 shows the transition in the slopes of isoconversional lines that corresponded to the sequential devolatilization of sample components using Friedman method. The apparent activation energy computed using Friedman and FWO methods increased with the increase in the degree of conversion. Between 10% and 40% degrees of conversion, the average activation energy, using Friedman method, was 103 kJ/mol and 116 kJ/mol for the farrowing and growing-finishing manure solids, respectively. These values represent activation energies associated with the first decomposition peak (hemicellulose, and lipids pyrolysis). On the other hand, the average apparent activation energies during the cellulose decomposition, taken to be the weight loss between α = 60% and 80%, was 177 and 199 kJ/mol for the farrowing and the growing-finishing farms, respectively.
Similarly, the slopes of the isoconversional lines, Figure 4, show the apparent activation energies using FWO method at the same degrees of conversion. The average apparent activation energies of manure solids obtained from farrowing farm reached 98 kJ/mol between α = 10% and 40%. Whereas the growing-finishing manure solids had an average apparent activation energy of 104 kJ/mol. Similar to the observations in Friedman method, average apparent activation energies using FWO method corresponding to the second decomposition stage (α = 60% - 80%), increased to 173 kJ/mol for the farrowing manure solids, and 188 kJ/mol in the growing-finishing manure solids. These observations are similar to findings in other studies where average activation energies for hemicellulose and cellulose pyrolysis, using FWO and Friedman methods, were found to be 110 kJ/ mol and 185 kJ/mol, respectively [34] . Similarly, Otero et al. [15] reported activation energies between 129 and 213 kJ/mol during the pyrolysis of raw and digested cattle manure while using FWO method. In another pyrolysis study, the average activation energy of the microalgae Dunaliella tertiolecta using Flynn-Wall-Ozawa method was reported to be 146.4 kJ/mol [35] .
Analysis of the correlations between the activation energies computed using both methods showed that the
 (a)
(a)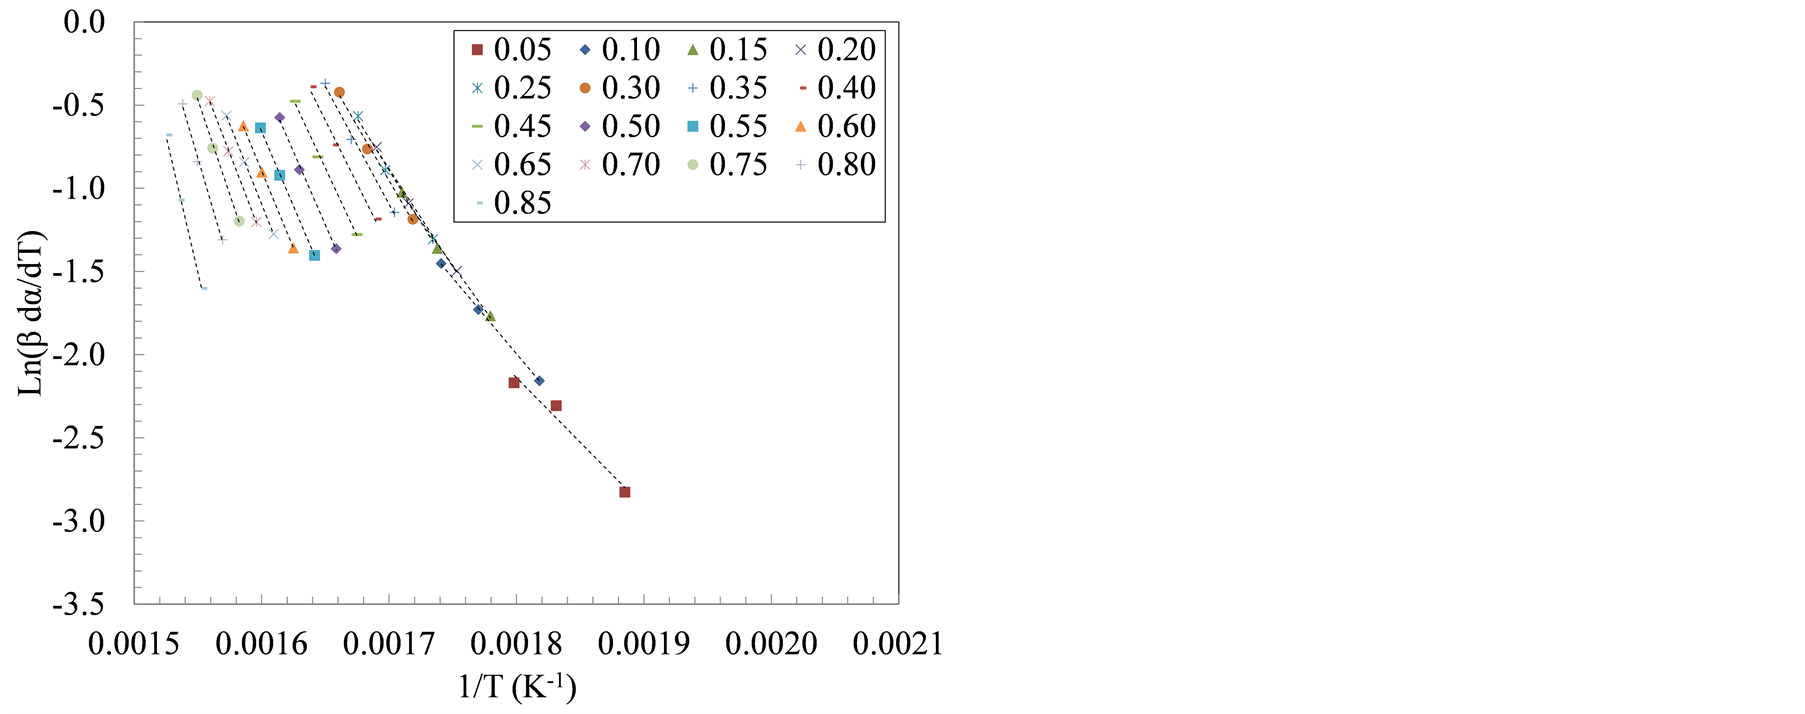 (b)
(b)
Figure 3. Plots of ln(β*dα/dT) versus 1/T at three heating rate: 20, 30 and 40˚C/min for manure solids from (a) Farrowing farm; and (b) Growing-finishing farm.
Table 3. The activation energies (Ea, kJ∙mol−1) using Friedman method at different degrees of conversion (α) for swine manure solids by source.
Table 4. The activation energies (Ea, kJ∙mol−1) using Flynn-Wall-Ozawa method at different degrees of conversion (α) for swine manure solids by source.
 (a)
(a)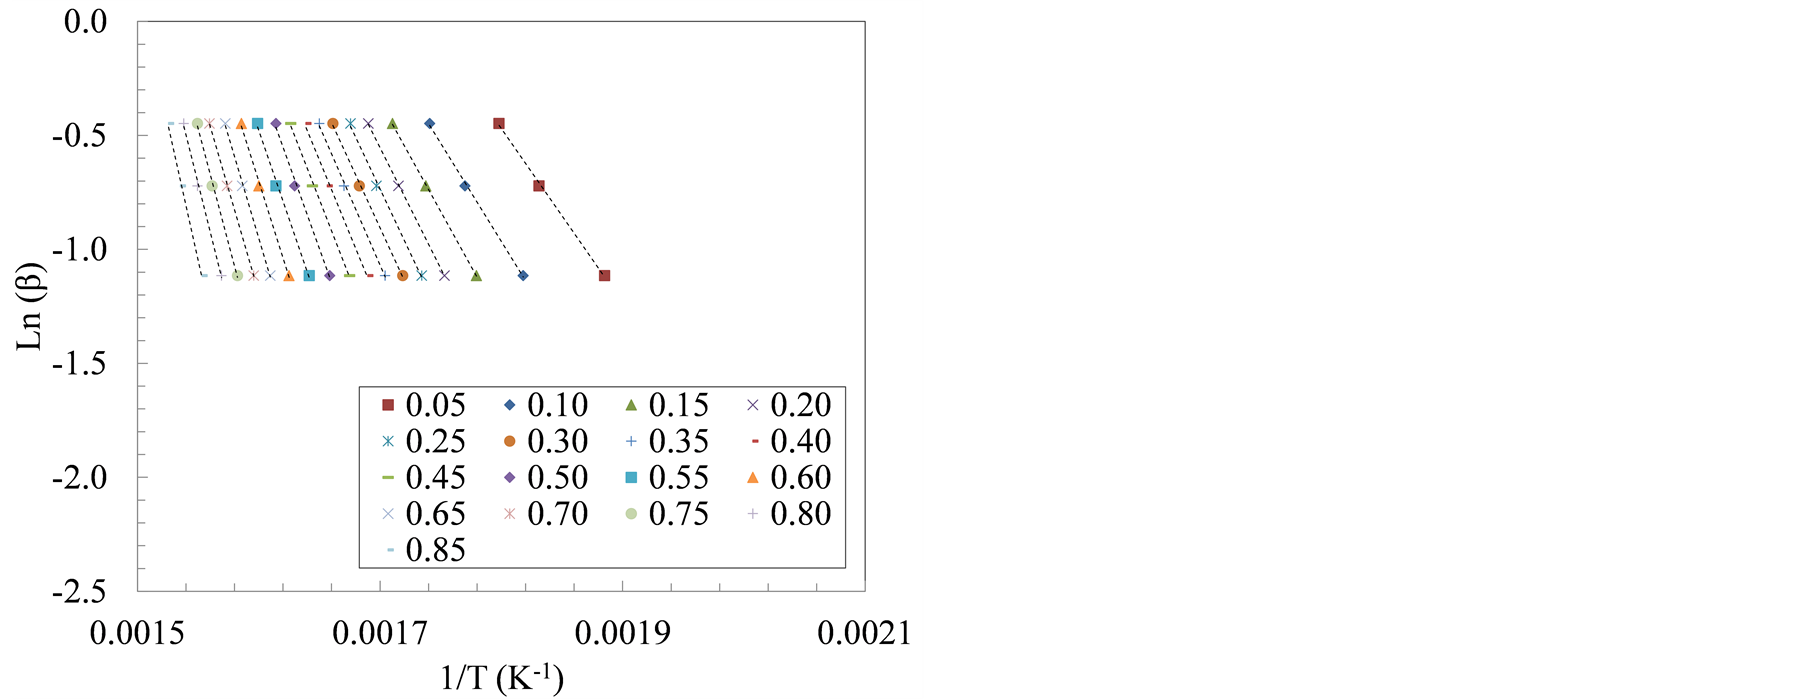 (b)
(b)
Figure 4. The plots of ln(β) versus 1/T at three heating rate: 20, 30 and 40˚C/min for manure solids from (a) Farrowing farm; and (b) Growing-finishing farm.
values of the FWO activation energy were around 5% lower than those calculated using the Friedman method. However, the activation energies calculated using both methods were correlated for each swine manuretype. It is worth noting when comparing both methods that while the differential methods, Friedman method in this case, provide actual values of the activation parameter, the integral isoconversional methods, e.g., Flynn-Wall-Ozawa, provide averaged values of that parameter [36] . Correlating these values, however, provide a useful approach to predict the actual values of the activation energy from the averages, or vice versa.
4. Conclusions
Swine manure solids from two farms, i.e., farrowing and growing-finishing, were successfully characterized. The main findings are:
1) The type of farm influenced the composition and the higher heating value (HHV) of swine manure solids.
2) Keratin in the manure solids, from animal hair, increased the nitrogen content and reduced the HHV.
3) Compositional differences between the two swine manure types translated to variability in the weight loss rates, and the shape of decomposition peaks.
4) The activation energy during pyrolysis of swine manure solids (T ≤ 420˚C) showed a gradual increase corresponding with the devolatilization of the sample ingredients (hemicellulose, cellulose, in addition to the keratin and lipid).
5) These findings shed more light on the behavior of swine manure solids under thermochemical conversion conditions.
Acknowledgements
This manuscript is a part of a USDA-NIFA funded project titled “Integrated Resource Management Tool to Mitigate the Carbon Footprint of Swine Production in the US”. The authors would like to thank the funding agency for their continued support.
References
- McGlone, J. (2013) The Future of Pork Production in the World: Towards Sustainable, Welfare-Positive Systems. Animals, 3, 401-415.
- NASS-USDA (2013) Quarterly Hogs and Pigs.
- Tilman, D., Cassman, K., Matson, P., Naylor, R. and Polasky, S. (2002) Agricultural Sustainability and Intensive Production Practices. Nature, 418, 671-677. http://dx.doi.org/10.1038/nature01014
- American Society of Agricultural and Biological Engineers (ASABE) (2005) Standard D3843.2—Manure Production and Characteristics.
- Burton, C. (2007) The Potential Contribution of Separation Technologies to the Management of Livestock Manure. Livestock Science, 112, 208-216. http://dx.doi.org/10.1016/j.livsci.2007.09.004
- Møller, H., Hansen, J. and Sørensen, C. (2007) Nutrient Recovery by Solid-Liquid Separation and Methane Productivity of Solids. Transactions of ASABE, 50, 193-200. http://dx.doi.org/10.13031/2013.22400
- Ro, K., Cantrell, K. and Hunt, P. (2010) High-Temperature Pyrolysis of Blended Animal Manures for Producing Renewable Energy and Value-Added Biochar. Industrial & Engineering Chemistry Research, 49, 10125-10131. http://dx.doi.org/10.1021/ie101155m
- Park, M., Kumar, S. and ChangSix, R. (2012) Solid Waste from Swine Wastewater as a Fuel Source for Heat Production. Asian-Australasian Journal of Animal Sciences, 25, 1627-1632. http://dx.doi.org/10.5713/ajas.2012.12302
- Wnetrzak, R., Kwapinski, W., Peters, K., Sommer, S., Jensen, L. and Leahy, J. (2013) The Influence of the Pig Manure Separation System on the Energy Production Potentials. Bioresource Technology, 136, 502-508. http://dx.doi.org/10.1016/j.biortech.2013.03.001
- Font-Palma, C. (2012) Characterisation, Kinetics and Modelling of Gasification of Poultry Manure and Litter: An Overview. Energy Conversion and Management, 53, 92-98. http://dx.doi.org/10.1016/j.enconman.2011.08.017
- Sweeten, J., Heflin, K., Auvermann, B., Annamalai, K. and McCollum, F. (2013) Combustion Fuel Properties of Manure and Compost from Paved and Unpaved Cattle Feedlots as Modified by Annual Precipitation. Transactions of the ASABE, 56, 279-294. http://dx.doi.org/10.13031/2013.42584
- Jenkins, B., Baxter, L., Miles Jr., T. and Miles, T. (1998) Combustion Properties of Biomass. Fuel Processing Technology, 54, 17-46. http://dx.doi.org/10.1016/S0378-3820(97)00059-3
- Singh, K., Risse, M., Worley, J., Das, K. and Thompson, S. (2008) Effect of Fractionation on Fuel Properties of Poultry Litter. Applied Engineering in Agriculture, 24, 383-388. http://dx.doi.org/10.13031/2013.24501
- Ro, K., Cantrell, K., Hunt, P., Ducey, T., Vanotti, M. and Szogi, A. (2009) Thermochemical Conversion of Livestock Wastes: Carbonization of Swine Solids. Bioresource Technology, 100, 5466-5471. http://dx.doi.org/10.1016/j.biortech.2009.03.005
- Otero, M., Sánchez, M. and Gómez, X. (2011) Co-Firing of Coal and Manure Biomass: A TG-MS Approach. Bioresource Technology, 102, 8304-8309. http://dx.doi.org/10.1016/j.biortech.2011.06.040
- Vyazovkin, S. and Wight, C. (1999) Model-Free and Model-Fitting Approaches to Kinetic Analysis of Isothermal and Nonisothermal Data. Thermochimica Acta, 340-341, 53-68. http://dx.doi.org/10.1016/S0040-6031(99)00253-1
- ASTM Standard D 2974 (2007) Standard Test Methods for Moisture, Ash, and Organic Matter of Peat and Other Organic Soils. ASTM D2974-07a.
- ASTM Standard D5865 (2012) Standard Test Method for Gross Calorific Value of Coal and Coke. D5865-12.
- Galwey, A. and Brown, M. (1998) Kinetic Background to Thermal Analysis and Calorimetry. In: Handbook of Thermal Analysis and Calorimetry, Chapter 3, Vol. 1, Elsevier Service B.V., Amsterdam, 147-224.
- Zhou, D. and Grant, D. (2004) Model Dependence of the Activation Energy Derived from Nonisothermal Kinetic Data. The Journal of Physical Chemistry, 108, 4239-4246. http://dx.doi.org/10.1021/jp037917f
- Cai, J. and Bi, L. (2009) Kinetic Analysis of Wheat Straw Pyrolysis Using Isoconversional Methods. Journal of Thermal Analysis and Calorimetry, 98, 325-330. http://dx.doi.org/10.1007/s10973-009-0325-8
- Friedman, H. (1964) Kinetics of Thermal Degradation of Char-Foaming Plastics from Thermogravimetry: Application to a Phenolic Plastic. Journal of Polymer Science Part C: Polymer Symposia, 6, 183-195. http://dx.doi.org/10.1002/polc.5070060121
- Flynn, J.H. and Wall, L.A. (1966) General Treatment of the Thermogravimetry of Polymers. Journal of Research of National Bureau of Standards-A. Physics and Chemistry, 70A, 487-523.
- Ozawa, T. (1965) A New Method of Analyzing Thermogravimetric Data. Bulletin of the Chemical Society of Japan, 38, 1881-1886. http://dx.doi.org/10.1246/bcsj.38.1881
- Doyle, C. (1962) Estimating Isothermal Life from Thermogravimetric Data. Journal of Applied Polymer Science, 6, 639-642. http://dx.doi.org/10.1002/app.1962.070062406
- Mariotti, F., Tomé, D. and Mirand, P. (2008) Converting Nitrogen into Protein—Beyond 6.25 and Jones’ Factors. Critical Reviews in Food Science and Nutrition, 48, 177-184. http://dx.doi.org/10.1080/10408390701279749
- Demirbaş, A. (1997) Calculation of Higher Heating Values of Biomass Fuels. Fuel, 76, 431-434. http://dx.doi.org/10.1016/S0016-2361(97)85520-2
- Yang, H., Yan, R., Chen, H., Zheng, C., Lee, D. and Liang, D. (2006) In-Depth Investigation of Biomass Pyrolysis Based on Three Major Components: Hemicellulose, Cellulose and Lignin. Energy and Fuels, 20, 388-393. http://dx.doi.org/10.1021/ef0580117
- Møller, H., Sommer, S. and Ahring, B. (2004) Methane Productivity of Manure, Straw and Solid Fractions of Manure. Biomass and Bioenergy, 26, 485-495. http://dx.doi.org/10.1016/j.biombioe.2003.08.008
- Yao, F., Wu, Q., Lei, Y., Guo, W. and Xu, Y. (2008) Thermal Decomposition Kinetics of Natural Fibers: Activation Energy with Dynamic Thermogravimetric Analysis. Polymer Degradation and Stability, 93, 90-98. http://dx.doi.org/10.1016/j.polymdegradstab.2007.10.012
- Xiu, S., Zhang, Y. and Shahbazi, A. (2009) Swine Manure Solids Separation and Thermochemical Conversion to Heavy Oil. BioResources, 4, 458-470.
- Brebu, M. and Spiridon, I. (2011) Thermal Degradation of Keratin Waste. Journal of Analytical and Applied Pyrolysis, 91, 288-295. http://dx.doi.org/10.1016/j.jaap.2011.03.003
- Maddi, B., Viamajala, S. and Varanasi, S. (2011) Comparative Study of Pyrolysis of Algal Biomass from Natural Lake Blooms with Lignocellulosic Biomass. Bioresource Technology, 102, 11018-11026. http://dx.doi.org/10.1016/j.biortech.2011.09.055
- Draman, S., Daik, R., Latif, F. and El-Sheikh, S. (2013) Characterization and Thermal Decomposition Kinetics of Kapok (Ceiba pentandra L.)–Based Cellulose. BioResources, 9, 8-23.
- Shuping, Z., Yulong, W., Mingde, Y., Chun, L. and Junmao, T. (2010) Pyrolysis Characteristics and Kinetics of the Marine Microalgae Dunaliella tertiolecta Using Thermogravimetric Analyzer. Bioresource Technology, 101, 359-365. http://dx.doi.org/10.1016/j.biortech.2009.08.020
NOTES
*Corresponding author.