Journal of Geoscience and Environment Protection
Vol.05 No.09(2017), Article ID:78929,14 pages
10.4236/gep.2017.59008
Flood Maps and Bank Shifting of Dharla River in Bangladesh
Indira Bose, Umme Kulsum Navera
Department of Water Resources Engineering, Bangladesh University of Engineering and Technology, Dhaka, Bangladesh

Copyright © 2017 by authors and Scientific Research Publishing Inc.
This work is licensed under the Creative Commons Attribution International License (CC BY 4.0).
http://creativecommons.org/licenses/by/4.0/


Received: August 3, 2017; Accepted: September 3, 2017; Published: September 6, 2017
ABSTRACT
Bangladesh is prone to severe flooding as being located at the confluence of three mighty rivers named the Ganges, Brahmaputra, and Meghna. As a consequence, river flooding and erosion are common natural disasters that severely affect the landscape, lives and economy of the country. Dharla River, one of the trans-boundary rivers originated in the Himalayas, along with Brahmaputra River has a great influence on the recurring floods and erosion in north-western Bangladesh. Almost in every year, excessive erosion and embankment damages caused by Dharla render a thousand of people homeless with massive loss of crops and poultries. As per the environmentalists, this is a matter of huge concern as development of accurate flood maps and erosion prediction for Dharla River has been very challenging. In this study, the flood map and Dharla River bank shifting study have been developed by using HEC-RAS 4.1.0 hydrodynamic model and Landsat satellite images. In addition, the HEC-GeoRAS was used to establish the river reach for HEC-RAS. The calibration and validation have been performed using the observed and simulated water levels for the years of 2013 and 2014 respectively. The HEC-RAS flood water level output was used in HEC-GeoRAS for raster interpolation followed by overlain onto the land surface elevation of the study area. Then, the difference between water level interpolation and land elevation surfaces has been considered as a depth of inundation which is performed in Arc-Map 10.2. Flood maps have been generated for the years 2010, 2013, and 2014 for highest water level of each year. The erosion prone areas have been indicated by analyzing bank shifting of Dharla River for the years 1987, 1997, 2007, and 2017 by digitizing the satellite images in Arc-GIS 10.2. From the observation it has been found that the course of the Dharla River has been shifted vastly since 1987 to 2017 due to erosion.
Keywords:
Hydrodynamic Modeling, GIS, Flood, Flood Maps, Bank Shifting, Erosion

1. Introduction
Flood is one of the most devastating disasters in the present world which causes damage to environmental, social, economical, and human lives at about 43% of all natural disasters [1] . Because of the unique geographic location, Bangladesh is one of the most disaster prone countries in the world [2] . The country is located on the Tropic of Cancer at a longitude of 90E and has a land area of only 145,000 km2. It is located on the downstream of three major international river basins named the Ganges, Brahmaputra, and Meghna. As a consequence, 80% of the land area is considered as floodplains and thus frequently flooded with widespread damages around the year [3] . Annual average rainfall varies from 1200 mm in the west to up to 5800 mm in the northeast, making the flood damage even worse [4] . Bangladesh has experienced periodic floods of vast magnitudes in 1974, 1984, 1987, 1988, 1998, 2000, 2004, and 2007. Flood damage potential in Bangladesh is also on the rise due to possible causes including climate change, urban concentration in the three river basins and encroaching of settlements in the flood prone areas [5] . Catastrophic floods in 1988, 1998, 2004, and 2007 caused losses of over two million metric tons of rice, or 4% - 10% of the annual rice production in the country [6] . The floods of 1988, 1998, and 2004 inundated about 61%, 68%, and 38% of the total area of the country, respectively [7] . In 2010, 49 out 64 districts of Bangladesh were flooded, affecting ten millions of people [8] . Along with flood, river bank erosion is another major threat to Bangladesh. The losses caused by erosion are slow and gradual. A rise in water level, stronger currents and a greater amount of sediment in the water are the main prerequisites to erosion. It is therefore reasonable to assume that the increase of these elements will lead to increased erosion [9] .
Among other flood prone rivers, Dharla is one of Bangladesh’s trans-boundary rivers. It originates in the Himalayas and enters Bangladesh through the Lalmonirhat District and flows as the Dharla River until it empties into the Brahmaputra River near the Kurigram District. Dharla River along with Brahmaputra River has a great influence on the floods and erosion of different districts of Bangladesh. In 2016, the low-lying areas of the Dharla River got flooded due to severe downpour and onrush of upstream water. The water level of Dharla flowed 5 centimeters above Danger level at Dharla Bridge point in Sadarupazila of the district. According to Annual Flood Report (2012) of Bangladesh Water Development Board, the water Level of Dharla River at Kurigram registered two distinct peaks during the monsoon 2012, in June and July. The Water level at Kurigram attained peak of 26.74 m PWD on 29th June which was 24 cm above the Danger Level, then fell and again rose up to 26.68 m (18 cm above the Danger Level) in the 3rd week of July [10] . According to Annual Flood Report (2014) of Bangladesh Water Development Board, the water level at Kurigram attained peak of 26.95 m PWD on 28 August which was 45 cm above the DL (26.50 m) [11] . Erosion by the rivers Dharla and Jamuna took a serious turn in Lalmonirhat in 2007. In Lalmonirhat, about 2 kilometers of a 7-kilometre long flood control embankment was devoured by the Dharla. In 2010, about 150-meter stretch of the 750 meter revetment of the Bangladesh Water Development Board collapsed at Char Baraibari, Kurigram. In 2015, an area of about 100 feet of the Water and Power Development Authority (WAPDA) dam in Bangram area of Khulaghat union was under severe threat of erosion by the Dharla River. In 2016, the river eroded some 200-meter embankment in Moglabasa union of Kurigram district. Unquestionably, flood mapping and erosion analysis of Dharla is a matter of great importance. Because, proper floodplain management and the use of science and knowledge can reduce flood damages in a country like Bangladesh [12] . Also flood mapping could help to identify the areas prone to erosion. Accurate flood mapping can reduce the flood damages. It is also very important for proper planning and management of flood hazards [1] . However, compared to the wide range of research conducted in other flood prone countries, research work carried out in Bangladesh on determination of current status of flood inundation map is very limited [13] .
This study provides an easy, simple, and short technique to obtain flood maps for Dharla River by developing a hydrodynamic model of the river using Arc-GIS 10.2. Also the bank shifting has been analyzed by digitizing the satellite images of Dharla River for the years 1987, 1997, 2007 and 2017 using Arc-GIS 10.2.
2. Data and Methodology
2.1. Study Area
Dharla is an erosive river and its characteristics are changing with time. It is an important right bank tributary of the Brahmaputra River in the lower reach. For the expected future climate change and its response to the Dharla River, more studies on this river are of great importance.
The Dharla River and its flood plain (approximately of 850 km2), about 20 km from the left bank and 27 km from the right bank of the river (excluding the effect of Teesta River) are the study areas (Figure 1). The river reach length is about 56 km. Only the flood plain of Dharla River is taken into consideration, most part of which is in Kurigram district and some of it includes Lalmonirhat district. The average bed slope of Dharla River is 0.00018 [14] . The bed slope of the river may vary from 0.0001 to 0.0005, which has been obtained from the result of thalweg analysis.
2.2. Data
The Shuttle Radar Topography Mission (SRTM) data has emerged as a global elevation data in the past one decade because of its free availability, homogeneity, and consistent accuracy compared to other global elevation dataset [15] . The data comprises of a resolution of 90 m × 90 m. All the data in the DEM have been projected on to the Bangladesh Transverse Mercator (BTM). In this study the cross-section data of RMDLA-1 to RMDLA-10 for 2013 have been used,

Figure 1. Study area showing the Dharla River (Source: Google Earth).
which have been collected from Bangladesh Water Development Board (BWDB). Water level and discharge data of the Dharla River at Taluk-Simulbari (25.9646N and 89.505E) and Kurigram (25.8199N and 89.6704E) stations have been collected from Bangladesh Water Development Board (BWDB). Landsat satellite images have been used for bank shifting analysis.
2.3. Model Details
HEC-RAS calculates one-dimensional steady and unsteady flow, and the model equations are described by Horritt and Bates [16] . The hydrodynamic model requires as input: cross-sections of the river reach, flow hydrographs as upstream boundary condition, stage hydrograph as downstream boundary condition, and roughness coefficients (Manning’s n). For unsteady flow simulation, flow hydrograph has been provided at Taluk-Simulbari as upstream boundary condition and stage hydrograph has been provided at Kurigram as downstream boundary condition. After entering Geometry data and Unsteady Flow data the model was run for the period of 01 June-31 December 2010, 01 June-31 December 2013, and 01 June-31 December 2014.
3. Results
3.1. Calibration and Validation of the Model
The 2013 dataset has been used for calibration of the model. The rating curve generated from the water levels at Taluk-Simulbari station has been used as upstream boundary. Manning’s “n” value for roughness has been used for sensitivity analysis with 2013 dataset. Mean daily water level data at observed station is compared with model simulated output for calibration and validation. From analysis the roughness coefficient was found to be 0.032. The calibrated graph for stage hydrograph for the year 2013 is shown in Figure 2.
It is indicated that the trend and shape of the simulated and observed hydrograph is almost similar. The correlation co-efficient (R2) value for the year 2013 is 0.9865 between observed and model simulated water level. This result shows that peak water level in model has almost matched with observed water level.
The 2014 dataset has been used for validation of the model. The simulated and observed stage hydrograph using natural channel at validation period 2014 is shown in Figure 3. The correlation co-efficient (R2) value for the year 2014 is
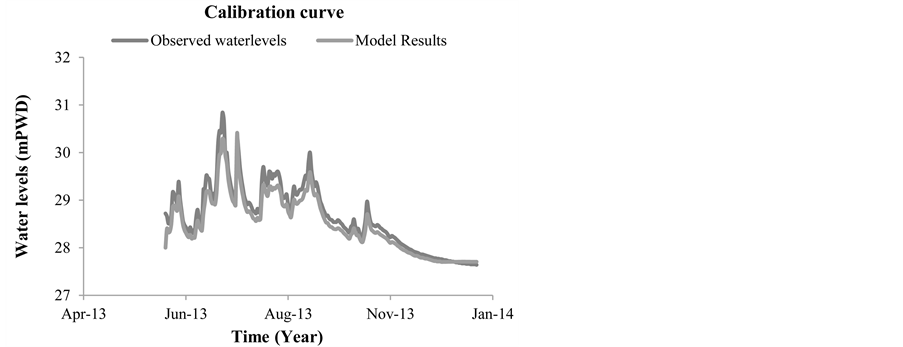
Figure 2. Calibration of Water level data at taluk-simulbari station for the year 2013.
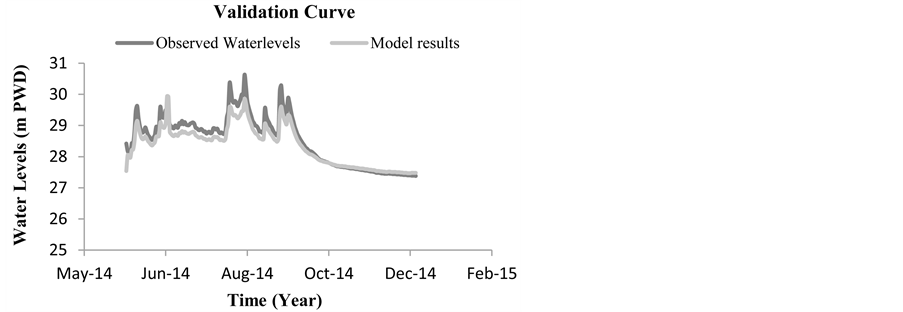
Figure 3. Validation of water level data at taluk-simulbari station for the year 2014.
0.9697 between observed and model simulated water level. This result shows that peak water level in model is 0.7 m PWD less than the observed water level.
There is no intermediate station available for Dharla River, so the calibration and validation for water level is done with the dataset of upstream station (Taluk-Simulbari). As only the flow hydrograph of upstream station is used as boundary condition, the water level dataset could be used for calibration and validation.
3.2. Development of Flood Maps
The flood water levels obtained from HEC-RAS output are used in HEC-GeoRAS for raster interpolation technique and are overlain onto the land surface elevation of the study area. Difference between water level interpolation and land elevation surfaces are considered as depth of inundation. By classifying the inundation depth in various ranges the flood maps are finally obtained. The dataset is taken from June to October because the flood event or high discharge normally occurs in this time period only. The resulting flood maps for the peak water level of the year developed with the simulation of HEC-RAS model are shown in Figure 4.
3.3. Flood Pattern Analysis
An analysis upon the flood patterns for the year of 2010, 2013, and 2014 has been carried out. The analysis is represented in Figure 5. From the generated maps, the inundated areas have been calculated using Arc-GIS 10.2. The calculated areas have been listed in Tables 1-3, which show that with higher flood water level associated area of inundation was also higher. Figure 5 shows that with higher flood water level there is higher area of inundation. The highest average water level has been obtained on the month of July, 2010. In 2013 the water level attained two distinct peaks. On the month of July the water level attained one peak and the second peak on the month of September. In 2014 the highest average water level has been obtained on the month of August. The highest water level obtained in 2010 is much higher than 2013 and 2014 and inundates approximately 10% higher area than 2013 and 16% higher area than 2014. For the year 2010, the highest inundation has been found on the month of July whereon the month of October the area of inundation has been decreased. In case of the year 2013, two distinct peaks have been obtained on the month of July and September. From the flood pattern analysis of 2014, the highest inundation obtained on the month of August where on the month of September the inundation was slightly smaller as compared to the month of August. According to Annual Flood Report (2014) of Bangladesh Water Development Board, the water level at Kurigram attained peak of 26.95 m PWD on 28 August [11] . From the analysis the peak obtained on 27 August 2014 with an average highest water level of 26.9 m PWD, which almost matches the information of annual flood report of Bangladesh Water Development Board, 2014.
 (a)
(a)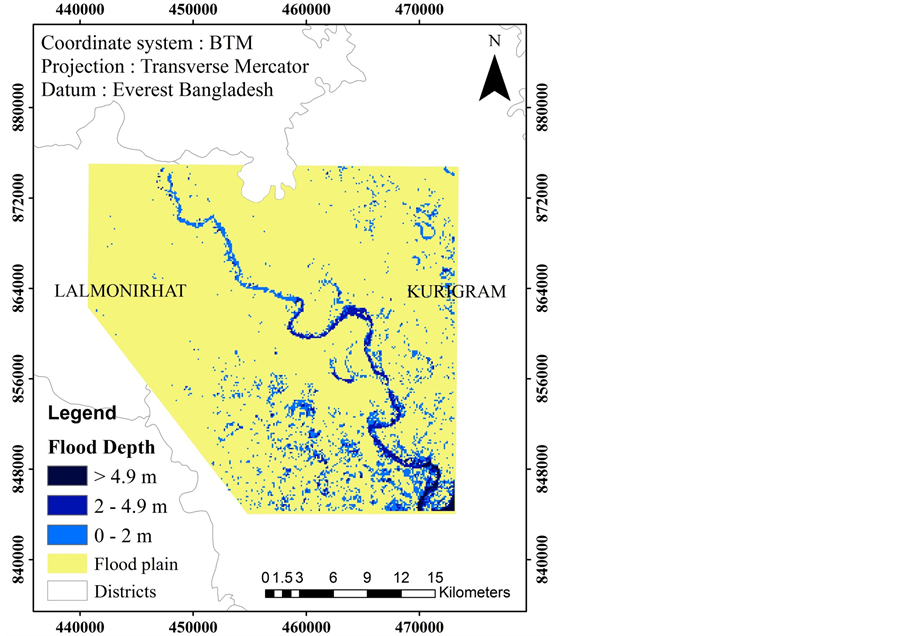 (b)
(b)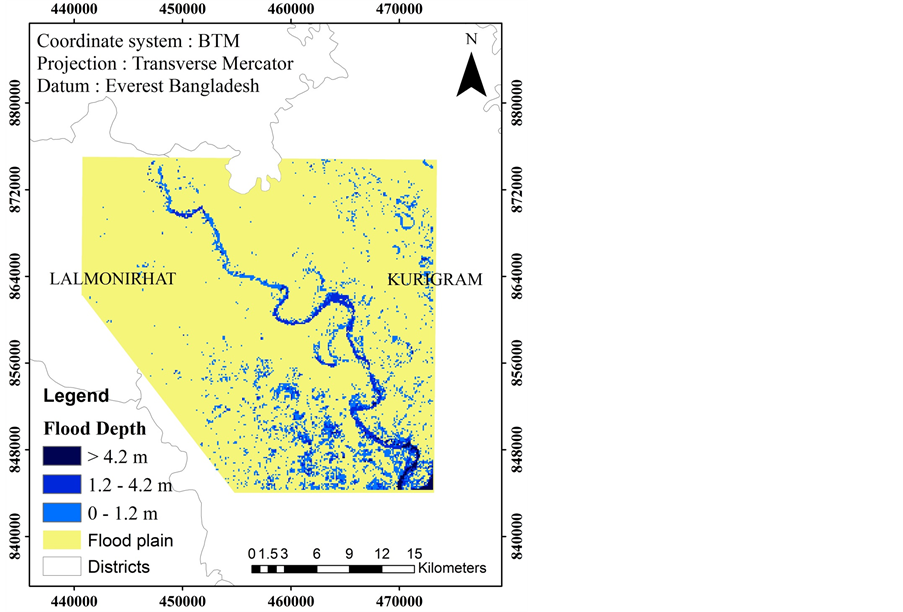 (c)
(c)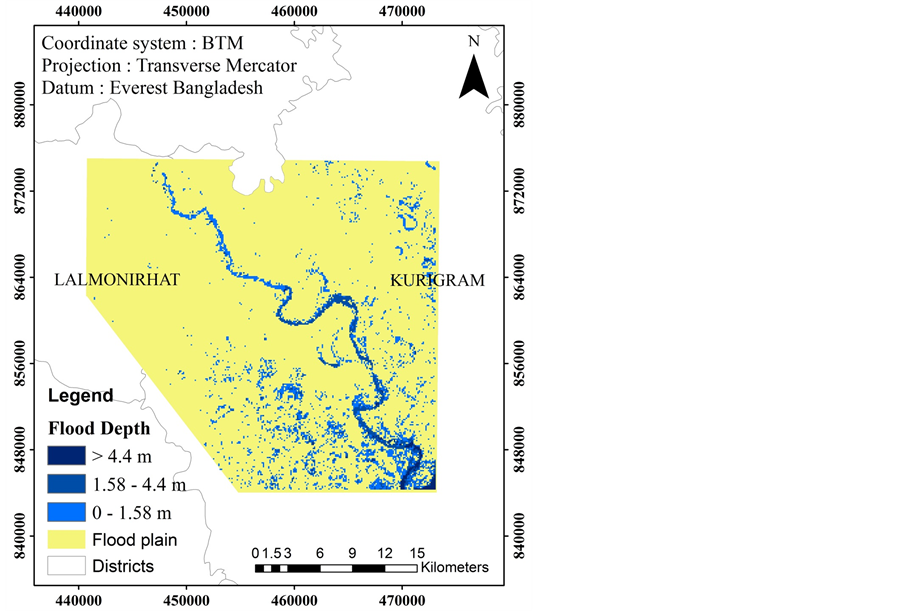 (d)
(d)
Figure 4. Flood Maps for Dharla River for (a) 22 July 2010, (b) 11 July 2013, (c) 08 September 2013, (d) 27 August 2014.
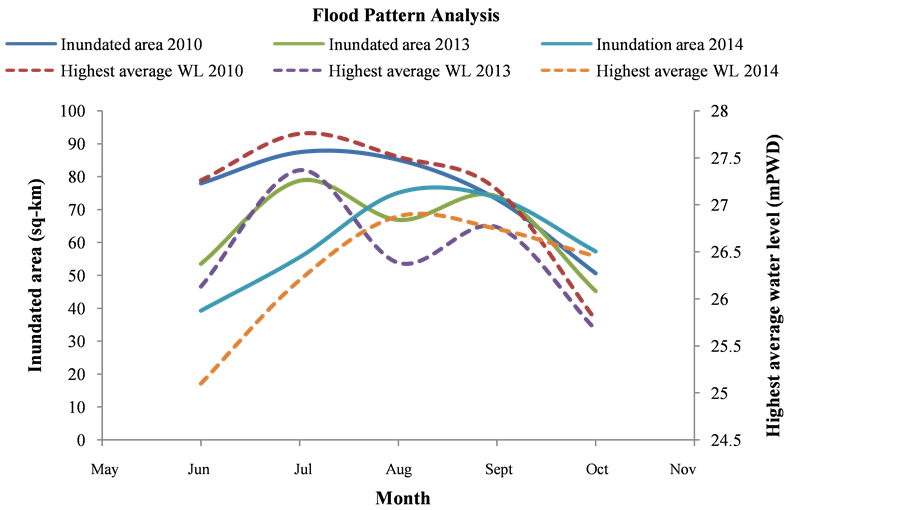
Figure 5. Flood pattern analysis for the years 2010, 2013, and 2014.

Table 1. Highest average water levels (m PWD) and inundated area (km2) of year 2010.
Table 2. Highest average water levels (m PWD) and inundated area (km2) of year 2013.
Table 3. Highest average water levels (m PWD) and inundated area (km2) of year 2014.
3.4. Bank Shifting of Dharla River
For bank shifting the satellite images of the years 1987, 1997, 2007 and 2017 have been used. In the satellite images the bank lines are digitized and then superimposed in Arc-GIS 10.2. For the analysis of thirty years’ (1987 to 2017) bank shifting the whole length of the river has been divided into 6 segments and the erosive areas are indicated.
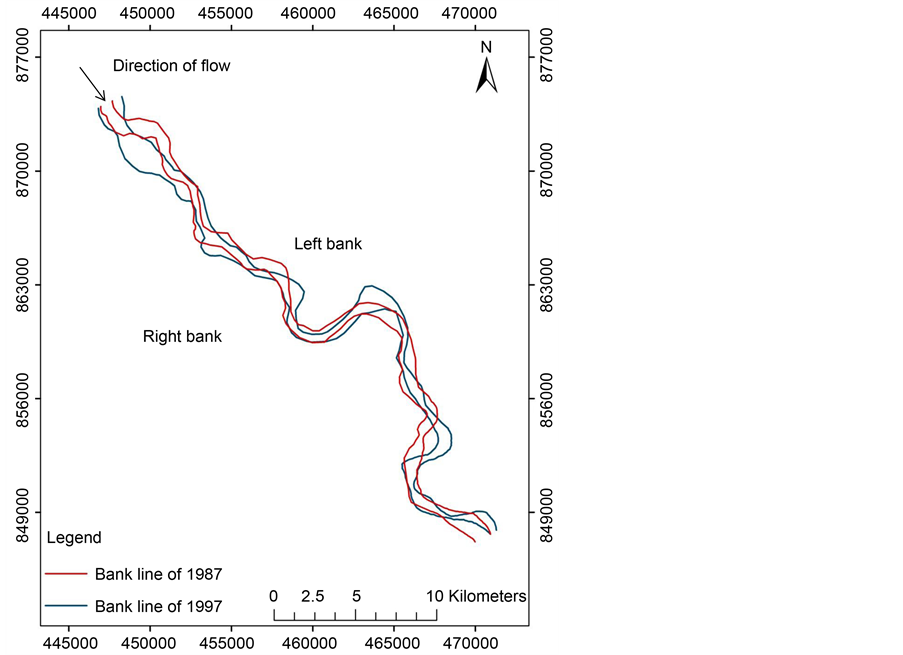
From the developed maps it has been observed that higher inundation occur in the downstream. Severe erosion occurs because of this flooding. As rainfall is one of the major causes of erosion, during flooding of Dharla River severe erosion takes place. Rainfall is devastating to the soils of the banks because of the impact and force; which hits the top soil. These splashing effects cause the soils to lose particles and shift the bank lines drastically. By digitizing the bank lines on the satellite images, it was observed that the course of the Dharla River has been shifted vastly since 1987 to 2017 due to erosion. In Figure 6(a) it has been shown that from 1987 to 1997 the upstream right bank has been shifted approximately 2 km outwards which indicates severe erosion. The upstream left bank has been shifted inwards approximately 1 km. The downstream left bank has been shifted outwards resulting erosion and the right bank has been shifted inwards. The middle part of the river has seen to be more stable. From 1997 to 2007 the bank shifting is insignificant (Figure 6(b)). From 2007 to 2017 the upstream left bank has been shifted inwards (Figure 6(c)). The left bank in the bend (between sections 4-4 and 5-5 indicated in Figure 6(d)) has been shifted outwards significantly. The erosive nature of the river is changing. The overall bank shifting for 30 years (1987 and 2017) has been shown in the Figure 6(d). This analysis shows that the right bank between the sections 1-1 and 2-2 and the left bank between the sections 4-4 and 5-5, 5-5 and 6-6 have been shifted vastly. This indicates that those portions of the river have suffered huge erosion-depo- sition. The analysis of bank line shifting for the years 1987, 1997, 2007, and 2017 are shown in Figure 6. The upstream banks may also suffer erosion due to high gradient and velocity flow that enters from the upper catchment. Due to recession of flood waters at downstream, the downstream banks are eroded. As Dharla River is very erosive in nature more detailed study involving erosion-deposition could be carried out in future research.
4. Conclusions
In this study, HEC-RAS 1D has been used to develop the hydrodynamic model of Dharla River and Arc-GIS 10.2 has been used for flood mapping. The use of GIS tools is realized to be very effective for flood mapping. Compared to the wide range of research conducted in other flood prone countries, research work carried out in Bangladesh on determination of current status of flood map is very limited. As per current state of knowledge any study regarding Dharla River flood map using GIS could not found yet. Also Arc-GIS 10.2 which has been used for mapping is an open source and user friendly. Remote sensing data are
 (a)
(a)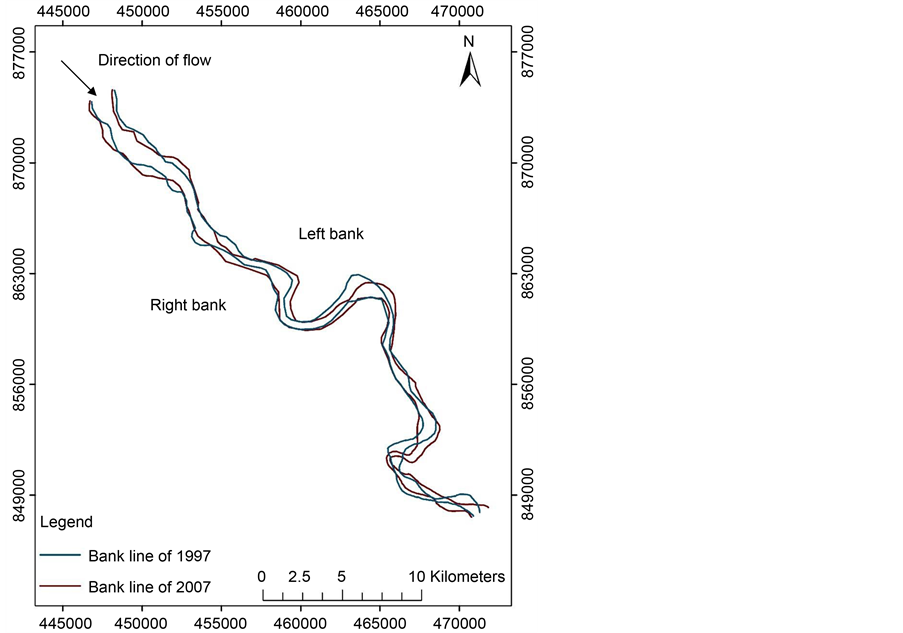 (b)
(b)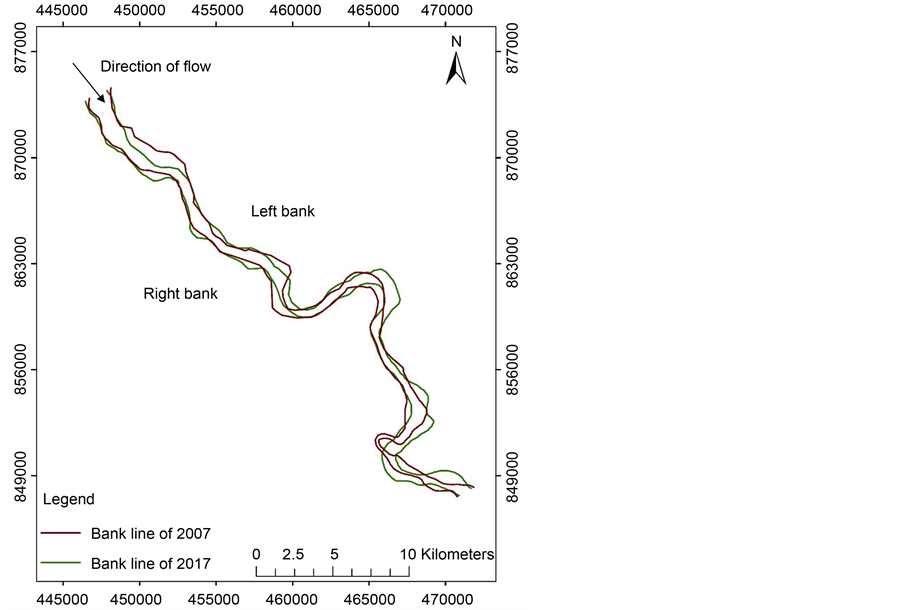 (c)
(c)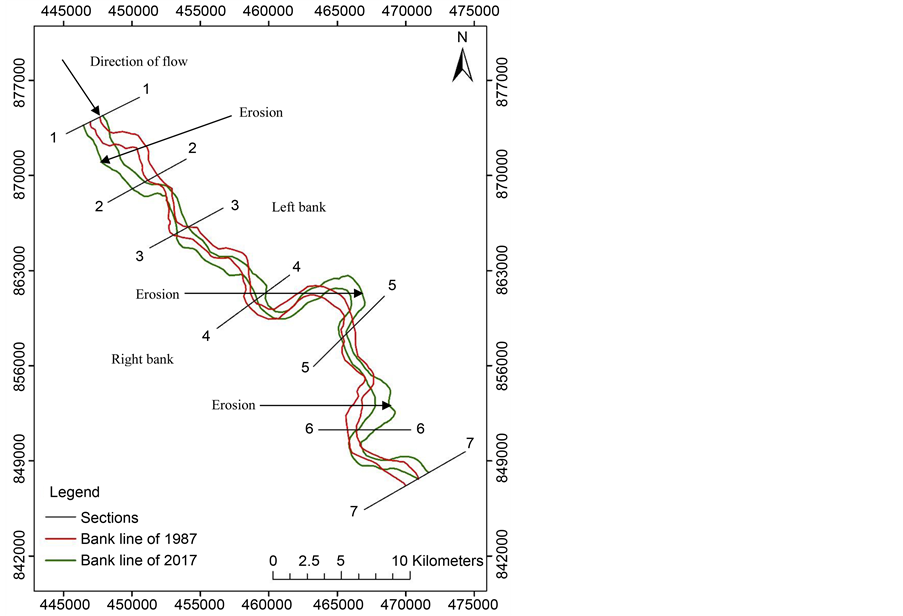 (d)
(d)
Figure 6. Bank shifting of Dharla River since (a) 1987 to 1997, (b) 1997 to 2007, (c) 2007 to 2017, and (d) 1987 to 2017.
not needed to be integrated with GIS tool in this study. This study has been conducted using GIS tool in a very simple and straight forward method. For preliminary flood protection measures this method could be very effective. More complicated studies have been conducted using GIS tools. A study carried out by Seenirajan et al. (2017) on analysis of Chennai flood 2015 using GIS involved much complicated procedure as GIS was integrated with Multi-criteria Decision Analysis [17] .
In this study flood maps have been generated for the years 2010, 2013, and 2014 for highest water level of each year. The developed flood maps showed comparatively high inundation of the floodplain of Dharla River which mainly covers the kurigram District. From flood pattern analysis, the peak of 2010 has been found much higher than the peaks for 2013 and 2014. From the observation of satellite images of Dharla River, it has been found that the right banks at the upstream and the left banks at downstream have suffered severe erosion. As a consequence, the course of the Dharla River has been shifted vastly since 1987 to 2017. These findings can be useful for taking necessary steps to improve and maintain the embankment to minimize erosion loses in upcoming years. For calibration and validation, the water level data of the upstream station (Taluk-Simulbari) has been used as no intermediate station was available. Hence, for better and more accurate results an intermediate station is recommended for future study.
Acknowledgements
We are grateful to acknowledge the support of Bangladesh Water Development Board (BWDB) for providing cross-sections, water level and discharge data of Dharla River. Special thanks to Partha Saha, Graduate Research Assistant, Department of Chemical Engineering, Auburn University for his guidance.
Cite this paper
Bose, I. and Navera, U.K. (2017) Flood Maps and Bank Shifting of Dharla River in Bangladesh. Journal of Geoscience and Environment Protection, 5, 109-122. https://doi.org/10.4236/gep.2017.59008
References
- 1. Roy, S.K. and Sarker, S.C. (2016) Integration of Remote Sensing Data and GIS Tools for Accurate Mapping of Flooded Area of Kurigram, Bangladesh. Journal of Geographic Information System, 8, 184-192. https://doi.org/10.4236/jgis.2016.82017
- 2. Cutter, S.L. (1996) Societal Reponses to Environmental Hazards. International Social Science Journal, 150, 526-536.
- 3. Sayed, M.B. and Haruyama, S. (2016) Evaluation of Flooding Risk in Greater Dhaka District Using Satellite Data and Geomorphological Land Classification Map. Journal of Geoscience and Environment Protection, 4, 110-127. https://doi.org/10.4236/gep.2016.49009
- 4. Rahman, L.N. (1996) Present Situation and Future Issues Regarding River and Hydrological Database in Bangladesh. Proceedings of the Second Experts Conference on River Information Systems, 31-38.
- 5. Bangladesh Disaster Knowledge Network (2013). http://www.saarcsadkn.org/countries/bangladesh/hazard_profile.aspx
- 6. Islam, A.S., Bala, S.K. and Haque, M. (2010) Flood Inundation Map of Bangladesh Using Modis Time Series Images. Journal of Flood Risk Management, 3, 210-222. https://doi.org/10.1111/j.1753-318X.2010.01074.x
- 7. Rahman, M.M. and Ali, M.M. (2015) Flood Inundation Mapping of Floodplain of the Jamuna River using HEC-RAS and HEC-GeoRAS. International Conference on Recent Innovation in Civil Engineering for Sustainable Development.
- 8. Annual Flood Report (2010) Flood Forecasting and Warning Centre, Bangladesh Water Development Board, Submitted to Ministry of Water Resources Bangladesh.
- 9. Arsenault, M.P., Azam, M.N. and Ahmad, S. (2015) Riverbank Erosion and Migration in Bangladesh Char Lands. Environment, Migration and Adaptation: Evidence and Politics of Climate Change in Bangladesh, AHDPH, Dhaka, 3, 41-62.
- 10. Annual Flood Report (2012) Flood Forecasting and Warning Centre, Bangladesh water Development Board, Submitted to Ministry of Water Resources Bangladesh.
- 11. Annual Flood Report (2014) Flood Forecasting and Warning Centre, Bangladesh Water Development Board. Ministry of Water Resources Bangladesh.
- 12. Parsa, A.S., Noori, M., Heydari, M. and Rashidi, M. (2016) Floodplain Zoning Simulation by using HEC-RAS and CCHE2D Models in the Sungai Maka River. Air, Soil and Water Research, 9, 955-962.
- 13. Islam, A.S., Bala, S.K. and Haque, A. (2009) Flood Inundation Map of Bangladesh using MODIS Surface Reluctance Data. Proceedings of the 2nd International Conference of on Water and Flood Management, Dhaka, 15-17 March 2009.
- 14. Rahman, M., Arya, D.S., Goel, N.K. and Dhamy, A.P. (2010) Design Flow and Stage Computations in the Teesta River, Bangladesh, using Frequency Analysis and MIKE 11 Modelling. Journal of Hydrologic Engineering, 16, 176-186. https://doi.org/10.1061/(ASCE)HE.1943-5584.0000299
- 15. Sharma, A. and Tiwari, K.N. (2014) A Comparative Appraisal of Hydrological Behavior of SRTM DEM at Catchment Level. Journal of Hydrology, 519, 1394-1404.
- 16. Horritt, M. and Bates, P. (2002) Evaluation of 1D and 2D Numerical Models for Predicting River Flood Inundation. Journal of Hydrology, 268, 87-99.
- 17. Seenirajan, M., Natarajan, M., Thangaraj, R. and Bagyaraj, M. (2017) Study and Analysis of Chennai Flood 2015 Using GIS and Multi-Criteria Technique. Journal of Geographic Information System, 9, 126-140. https://doi.org/10.4236/jgis.2017.92009