International Journal of Clinical Medicine
Vol.08 No.03(2017), Article ID:75193,20 pages
10.4236/ijcm.2017.83018
Hyperuricemia as a Predictor of Progression of Chronic Kidney Disease: A Matched Cohort Analysis
Michiaki Kamiyama1, Hiroshi Kataoka1,2*, Takahito Moriyama1, Toshio Mochizuki1,2, Kosaku Nitta1
1Department of Medicine, Kidney Center, Tokyo Women’s Medical University, Tokyo, Japan
2Clinical Research Division for Polycystic Kidney Disease, Department of Medicine, Kidney Center, Tokyo Women’s Medical University, Tokyo, Japan

Copyright © 2017 by authors and Scientific Research Publishing Inc.
This work is licensed under the Creative Commons Attribution International License (CC BY 4.0).
http://creativecommons.org/licenses/by/4.0/


Received: February 22, 2017; Accepted: March 28, 2017; Published: March 31, 2017
ABSTRACT
Background: The clinical significance of uric acid (UA) in patients with chronic kidney disease (CKD) has never been elucidated in detail. Objectives: The aim of this study was to elucidate the predictive value of hyperuricemia (HU) in relation to kidney disease progression in CKD patients. Methods: We reviewed data obtained from 201 CKD patients. Renal outcome was assessed by performing the Kaplan-Meier and Cox proportional hazard regression models. The renal outcomes of CKD patients with and without HU were compared by using a propensity score-matched cohort. Results: The results of a multivariate Cox regression analysis showed that HU (UA ≥ 7.1 mg/dL) (P = 0.001), diabetes mellitus (P = 0.003), and a high urine albumin-to-creatinine ratio (P = 0.0005) were significantly associated with a ≥50% eGFR decline or ESRD. The serum UA values were positively correlated with mean blood pressure (P = 0.007), visceral fat area (P = 0.0003), and maximum carotid intima-media thickness (P = 0.0003). The Kaplan-Meier analysis in the propensity score-matched cohort indicated that the renal survival rate of the group of CKD patients with HU was significantly lower than that of the group without HU (log rank, P < 0.0001), even after complete adjustment for the eGFR. Conclusion: The results of this study suggest that the serum UA value is a predictor of CKD progression.
Keywords:
CKD, Hyperuricemia, Propensity Score Matching, Visceral Fat Area, Maximum Carotid Intima-Media Thickness

1. Introduction
Chronic kidney disease (CKD) is affected by multiple risk factors for disease progression [1] [2] , and it is extremely important to identify risk factors for the acceleration of the CKD progression. The impact of the serum uric acid (UA) on renal prognosis of CKD patients has recently been attracting attention [3] , and our group has reported finding that the serum UA value can serve as a predictor of progression of kidney disease in biopsy-proven nephrosclerosis patients [4] . However, because the serum UA elevation due to the decreased renal UA clearance in CKD patients makes it difficult to assess the role of UA in the progression of CKD, the predictive value of UA in regard to the progression of CKD remains a matter of controversy [5] - [11] .
A high serum UA level is associated with obesity [12] [13] and is a risk factor for carotid atherosclerosis [14] . The aim of the present study was to elucidate the predictive value of hyperuricemia (HU) in relation to kidney disease progression in CKD patients.
2. Methods
2.1. Patient Selection
Abdominal computed tomography (CT) and carotid ultrasonography were performed on 201 CKD outpatients who attended the Kidney Center of Tokyo Women’s Medical University Hospital between August 2006 and August 2007. CKD was diagnosed according to previously described criteria [15] . Among these 201 patients, the following patients were excluded from participation: 1) patients who had been treated with antihyperuricemic agents; 2) patients with no UA data. The remaining 122 patients were ultimately enrolled as subjects of the present study (Figure 1).
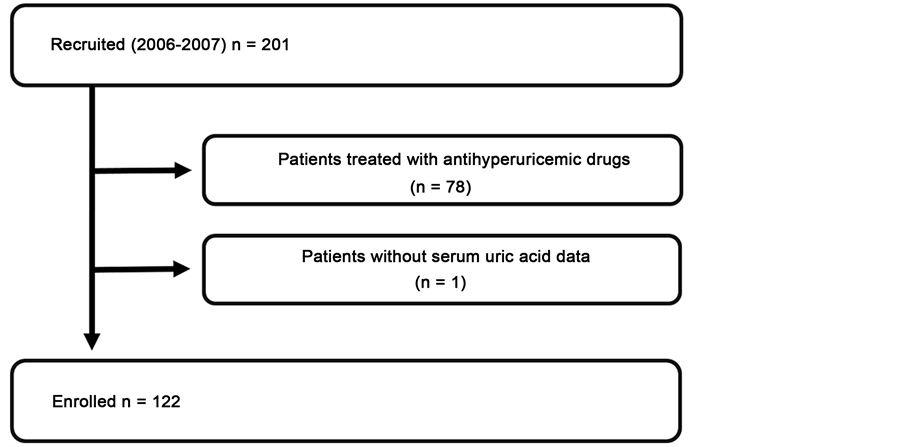
Figure 1. Flow chart of patient selection. The 79 patients who did not meet the entry criteria were excluded from the 201 patients screened, and the other 122 patients were enrolled in this study.
The subjects’ human rights and method of protecting personal information were well considered. All of the relevant and responsible staff adhered to the Helsinki Declaration (amended October 2013) and the Ethical Guidelines for Clinical Studies (revised July 31, 2008, referred to hereafter as the Clinical Studies Ethical Guidelines) in the execution of this study. The study was approved by the Medical Ethics Committee of Tokyo Women’s Medical University (#4188). All participants gave their informed consent to participate in the study.
2.2. Measurements of Covariates
At a regular ambulatory visit, each subject underwent anthropometric and physical examinations that included blood pressure (BP), height, body weight, visceral fat area (VFA), subcutaneous fat area (SFA), and maximum carotid intima- media thickness (IMT). BP was measured in triplicate with a mercury sphygmomanometer, and the average value was used in the analysis. VFA and SFA were measured by CT, and IMT was measured by carotid ultrasonography. Details of the measurement techniques are described below in this section. All biochemical analyses were performed on samples obtained from fasted subjects. Serum creatinine (Cr) levels were measured enzymatically. The estimated glomerular filtration rate (eGFR) was calculated by using the previously described formula for Japanese patients [16] . Urinary albumin was measured by a latex agglutination test [17] . Urinary albumin excretion was expressed as the urine albumin-to-creatinine ratio (UACR). We also assessed the impact of concomitant drug use and comorbidities at entry [18] [19] . The concomitant drugs being taken by the patients were: antihypertensive drugs, diuretics, and drugs for the treatment of hyperuricemia, dyslipidemia, and diabetes mellitus.
The baseline parameters assessed in this study were: age, gender, systolic blood pressure (SBP), diastolic blood pressure (DBP), mean blood pressure (MBP), BMI, VFA, SFA, IMT, eGFR, hemoglobin, serum albumin, UA, total cholesterol (TC), LDL cholesterol (LDL-C), HDL cholesterol (HDL-C), and triglyceride (TG) values, and UACR. Comorbidities are defined below. The subjects were followed up until July 2016.
2.3. Abdominal CT Examination
The multi-slice CT examination was performed by using a GE Light Speed. An index image was obtained before scanning, and the umbilicus to L4-5 level was identified [20] [21] . VFA at this level correlated extremely well with whole intra-abdominal fat content (r = 0.94). Horizontal images were obtained at 400 mA and 120 kVp with a scan time of 1.0 s. The range of CT values covered optimal CT numbers for fat tissue, i.e., from −150 to −40.14 Data were stored and analyzed with GE advantage workstation Ver.4.0.
2.4. Carotid Ultrasonography
An experienced examiner blinded to the patient data performed high-resolution duplex carotid ultrasonography with a 7.5-MHz duplex scanner (Aplio XG; Toshiba, Tokyo, Japan). The common and internal carotid arteries were scanned cross-sectionally and longitudinally to estimate the presence and distribution of atherosclerotic plaques. The entire length of both common carotid arteries and both internal carotid arteries up to approximately 20 mm distal to the tip of the carotid bifurcation were scanned. Maximum intima-media thickness (IMT) measurements were obtained to identify the thickest region of the arterial wall according to an international consensus report [22] .
2.5. Definition of Comorbidities
Hypertension: Being treated with an oral antihypertensive agent, SBP ≥ 140 mmHg, DBP ≥ 90 mmHg.
Hyperuricemia (HU): Being treated with an oral antihyperuricemic agent, serum UA level ≥ 7.1 mg/dL.
Hypercholesterolemia: Being treated with an oral antidyslipidemic agent, serum TC level ≥ 220 mg/dL, or serum LDL level ≥ 140 mg/dL.
Hypertriglyceridemia: Being treated with an oral antidyslipidemic agent or serum TG level ≥ 150 mg/dL.
Diabetes mellitus: Being treated with an antidiabetic agent or a history of diagnosis with diabetes mellitus.
2.6. Outcome Evaluation (Endpoint)
The outcome variable of interest was kidney disease progression, which was defined as a ≥50% decline in eGFR from baseline (≥50% eGFR decline) or ESRD requiring dialysis.
2.7. Statistical Analysis
Continuous variables are reported as the mean ± standard deviation (SD), and categorical variables are reported as percentages unless otherwise stated. We compared participant outcomes by performing an unpaired t-test or chi-square test, or Fisher’s exact test. The correlations between UA and the other variables were assessed by using Pearson’s correlation coefficients. The optimal cut-off serum UA value for discriminating ≥a 50% eGFR decline or ESRD during follow-up examinations was determined by performing a receiver operating characteristic (ROC) analysis. The patients were divided according to their UA level at baseline into an HU group, i.e., a group whose UA value was ≥7.1 mg/dL, and a non-HU group, i.e., a group whose UA value was <7.1 mg/dL. Prognostic variables for renal outcome were assessed by the univariate and multivariate Cox proportional hazards method. We included covariates for age, sex, VFA, IMT, eGFR, UACR, and comorbidities, including HU, at baseline in the Cox proportional hazards models. Variables with P-values less than 0.1 in the univariate model were included in the multivariate model. Renal outcome which was a ≥50% eGFR decline or ESRD, and interval estimates between the HU group and the non-HU group was calculated by the Kaplan?Meier method and evaluated by the log-rank test.
To further assess whether associations were consistent across clinically matched subgroups, we fit propensity score-matched models that included several potential modifying variables (sex, eGFR, MBP, VFA), and performed subgroup analyses of the groups. The caliper-matching method was used with a maximum tolerance level of 0.1. Standardized differences were calculated to assess the appropriateness of matching, and 95% confidence intervals (CIs) were calculated. P values <0.05 were considered statistically significant. All statistical analyses were performed by using the JMP Pro ver.12.1.0 software program (SAS Institute, Cary, NC, USA).
3. Results
3.1. Patients
The 122 subjects consisted of 48 males and 74 females, and their mean age at baseline was 58.7 ± 13.9 years (range 24 - 84 years). The mean SBP was 124.9 ± 8.1 mmHg, DBP 76.4 ± 6.2 mmHg, MBP 92.6 ± 6.6 mmHg, BMI 23.9 ± 4.1 kg/m2, VFA 117.1 ± 62.1 cm2, IMT 1.44 ± 0.81 mm, UACR 238.7 ± 548.1 mg/g Cr, and eGFR 63.7 ± 19.8 mL/min/1.73 m2. The concomitant drug data showed that 75 subjects were being treated with an antihypertensive agent, 43 with an antidyslipidemic agent, 17 with an antidiabetic agent, 20 with a corticosteroid, 7 with an immunosuppressing agent, and 19 with a diuretic. The comorbidity data showed that 76 patients had hypertension, 20 had HU (UA ≥ 7.1 mg/dL), 73 had hypercholesterolemia, 78 had hypertriglyceridemia, and 26 had diabetes mellitus. The overall follow-up period was 8.3 ± 2.4 years, and 16 patients had reached the endpoint (≥50% eGFR decline or ESRD) during the follow-up period.
3.2. Serum UA Cut-Off Value as a Predictor of Kidney Disease Progression
We performed ROC analyses to identify the optimal UA cut-off value for discriminating a ≥50% eGFR decline or ESRD during the follow-up examination, and the results showed that it was 7.1 mg/dL (AUC = 0.74, sensitivity = 62.5%, specificity = 90.6%, Figure 2).
3.3. Comparison between the Clinical Findings According to Serum UA Value Groups in the Total Cohort
We compared the clinical characteristics of the two groups established according to UA value at baseline (Table 1). The baseline serum UA (7.8 ± 0.6 vs. 5.0 ± 1.2 mg/dL, P ≤ 0.0001), SBP (130.0 ± 7.8 vs. 123.9 ± 7.8 mmHg, P = 0.002), DBP (80.5 ± 5.2 vs. 75.6 ± 6.1 mmHg, P = 0.001), MBP (97.0 ± 5.9 vs. 91.7 ± 6.4 mmHg, P = 0.0009), VFA (158.8 ± 75.4 vs. 108.9 ± 56.0 cm2, P = 0.0008), and UACR (649.7 ± 1035.8 vs. 158.1 ± 343.6 mg/g Cr, P = 0.0002) values of the HU group were significantly higher than in the non-HU group, and the eGFR (43.8 ± 19.0 vs. 67.6 ± 17.6 mL/min/1.73 m2, P ≤ 0.0001) and HDL-C (51.3 ± 15.5 vs. 60.7 ± 16.8 mg/dL, P = 0.02) values of the HU group were significantly lower

Table 1. Patient characteristics according to baseline serum uric acid levels (total cohort n = 122).
Continuous values are expressed as means ± standard deviation. Count data are expressed as percentages. Abbreviation: n, number; HU, Hyperuricemia; UA, Uric Acid; SBP, systolic blood pressure; DBP, diastolic blood pressure; MBP, mean blood pressure; BMI, body mass index; IMT, maximum carotid intima-media thickness; eGFR, estimated glomerular filtration rate; UACR, urine albumin-to-creatinine ratio.
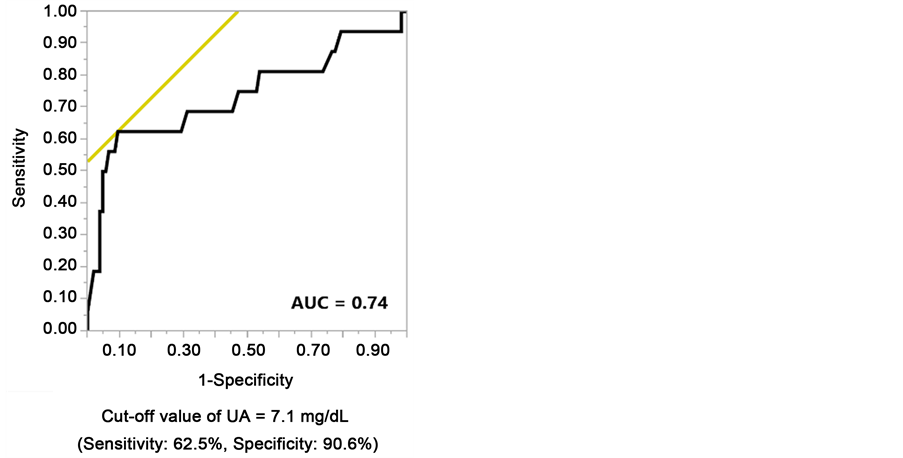
Figure 2. Receiver operating characteristic analysis to identify the optimal serum uric acid cut-off value for predicting an eGFR decline by ≥50% from baseline or end-stage renal disease during the follow-up examination period.
than in the non-HU group. The percentage of males (70.0% vs. 33.3%, P = 0.002) was significantly higher in the HU group than in the non-HU group.
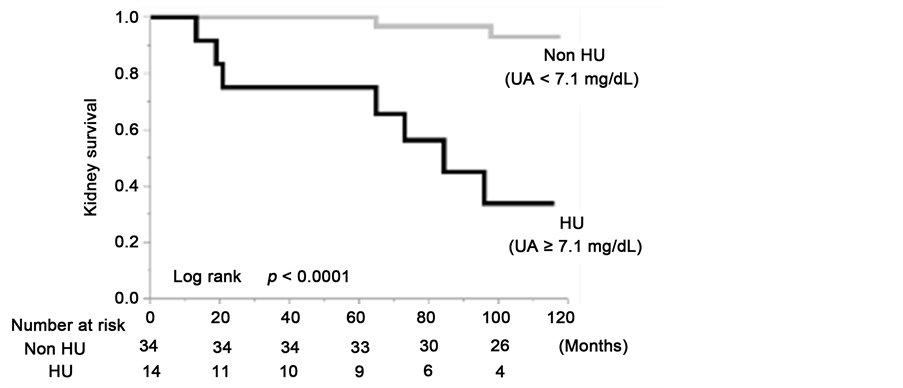
We performed a Kaplan-Meier analysis to assess kidney survival, with a ≥50% eGFR decline or ESRD used as the end-point. The kidney survival curves showed that the kidney survival rate of the CKD patients in the HU group was significantly lower than in the non-HU group (Figure 3(a)). At the 100-month follow- up examination, a decrease in eGFR value of at least a 50% was observed in 64.2% of the HU group (log rank, P ≤ 0.0001). The results of the sex-stratified analyses showed a significantly lower kidney survival rate in the HU group than in the non-HU group (Figure 3(b) and Figure 3(c)).
3.4. HU as a Prognostic Indicator in CKD Patients
To determine whether severe HU (UA ≥ 7.1 mg/dL) was an independent predictor of a decline in renal function, we performed univariate and multivariate regression analyses based on the Cox hazard model for associations between the clinical findings and a ≥50% eGFR decline or ESRD during the follow-up period (Table 2). The results showed significant associations between HU [hazard ratio (HR) = 8.07, 95% CI (2.25 - 33.3), P = 0.001], diabetes mellitus (HR = 8.61, P = 0.003), and UACR (HR = 1.02, P = 0.0005) and a ≥50% eGFR decline or ESRD (Table 2(a)), and sex-stratified analysis yielded similar results. Both in male and female, HU, diabetes mellitus, UACR and eGFR were significantly associated with a ≥50% eGFR decline or ESRD (Table 2(b) and Table 2(c)).
3.5. Correlations between Serum UA Levels and Other Parameters
Since the serum UA values may have been affected by confounders, the baseline serum UA values were tested for correlations with clinical and laboratory para-
 (a)
(a)
 (b)
(b) (c)
(c)
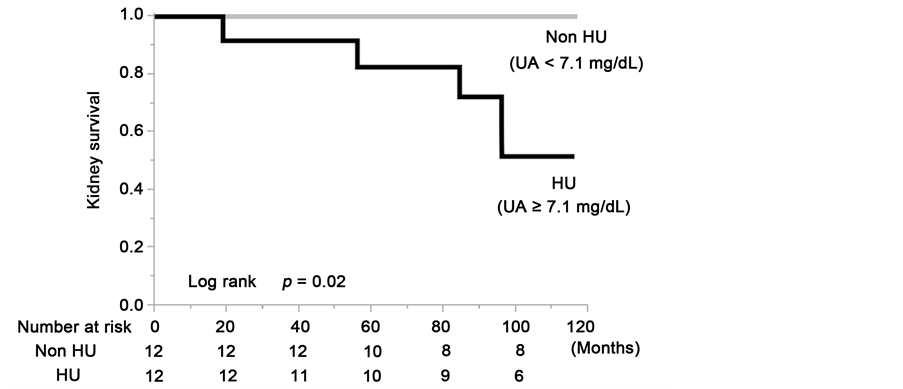
Figure 3. Kidney survival rate of the group with serum uric acid levels ≥7.1 mg/dL and group with serum uric acid levels <7.1 mg/dL in the total cohort (a); the males (b) and the females (c).
(a) (b) (c)
Table 2. Univariate and multivariate analysis of risk factors associated with a ≥50% eGFR decline or ESRD. (a) Total cohort n = 122; (b) male n = 48; (c) female n = 74.
Variables with P-values of less than 0.1 in the univariate model were included in the multivariate model. Abbreviation: ESRD, end-stage renal disease; n, number; CI = confidence interval; IMT, maximum cartoid intima-media thickness; eGFR, estimated glomerular filtration rate; UACR, urine albumin-to- creatinine ratio.
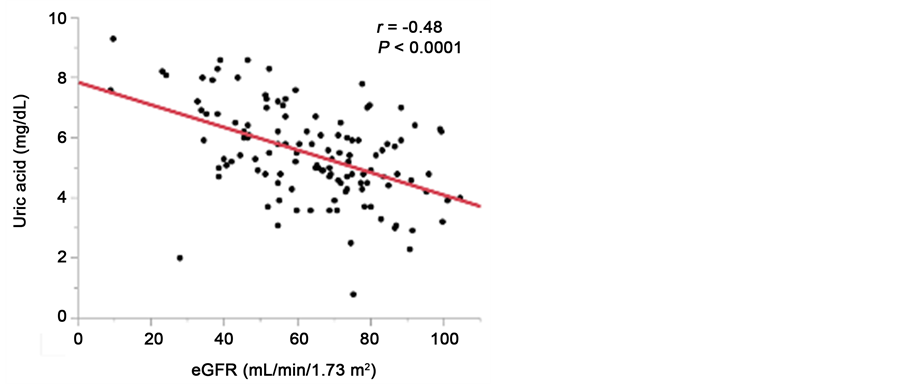
meters at baseline. As shown in Table 3, the UA levels were significantly negatively correlated with both eGFR (r = −0.48, P < 0.0001, Figure 4(a)) and HDL-C (r = −0.29, P = 0.001), and significantly positively correlated with SBP (r = 0.22, P = 0.01), DBP (r = 0.25, P = 0.006), MBP (r = 0.25, P = 0.007), TG (r = 0.29, P = 0.002), UACR (r = 0.25, P = 0.005), VFA (r = 0.32, P = 0.0003, Figure 4(b)), and IMT (r = 0.32, P = 0.0003, Figure 4(c)).
3.6. Comparison between the Clinical and Laboratory Findings in the Groups Established According to Serum UA Levels in the Propensity Score-Matched Cohorts
Since UA was correlated with gender, blood pressure, VFA, and especially with eGFR, we fit propensity score-matched models that included potential modifying variables (sex, eGFR, MBP, VFA) and performed subgroup analyses of the groups. We created a propensity score-matched cohort of HU patients and non-HU patients, and the comparisons between the clinical and laboratory findings of the two groups at baseline are summarized in Table 4. There were no significant differences between the propensity score-matched groups in any of the parameters except those associated with UA levels. The serum UA levels of the HU group (7.6 ± 0.4 mg/dL) were significantly higher than in the non-HU group (5.6 ± 1.5 mg/dL, P = 0.0003). The results of the Kaplan-Meier analysis with a ≥50% eGFR decline or ESRD as the end-point showed that the kidney survival rate of the HU group of CKD patients was significantly lower than in the non-HU group (Figure 5(a)). At the 100-month follow-up examination,
 (a)
(a) (b)
(b)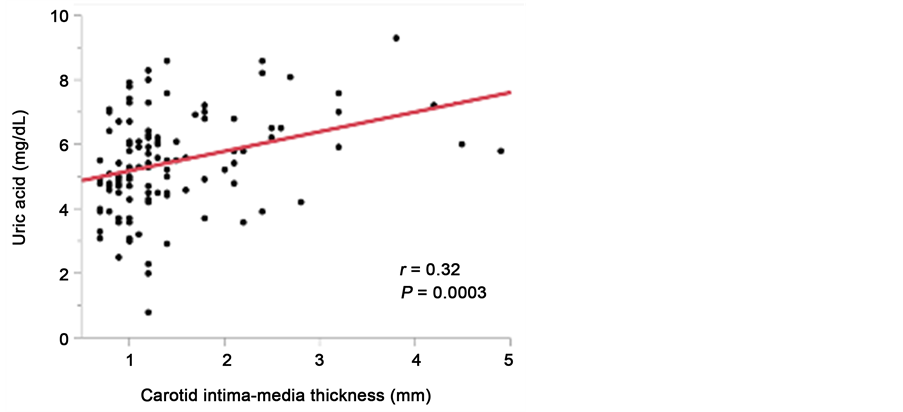 (c)
(c)
Figure 4. Relationship between serum uric acid levels and eGFR (a); visceral fat area (b), and maximum carotid intima-media thickness (c).
 (a)
(a)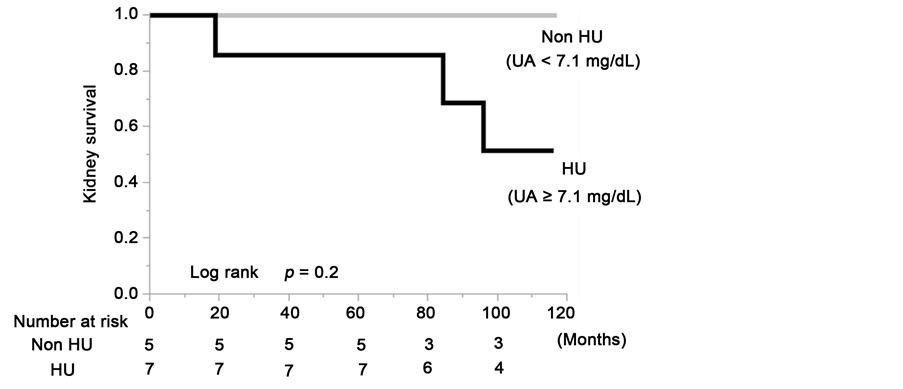 (b)
(b)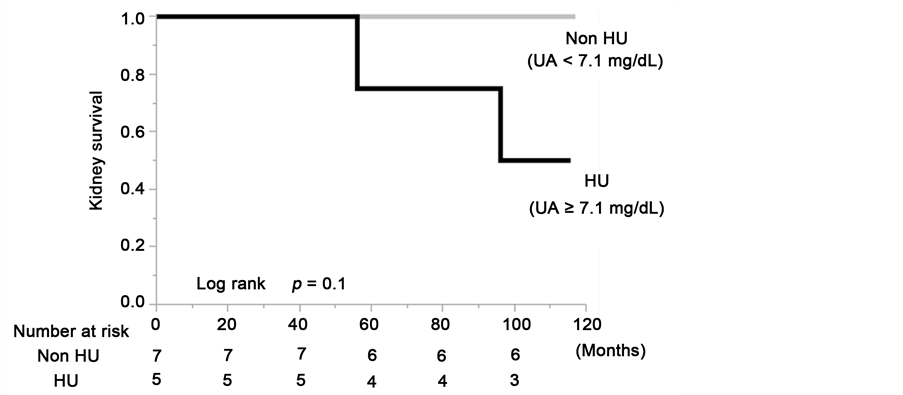 (c)
(c)
Figure 5. Kidney survival rate of the group with serum uric acid levels ≥7.1 mg/dL and group with serum uric acid levels <7.1 mg/dL in the total cohort (a); the males (b) and the females (c) of the propensity score-matched cohort.
Table 3. Coefficients of the correlation between serum uric acid levels and continuous variables.
Abbreviation: n, number; SBP, systolic blood pressure; DBP, diastolic blood pressure; MBP, mean blood pressure; BMI, body mass index; IMT, maximum cartoid intima-media thickness; eGFR, estimated glomerular filtration rate; UACR, urine albumin-to-creatinine ratio.
Table 4. Patient characteristics according to baseline serum uric acid levels. (Propensity score matched cohort n = 24).
Continuous values are expressed as means ± standard deviation. Count data are expressed as percentages. Abbreviation: n, number; HU, Hyperuricemia; UA, Uric Acid; SBP, systolic blood pressure; DBP, diastolic blood pressure; MBP, mean blood pressure; BMI, body mass index; IMT, maximum cartoid intima-media thickness; eGFR, estimated glomerular filtration rate; UACR, urine albumin-to-creatinine ratio.
there was a decrease in eGFR value at least a 50% or ESRD in 48.4% of the HU patients (log rank, P = 0.02). Although there were no statistically significant differences due to the limitation imposed by the small number of cases in the matched cohort, the sex-stratified analyses showed that the kidney survival rate of the CKD patients in the HU group was lower than in the non-HU group (Figure 5(b) and Figure 5(c)).
4. Discussion
The predictive value of UA in regard to the progression of CKD is matter of controversy [5] - [11] . Although a causal role of HU in CKD has not been established [23] [24] , the results of several epidemiologic studies have indicated the existence of an association between HU and the development of CKD [25] [26] . HU has been found to independently predict the progression of kidney disease in nephrosclerosis [4] , diabetic nephropathy [27] [28] , IgA nephropathy [29] [30] [31] [32] , chronic allograft nephropathy [33] , and CKD [10] [26] , and HU has been reported to be associated with atherosclerosis [14] [34] and hypertension [35] . Thus, HU would seem to be associated with atherosclerosis and subsequent risk of hypertension and CKD, but the serum UA elevation in CKD patients makes it difficult to assess the pathophysiological role of UA in the progression of CKD. The present study focused on atherosclerosis/arteriosclerosis- related factors and examined the predictive value of HU in relation to CKD progression by using a propensity score-matching cohort.
The results of this study showed that even when eGFR was completely adjusted by propensity score matching (Table 4), the kidney survival rate of the HU group of CKD patients was significantly lower than in the non-HU group (Figure 5(a), log rank, P = 0.02). Multivariate analysis of the Cox proportional hazards model showed that HU (UA ≥ 7.1 mg/dL) (HR= 8.07, P = 0.001) was significantly associated with a ≥50% eGFR decline or ESRD in the CKD patients (Table 2(a)). Since the BP of our cohort was well controlled (mean SBP/DBP = 125/76 mmHg) with antihypertensive agents (61.5%), hypertension was not a significant prognostic risk factor in this cohort. Rather, not only diabetes mellitus, HU was demonstrated to be a significant prognostic risk factor of CKD progression in this BP-controlled cohort. Women generally have lower UA levels, but it has never been clearly elucidated whether gender difference is involved in kidney disease progression [10] [26] [36] [37] . The results of our ROC analyses showed that the optimal UA cut-off value for discriminating ≥50% eGFR decline or ESRD in the total cohort was 7.1 mg/dL and because of the limitation of the small numbers of cases it was impossible to detect a gender difference at the cut- off value. However, our sex-stratified Kaplan-Meier survival curves and multivariate regression analyses based on the Cox hazard model showed similar significant associations between HU (UA ≥ 7.1 mg/dL) and a ≥50% eGFR decline or ESRD in both males and females (Table 2, Figure 3).
The results of the present study showed that UA was significantly correlated with VFA and with IMT (Figure 4(b) and Figure 4(c)). Recent experimental studies have indicated that UA may play a role in the pathogenesis of atherosclerosis and metabolic syndrome via the inflammatory pathway in adipose tissue [38] [39] . Several clinical studies have reported finding that a significant association between HU and VFA [40] [41] and that HU is a risk factor for carotid atherosclerosis [14] . Nakagawa et al. [42] reported finding evidence suggesting that HU might have a causal role in the development of obesity, metabolic syndrome, and endothelial dysfunction in rats fed a high-fructose, atherogenic [43] , diet. The results of our study also indicate the existence of pathophysiological relationships between UA and VFA/IMT/CKD progression the same as in these other studies. We have to pay attention to the possibility that IMT and VFA are potential confounding factors or predictive markers for progression of kidney disease. The results of our multivariate analysis of the Cox proportional hazards model adjusted for eGFR, VFA and IMT indicated that HU was independently associated with a ≥50% eGFR decline or ESRD (Table 2(a)), and the propensity score matched cohort, in which both VFA and IMT were higher in non-HU group (Table 4), showed that the kidney survival rate of the HU group of CKD patients was significantly lower than in the non-HU group (Figure 5(a)). These results indicate the most important finding that UA is an independent kidney outcome predictor. Although the mechanism of the effects of HU on atherosclerosis has not been fully elucidated, recent data have shown a direct harmful effect of UA on endothelial cells [42] [44] and smooth muscle cells [45] [46] . The precise mechanism of the nephrotoxicity of HU also remains unknown. However, HU has been found to induce systemic hypertension and afferent arteriolar sclerosis in animal models [47] [48] , and high serum UA levels have been reported to be associated with renal arteriolosclerosis in humans [4] [49] [50] . These reports support the results of the present study.
The present study had several limitations. First, it was an observational study and had the typical limitations of a small number of subjects. Second, even if we used a propensity score-matched cohort as a control group, it is difficult to select a desirable control group.
5. Conclusion
The results obtained by using a propensity score-matched cohort in the present study showed that HU is an independent predictor of CKD progression. In addition to treatment of hypertension, treatment of HU in CKD patients will become more important.
Disclosure
All authors have no conflict of interest to disclose.
Cite this paper
Kamiyama, M., Kataoka, H., Moriyama, T., Mochizuki, T. and Nitta, K. (2017) Hyperuricemia as a Predictor of Progression of Chronic Kidney Disease: A Matched Cohort Analysis. International Journal of Clinical Medicine, 8, 178-197. https://doi.org/10.4236/ijcm.2017.83018
References
- 1. Nenov, V.D., Taal, M.W., Sakharova, O.V. and Brenner, B.M. (2000) Multi-Hit Nature of Chronic Renal Disease. Current Opinion in Nephrology and Hypertension, 29, 85-97.
https://doi.org/10.1097/00041552-200003000-00001 - 2. Taal, M.W. and Brenner, B.M. (2006) Predicting Initiation and Progression of Chronic Kidney Disease: Developing Renal Risk Scores. Kidney International, 70, 1694-1705.
https://doi.org/10.1038/sj.ki.5001794 - 3. Goicoechea, M., Garcia de Vinuesa, S., Verdalles, U., Verde, E., Macias, N., et al. (2015) Allopurinol and Progression of CKD and Cardiovascular Events: Long-Term Follow-Up of a Randomized Clinical Trial. American Journal of Kidney Diseases, 65, 543-549.
https://doi.org/10.1053/j.ajkd.2014.11.016 - 4. Momoki, K., Kataoka, H., Moriyama, T., Mochizuki, T. and Nitta, K. (2016) Hyperuricemia as a Predictive Marker for Progression of Nephrosclerosis: Clinical Assessment of Prognostic Factors in Biopsy-Proven Arterial/Arteriolar Nephrosclerosis. Journal of Atherosclerosis and Thrombosis.
- 5. Dousdampanis, P., Trigka, K., Musso, C.G. and Fourtounas, C. (2014) Hyperuricemia and Chronic Kidney Disease: An Enigma Yet to Be Solved. Renal Failure, 36, 1351-1359.
https://doi.org/10.3109/0886022X.2014.947516 - 6. Giordano, C., Karasik, O., King-Morris, K. and Asmar, A. (2015) Uric Acid as a Marker of Kidney Disease: Review of the Current Literature. Disease Markers, 2015, 382918.
https://doi.org/10.1155/2015/382918 - 7. Borghi, C., Rosei, E.A., Bardin, T., Dawson, J., Dominiczak, A., Kielstein, J.T., et al. (2015) Serum Uric Acid and the Risk of Cardiovascular and Renal Disease. Journal of Hypertension, 33, 1729-1741.
https://doi.org/10.1097/HJH.0000000000000701 - 8. Nacak, H., van Diepen, M., Qureshi, A.R., Carrero, J.J., Stijnen, T., et al. (2015) Uric Acid is Not Associated with Decline in Renal Function or Time to Renal Replacement Therapy Initiation in a Referred Cohort of Patients with Stage III, IV and V Chronic Kidney Disease. Nephrology Dialysis Transplantation, 30, 2039-2045.
https://doi.org/10.1093/ndt/gfv225 - 9. Uchida, S., Chang, W.X., Ota, T., Tamura, Y., Shiraishi, T., Kumagai, T., et al. (2015) Targeting Uric Acid and the Inhibition of Progression to End-Stage Renal Disease—A Propensity Score Analysis. PLoS One, 10, e0145506.
https://doi.org/10.1371/journal.pone.0145506 - 10. Iseki, K., Ikemiya, Y., Inoue, T., Iseki, C., Kinjo, K. and Takishita, S. (2004) Significance of Hyperuricemia as a Risk Factor for Developing ESRD in a Screened Cohort. American Journal of Kidney Diseases, 44, 642-650.
https://doi.org/10.1016/S0272-6386(04)00934-5 - 11. Madero, M., Sarnak, M.J., Wang, X., Greene, T., Beck, G.J., Kusek, J.W., et al. (2009) Uric Acid and Long-Term Outcomes in CKD. American Journal of Kidney Diseases, 53, 796-803.
https://doi.org/10.1053/j.ajkd.2008.12.021 - 12. Takahashi, S., Yamamoto, T., Tsutsumi, Z., Moriwaki, Y., Yamakita, J. and Higashino, K. (1997) Close Correlation between Visceral fat Accumulation and Uric Acid Metabolism in Healthy Men. Metabolism, 6, 1162-1165.
- 13. Kanbay, M., Jensen, T., Solak, Y., Le, M., Roncal-Jimenez, C., Rivard, C., et al. (2016) Uric Acid in Metabolic Syndrome: From an Innocent Bystander to a Central Player. European Journal of Internal Medicine, 29, 3-8.
- 14. Ishizaka, N., Ishizaka, Y., Toda, E., Nagai, R. and Yamakado, M. (2005) Association between Serum Uric Acid, Metabolic Syndrome, and Carotid Atherosclerosis in Japanese Individuals. Arteriosclerosis, Thrombosis, and Vascular Biology, 25, 1038-1044.
https://doi.org/10.1161/01.ATV.0000161274.87407.26 - 15. Levey, A.S., Eckardt, K.U., Tsukamoto, Y., Levin, A., Coresh, J., Rossert, J., et al. (2005) Definition and Classification of Chronic Kidney Disease: A Position Statement from Kidney Disease: Improving Global Outcomes (KDIGO). Kidney International, 67, 2089-2100.
https://doi.org/10.1111/j.1523-1755.2005.00365.x - 16. Matsuo, S., Imai, E., Horio, M., Yasuda, Y., Tomita, K., Nitta, K., et al. (2009) Revised Equations for Estimated GFR from Serum Creatinine in Japan. American Journal of Kidney Diseases, 53, 982-992.
https://doi.org/10.1053/j.ajkd.2008.12.034 - 17. Spooner, R.J., Weir, R.J. and Frier, B.M. (1987) Detection of Microalbuminuria in Diabetic Patients Using a Simple Latex Agglutination Test. Clinica Chimica Acta, 166, 247-253.
- 18. Lash, T.L., Mor, V., Wieland, D., Ferrucci, L., Satariano, W. and Silliman, R.A. (2007) Methodology, Design, and Analytic Techniques to Address Measurement of Comorbid Disease. Journal of Gerontology Series A: Biological Sciences and Medical Sciences, 62, 281-285.
https://doi.org/10.1093/gerona/62.3.281 - 19. Ording, A.G. and Sorensen, H.T. (2013) Concepts of Comorbidities, Multiple Morbidities, Complications, and Their Clinical Epidemiologic Analogs. Clinical Epidemiology, 5, 199-203.
https://doi.org/10.2147/CLEP.S45305 - 20. Borkan, G.A., Gerzof, S.G., Robbins, A.H., Hults, D.E., Silbert, C.K. and Silbert, J.E. (1982) Assessment of Abdominal Fat Content by Computed Tomography. American Journal of Clinical Nutrition, 36, 172-177.
- 21. Grauer, W.O., Moss, A.A., Cann, C.E. and Goldberg, H.I. (1984) Quantification of Body Fat Distribution in the Abdomen Using Computed Tomography. American Journal of Clinical Nutrition, 39, 631-637.
- 22. De Bray, J.M., Baud, J.M., Delanoy, P., Camuzat, J.P., Dehans, V., Descamp-Le Chevoir, J., et al. (1998) Reproducibility in Ultrasonic Characterization of Carotid Plaques. Cerebrovascular Diseases, 8, 273-277.
https://doi.org/10.1159/000015865 - 23. Liang, M.H. and Fries, J.F. (1978) Asymptomatic Hyperuricemia: The Case for Conservative Management. Annals of Internal Medicine, 88, 666-670.
https://doi.org/10.7326/0003-4819-88-5-666 - 24. Bose, B., Badve, S.V., Hiremath, S.S., Boudville, N., Brown, F.G., Cass, A., et al. (2014) Effects of Uric Acid-Lowering Therapy on Renal Outcomes: A Systematic Review and Meta-Analysis. Nephrology Dialysis Transplantation, 29, 406-413.
https://doi.org/10.1093/ndt/gft378 - 25. Weiner, D.E., Tighiouart, H., Elsayed, E.F., Griffith, J.L., Salem, D.N. and Levey, A.S. (2008) Uric Acid and Incident Kidney Disease in the Community. Journal of American Society of Nephrology, 19, 1204-1211.
https://doi.org/10.1681/ASN.2007101075 - 26. Bellomo, G., Venanzi, S., Verdura, C., Saronio, P., Esposito, A. and Timio, M. (2010) Association of Uric Acid with Change in Kidney Function in Healthy Normotensive Individuals. American Journal of Kidney Diseases, 56, 264-272.
https://doi.org/10.1053/j.ajkd.2010.01.019 - 27. Zoppini, G., Targher, G., Chonchol, M., Ortalda, V., Abaterusso, C., Pichiri, I., et al. (2012) Serum Uric Acid Levels and Incident Chronic Kidney Disease in Patients with Type 2 Diabetes and Preserved Kidney Function. Diabetes Care, 35, 99-104.
https://doi.org/10.2337/dc11-1346 - 28. Ficociello, L.H., Rosolowsky, E.T., Niewczas, M.A., Maselli, N.J., Weinberg, J.M, Aschengrau, A., et al. (2010) High-Normal Serum Uric Acid Increases Risk of Early Progressive Renal Function Loss in Type 1 Diabetes: Results of a 6-Year Follow-Up. Diabetes Care, 33, 1337-1343.
https://doi.org/10.2337/dc10-0227 - 29. Ohno, I., Hosoya, T., Gomi, H., Ichida, K., Okabe, H. and Hikita, M. (2001) Serum Uric Acid and Renal Prognosis in Patients with IgA Nephropathy. Nephron, 87, 333-339.
https://doi.org/10.1159/000045939 - 30. Syrjanen, J., Mustonen, J. and Pasternack, A. (2000) Hypertriglyceridaemia and Hyperuricaemia Are Risk Factors for Progression of IgA Nephropathy. Nephrology Dialysis Transplantation, 5, 34-42.
https://doi.org/10.1093/ndt/15.1.34 - 31. Wu, J., Chen, X., Xie, Y., Yamanaka, N., Shi, S., Wu, D., et al. (2005) Characteristics and Risk Factors of Intrarenal Arterial Lesions in Patients with IgA Nephropathy. Nephrology Dialysis Transplantation, 20, 719-727.
https://doi.org/10.1093/ndt/gfh716 - 32. Moriyama, T., Itabashi, M., Takei, T., Kataoka, H., Sato, M., Shimizu, A., et al. (2015) High Uric Acid Level Is a Risk Factor for Progression of IgA Nephropathy with Chronic Kidney Disease Stage G3a. Journal of Nephrology, 28, 451-456.
https://doi.org/10.1007/s40620-014-0154-0 - 33. Akalin, E., Ganeshan, S.V., Winston, J. and Muntner, P. (2008) Hyperuricemia Is Associated with the Development of the Composite Outcomes of New Cardiovascular Events and Chronic Allograft Nephropathy. Transplantation, 86, 652-658.
https://doi.org/10.1097/TP.0b013e3181814f5b - 34. Takayama, S., Kawamoto, R., Kusunoki, T., Abe, M. and Onji, M. (2012) Uric Acid Is an Independent Risk Factor for Carotid Atherosclerosis in a Japanese Elderly Population without Metabolic Syndrome. Cardiovascular Diabetology, 11, 2.
https://doi.org/10.1186/1475-2840-11-2 - 35. Taniguchi, Y., Hayashi, T., Tsumura, K., Endo, G., Fujii, S. and Okada, K. (2001) Serum Uric Acid and the Risk for Hypertension and Type 2 Diabetes in Japanese Men: The Osaka Health Survey. Journal of Hypertension, 19, 1209-1215.
https://doi.org/10.1097/00004872-200107000-00005 - 36. Guo, M., Niu, J.Y., Li, S.R., Ye, X.W., Fang, H., Zhao, Y.P., et al. (2015) Gender Differences in the Association between Hyperuricemia and Diabetic Kidney Disease in Community Elderly Patients. Journal of Diabetes Complications, 29, 1042-1049.
- 37. Fessel, W.J. (1979) Renal Outcomes of Gout and Hyperuricemia. American Journal of Medicine, 67, 74-82.
- 38. Baldwin, W., McRae, S., Marek, G., Wymer, D., Pannu, V., Baylis, C., et al. (2011) Hyperuricemia as a Mediator of the Proinflammatory Endocrine Imbalance in the Adipose Tissue in a Murine Model of the Metabolic Syndrome. Diabetes, 60, 1258-1269.
https://doi.org/10.2337/db10-0916 - 39. Tsushima, Y., Nishizawa, H., Tochino, Y., Nakatsuji, H., Sekimoto, R., Nagao, H., et al. (2013) Uric Acid Secretion from Adipose Tissue and Its Increase in Obesity. Journal of Biological Chemistry, 288, 27138-27149.
https://doi.org/10.1074/jbc.M113.485094 - 40. Yamada, A., Sato, K.K., Kinuhata, S., Uehara, S., Endo, G., Hikita, Y., et al. (2016) Association of Visceral Fat and Liver Fat with Hyperuricemia. Arthritis Care and Research, 68, 553-561.
https://doi.org/10.1002/acr.22729 - 41. Matsuura, F., Yamashita, S., Nakamura, T., Nishida, M., Nozaki, S., Funahashi, T., et al. (1998) Effect of Visceral Fat Accumulation on Uric Acid Metabolism in Male Obese Subjects: Visceral Fat Obesity Is Linked More Closely to Overproduction of Uric Acid than Subcutaneous Fat Obesity. Metabolism, 47, 929-933.
- 42. Nakagawa, T., Hu, H., Zharikov, S., Tuttle, K.R., Short, R.A., Glushakova, O., et al. (2006) A Causal Role for Uric Acid in Fructose-Induced Metabolic Syndrome. American Journal of Physiology Renal Physiology, 290, F625-F631.
https://doi.org/10.1152/ajprenal.00140.2005 - 43. Kataoka, H., Ariyama, Y., Deushi, M., Osaka, M., Nitta, K. and Yoshida, M. (2016) Inhibitory Effect of Serotonin Antagonist on Leukocyte-Endothelial Interactions in Vivo and in Vitro. PLoS ONE, 11, e0147929.
https://doi.org/10.1371/journal.pone.0147929 - 44. Sanchez-Lozada, L.G., Lanaspa, M.A., Cristobal-Garcia, M., Garcia-Arroyo, F., Soto, V., Cruz-Robles, D., et al. (2012) Uric Acid-Induced Endothelial Dysfunction Is Associated with Mitochondrial Alterations and Decreased Intracellular ATP Concentrations. Nephron Experimental Nephrology, 121, e71-e78.
https://doi.org/10.1159/000345509 - 45. Corry, D.B., Eslami, P., Yamamoto, K., Nyby, M.D., Makino, H. and Tuck, M.L. (2008) Uric Acid Stimulates Vascular Smooth Muscle Cell Proliferation and Oxidative Stress via the Vascular Renin-Angiotensin System. Journal of Hypertension, 26, 269-275.
https://doi.org/10.1097/HJH.0b013e3282f240bf - 46. Kanellis, J., Watanabe, S., Li, J.H., Kang, D.H., Li, P., Nakagawa, T., et al. (2003) Uric Acid Stimulates Monocyte Chemoattractant Protein-1 Production in Vascular Smooth Muscle Cells via Mitogen-Activated Protein Kinase and Cyclooxygenase-2. Hypertension, 41, 1287-1293.
https://doi.org/10.1161/01.HYP.0000072820.07472.3B - 47. Mazzali, M., Hughes, J., Kim, Y.G., Jefferson, J.A., Kang, D.H., Gordon, K.L., et al. (2001) Elevated Uric Acid Increases Blood Pressure in the Rat by a Novel Crystal-Independent Mechanism. Hypertension, 38, 1101-1106.
https://doi.org/10.1161/hy1101.092839 - 48. Nakagawa, T., Mazzali, M., Kang, D.H., Kanellis, J., Watanabe, S., Sanchez-Lozada, L.G., et al. (2003) Hyperuricemia Causes Glomerular Hypertrophy in the Rat. American Journal of Nephrology, 23, 2-7.
https://doi.org/10.1159/000066303 - 49. Kojima, C., Takei, T., Ogawa, T. and Nitta, K. (2012) Serum Complement C3 Predicts Renal Arteriolosclerosis in Non-Diabetic Chronic Kidney Disease. Journal of Atherosclerosis Thrombosis, 19, 854-861.
https://doi.org/10.5551/jat.12286 - 50. Kohagura, K., Kochi, M., Miyagi, T., Kinjyo, T., Maehara, Y., Nagahama, K., et al. (2013) An Association between Uric Acid Levels and Renal Arteriolopathy in Chronic Kidney Disease: A Biopsy-Based Study. Hypertension Research, 36, 43-49.
https://doi.org/10.1038/hr.2012.135