Natural Resources
Vol.4 No.3(2013), Article ID:33877,20 pages DOI:10.4236/nr.2013.43036
Water Desalination Using a Humidification-Dehumidification Technique—A Detailed Review
![]()
1Mechanical Power Engineering Department, Faculty of Engineering, Tanta University, Tanta, Egypt; 2Mechanical Engineering Department, Faculty of Engineering, Kafrelsheikh University, Kafelsheikh, Egypt; 3Mechanical Engineering Department, Faculty of Engineering, Islamic University, Madina, KSA.
Email: kabeel6@hotmail.com, mofrehhh@yahoo.com
Copyright © 2013 A. E. Kabeel et al. This is an open access article distributed under the Creative Commons Attribution License, which permits unrestricted use, distribution, and reproduction in any medium, provided the original work is properly cited.
Received January 2nd, 2013; revised April 26th, 2013; accepted May 19th, 2013
Keywords: Humidification; Dehumidification; Distillation; System; Heat Exchanger
ABSTRACT
Solar humidification-dehumidification desalination technology has been reviewed in detail in this paper. This review would also throw light on the scope for further research and recommendations in active distillation system by humidification and dehumidification (HDH). Also in this article, a review has been done on different types of (HDH) systems. Thermal modeling was done for various types of humidification and dehumidification (HDH) distillation system. From the present review, it is found that the humidification-dehumidification desalination process HDH will be a suitable choice for fresh water production when the demand is decentralized. HDH is a low temperature process where total required thermal energy can be obtained from solar energy. Capacity of HDH units is between that produced by conventional methods and solar stills. Moreover, HDH is distinguished by simple operation and maintenance. Also from the present condensed review, it was observed that an increase in evaporator and condenser surface areas significantly improves system productivity. But prior to implementing any techniques in design improvement, it is necessary to optimize the MEH unit by optimizing its component size to understand the effect of feed water and air flow rates. Although a fair amount of simulation studies have been conducted in the past, further design simulation is required to fully understand the complicated effects of air and water flow rates, the optimum size of individual components or modules of the unit and to generate a comprehensive model for the system.
1. Introduction
The availability of drinking water is reducing day by day; whereas the requirement of drinking water is increasing rapidly. All over the world, access to potable water to the people is narrowing down day by day. Most of the human diseases are due to polluted or non-purified water resources. Even today, developed countries and developing countries face a huge water scarcity because of unplanned mechanism and pollution created by artificial activities. The shortage of drinking water is expected to be the biggest problem of the world in this century due to unsustainable consumption rates and population growth. Pollution of fresh water resources (rivers, lakes and underground water) by industrial wastes has heightened the problem. The total amount of global water reserves is about 1.4 billion cubic kilometers. Oceans constitute about 97.5% of the total amount, and the remaining 2.5% fresh water is present in the atmosphere, polar ice, and ground water. This means that only about 0.014% is directly available to human beings and other organisms [1]. So, development of new clean water sources is very important and urgent. Desalination of sea and/or brackish water is an important alternative, since the only unlimited source of water is the ocean. Besides the problem of water shortage, process energy constitutes another problem area. Desalination processes require significant amount of energy. It was estimated that the production of 1 million cubic meter of water per day requires 10 million tons of oil per year [2]. Due to high cost of conventional energy sources, environmentally harmful, renewable energy sources (particularly solar energy) have gained more attraction since their use in desalination plants. This will save conventional energy for other applications, reduce environmental pollution and provide free, continuous, and low maintenance energy source.
2. Desalination Processes
Different types of water desalination processes have been developed. Figure 1 illustrates the different types of desalination processes. Mainly desalination processes can be classified into the following two categories: phase change (thermal processes) and single phase (membrane processes).
In the phase change process a thermal energy source, such as fossil fuels, nuclear energy or solar energy may be used to evaporate water, which is condensed to provide fresh water. The phase change desalination processes described here include, solar distiller, Multi-Stage Flash (MSF) distillation, Multi-Effect (ME) distillation, Vapor Compression (VC) distillation and Freezing distillation. In the single phase processes membranes are used in two commercially important desalination processes, Reverse Osmosis (RO) distillation and Electro Dialysis (ED) distillation.
3. Principle of the HDH Process
The HDH process is based on the fact that air can be mixed with quantities of vapor. Air ability to carry water vapor increases by increasing its temperature. For example, 1 kg of dry air can carry 0.5 kg of vapor and about (2814 kJ) when its temperature increases from 30˚ to 80˚ as reported in [3]. When air flow is in contact with salt water, air extracts a certain quantity of vapor at the expense of the sensible heat of salt water (providing cooling). On the other hand, the distilled water is recovered by maintaining humid air at contact with cooling surface, causing the condensation of a part of the vapor mixed with the air. The condensation occurs in another heat exchanger in which salt water is preheated by latent heat recovery.
The HDH process operates, as any distillation process, with only one cross of salt water (once through). It can also operate with water recirculation. In the first case, the evaporation of 1 kg of water causes a decrease of about 60˚C in 10 kg of salt water. The amount of recovered distilled water varies from 5% to 20% of the quantity of salt water in circulation. This leads to a very low concentration of the salt water but a high sensitive heat loss. In the second case, more concentrated solution and lower energy consumption are obtained [4].
3.1. The Humidification Dehumidification Desalination Technology
The solar HDH is a thermal water desalination method. It is based on evaporation of seawater or brackish water and consecutive condensation of the generated humid air, mostly at the ambient pressure. The solar HDH process is also called the multiple-effect humidification-dehumidification process; solar multistage condensation evaporation cycle (SMCEC) or multiple-effect humidification (MEH) is a technique that simulates the natural water cycle on a shorter time frame by evaporating and condensing water to separate it from other substances. The driving force in this process is the solar thermal energy to produce water vapor, which is later condensed in a sepa-
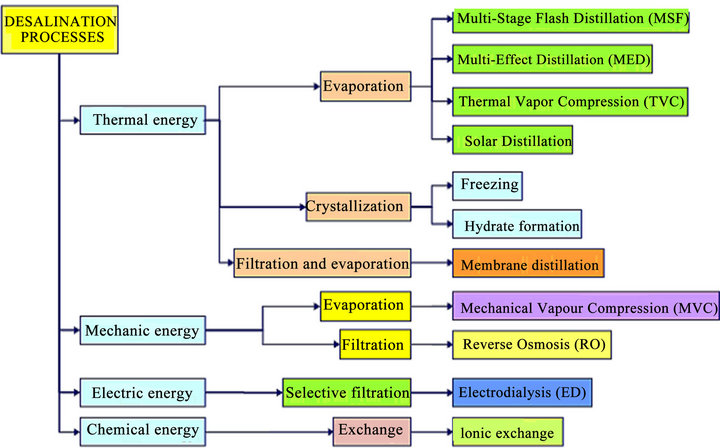
Figure 1. Different types of desalination processes.
rate chamber. In sophisticated systems, waste heat is minimized by collecting the heat from the condensing water vapor and pre-heating the incoming water source. This system is effective for smallto mid-scale desalination systems in many arid and semi-arid countries because of the relative inexpensiveness of solar collectors. The process of HDH desalination, shown in Figure 2 has many advantages such as the simple equipment working under normal pressure, the cost of asset and operation is moderate, the flexible scale, the low-grade energy available, and so on. Therefore, it has a good developing prospect. There is a new hybrid solar desalination system, Figure 3, consisting of a humidification dehumidification unit and single stage flashing evaporation unit [5]. Due to the widespread use of solar desalination systems using HDH over the span of several decades, considerable studies, both experimental as well as theoretical, have been conducted regarding the various aspects of these systems. Furthermore, several studies, observations and recommendations of onsite field engineers, directly involved with the solar desalination systems using HDH process, have also been published. A brief account of the major work concerning the primary objectives of this research is presented in the following section.
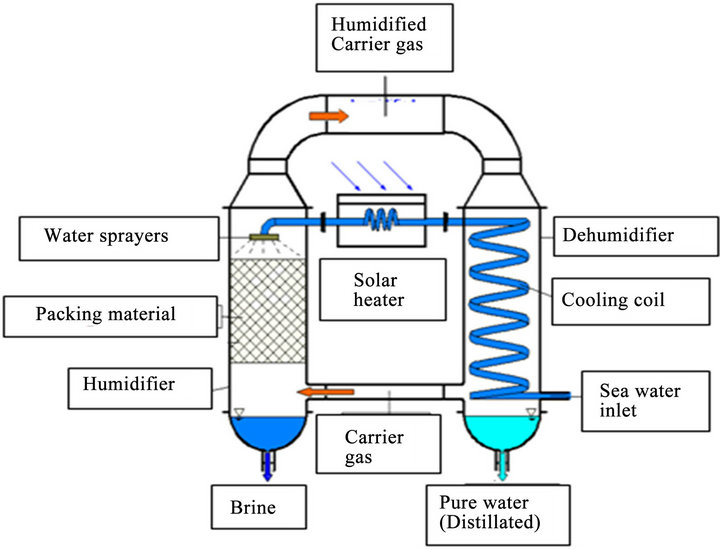
Figure 2. A simple humidification-dehumidification (HDH) process.
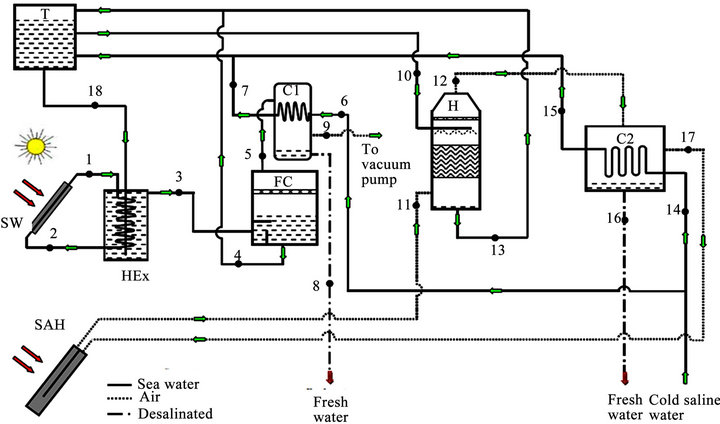
Figure 3. A schematic diagram of the (HDH/SSF) system [5].
3.2. Classifications of HDH Systems
HDH systems are classified under three broad categories according to type of energy used, cycle configuration, and type of heating systems.
HDH systems can be classified based on the form of energy used such as solar, thermal, geothermal, or hybrid systems. This classification brings out the most promising merit of the HDH concept; the promise of water production by use of low grade energy, especially from renewable resources.
Based on the cycle configuration HDH systems are classified, into closed air open water, closed water or open air open water systems. In all these configurations the flow can be either forced or natural as shown in Figure 4.
Based on the stream to be heating, HDH systems are classified into air heated or water heated systems. The performance of the system depends greatly on whether the air or water is heated and this will be discussed in the following subsections. While there are many decades of experience and wisdom on solar water heating devices, relatively little work has been done on the solar collectors for air heating considering their importance to the overall HDH system performance.
3.2.1. Closed-Air Open-Water (CAOW) Water Heated Systems
Sea water enters the system at the dehumidifier and is used to cool and dehumidify a hot, humidified air stream. Sea water gets preheated as the enthalpy of vaporization is transferred to it from the moist air (condensation process). The condensate is removed as product water and the sea water is then further heated in a solar collector or water heater before it enters the humidifier as shown in Figure 5. The hot sea water is used to humidify a colder air stream, so mass and heat are transferred from the hot sea water to the moist air stream (evaporation process) and the remaining sea water is extracted as brine. The air stream circulates continuously in a closed loop between the humidifier and dehumidifier.
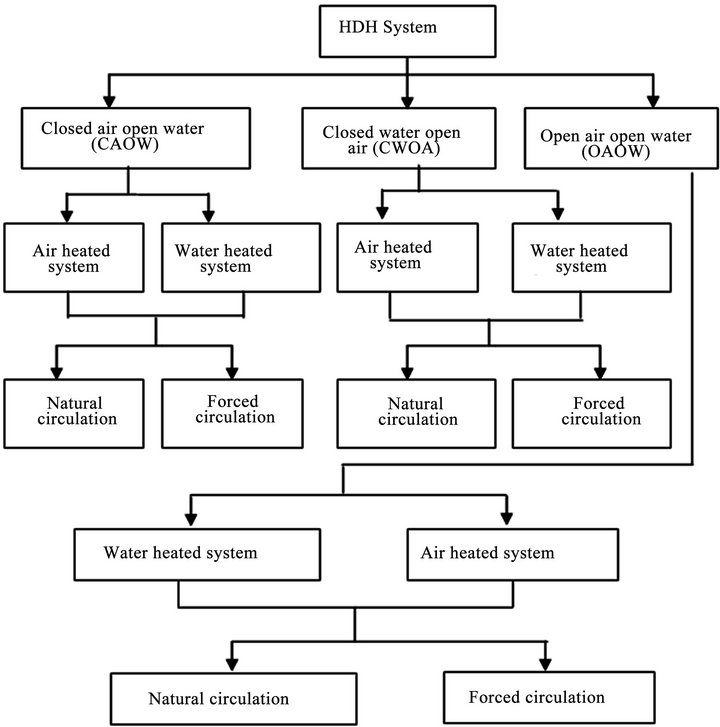
Figure 4. Classification of HDH systems based on the cycle configuration.
3.2.2. Multi Effect Closed-Air Open-Water (CAOW) Water Heated System
To enhance heat recovery, air from the humidifier is extracted at various points and supplied to the dehumidifier at the corresponding point as shown in Figure 6. This enables continuous temperature stratification resulting in a small temperature gap to keep the process running. This in turn results in a higher heat recovery from the dehumidifier. In fact, most of the energy needed for the humidification process is regained from the dehumidifier bringing down the energy demand.
3.2.3. Closed-Water Open-Air, Water Heated (CWOA-WH) System
In this system, after preheating water in the dehumidifier, it enters the solar collector, thus working in a closed loop as shown in Figure 7. The dehumidified air is released to
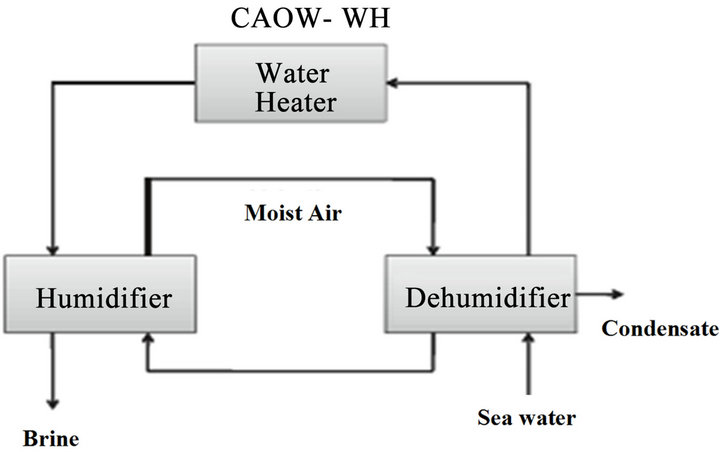
Figure 5. Close air-open water, water heated (CAOW-WH) system.
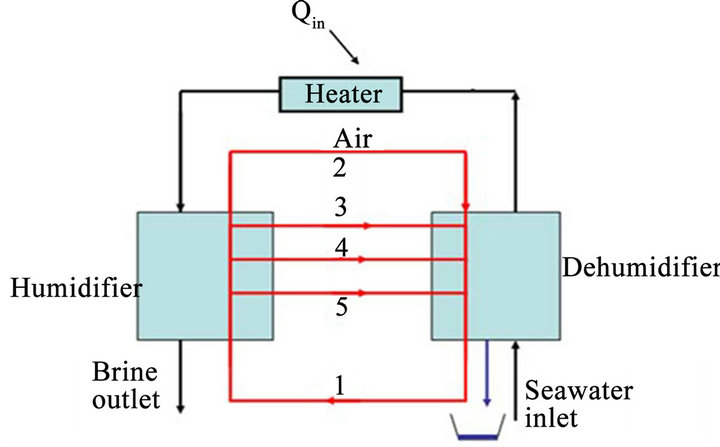
Figure 6. Multi-effect water-heated (CAOW) cycle.
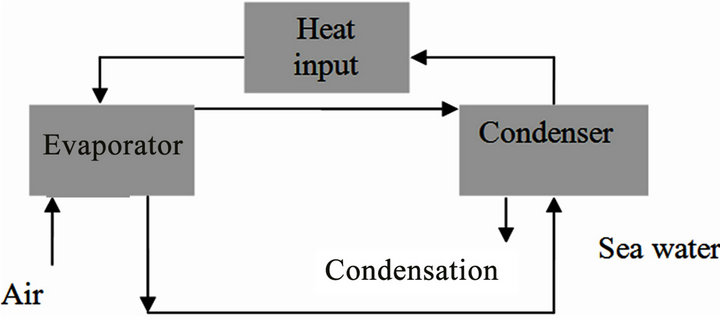
Figure 7. Open-air/closed-water cycle water heated (OACWWH).
be ambient. One disadvantage of the CWOA is that when the humidification process does not sufficiently cool the water, the coolant water temperature to the inlet of the dehumidifier goes up. This limits the dehumidification of the humid air resulting in reduced water production compared to the open water cycle. However, when efficient humidifiers at optimal operating conditions are used, water may be potentially cooled to temperatures below the ambient temperature (up to the limit of the ambient wet-bulb temperature). Under those conditions, the closed water system is more productive than the open water system.
3.2.4. Closed-Air Open-Water Air Heated (CAOW-AH) Systems
Another class of HDH systems which has attracted much interest is the air heated system is the CAOW system. These systems are of two types namely; single and multi-stage systems. Air is heated in a solar collector to a maximum temperature, as shown in Figure 8, and sent to a humidifier. In the humidifier, the air is cooled and saturated. The air is, then, heated after living the humidifier.
3.2.5. Open-Air, Open-Water, Air-Heated (OAOW-AH) Systems
Open-air, open-water (OAOW) cycle is formed when the connection in the air stream between the humidifier and the dehumidifier is broken since the air stream makes a single pass through the system, Figure 9. This cycle op-
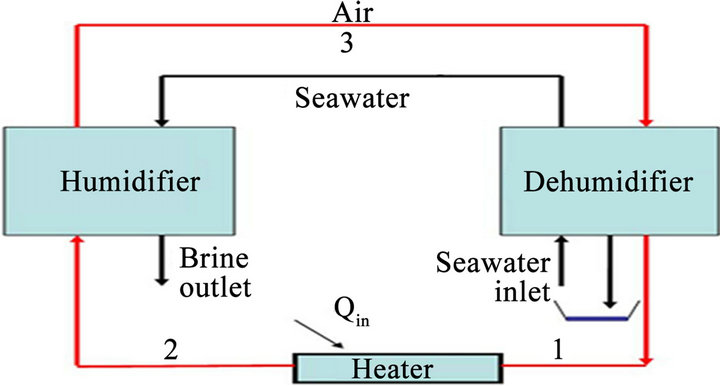
Figure 8. Closed air open water air-heated (OAOW-AH) system.
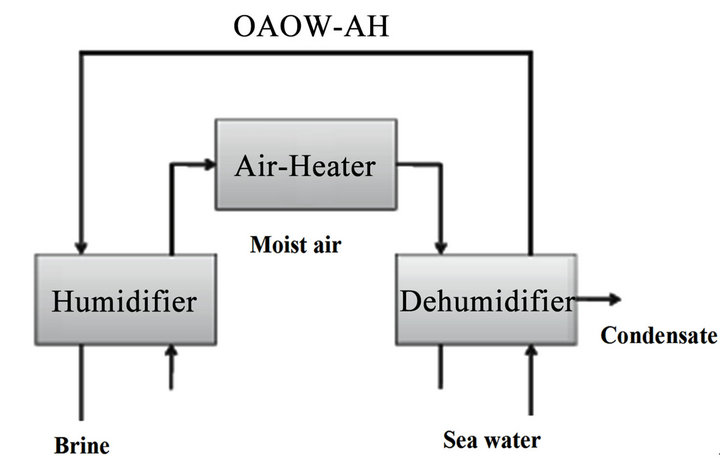
Figure 9. Open air open water air-heated (OAOW-AH) system.
erates in a similar manner to its closed air counterpart. Here, Air heater is placed between the humidifier and dehumidifier in the air stream.
3.2.6. Open-Air, Open-Water, Water Heated (OAOW-WH) Systems
This cycle resembles the open air open water air heated cycle. Both the air and water streams follow the same flow path through the humidifier and dehumidifier but instead of heating the air stream, the heater is placed in the water stream, see Figure 10.
4. The Main Parts of HDH System
System HDH consists of four main parts namely; humidifier, dehumidifier, solar water heater, and solar air hater.
4.1. Humidifiers (Evaporator) in HDH System
In the evaporator of HDH system, the air holds water vapor when hot water is sprayed and the air is needed to be humid as much as possible. As the air is humidified inside the evaporator, the evaporator is also called “humidifier”.
Many devices are used for air humidification, including spray towers, bubble columns, wetted-wall towers, and packed bed towers [6]. The principle of operation for all of these devices is the same. When water is brought into contact with air that is not saturated with water vapor, water diffuses into the air and raises the humidity of the air. The driving force for this diffusion process is the concentration difference between the water-air interface and the water vapor in the air. This concentration difference depends on the vapor pressure at the gas-liquid interface and the partial pressure of water vapor in the air as shown in Figure 11.
The above mentioned devices can be used as a humidifier in the HDH system. A spray tower, for instance, consists essentially of a cylindrical vessel in which water
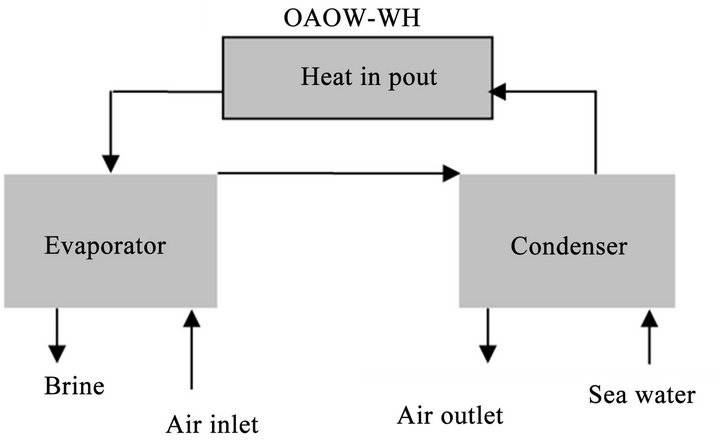
Figure 10. Open air open water air-heated (OAOW-WH) system.
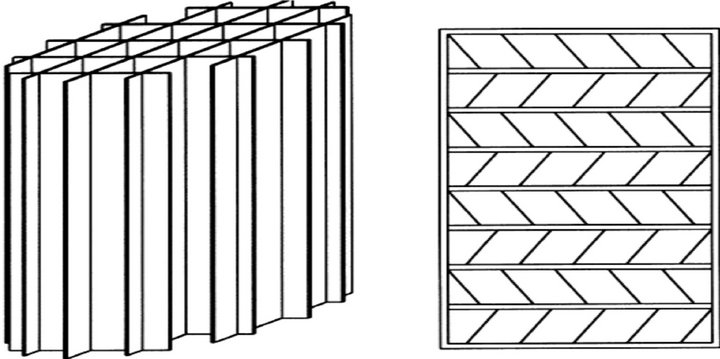
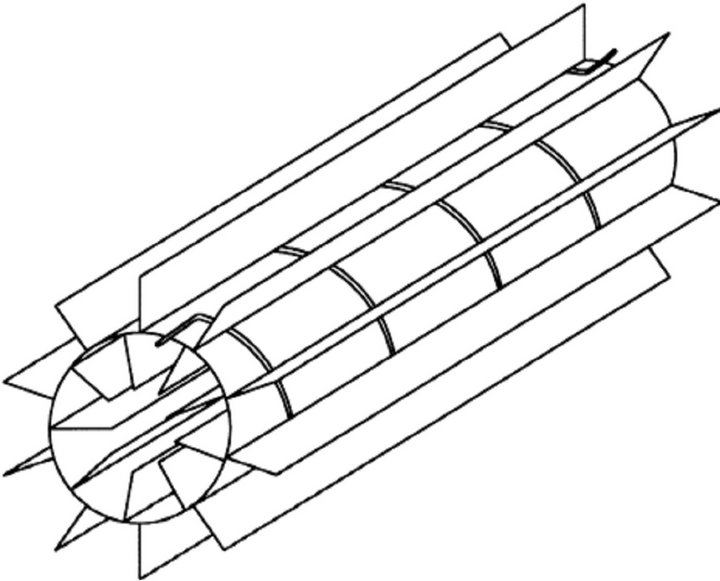
Figure 11. Shape of different wooden packing material used in the desalination by [6].
is sprayed at the top of the vessel and moves downward by gravity as droplets dispersed within a continuous air stream flowing upward. These towers are simple in design and have the minimal pressure drop on the gas side. However, there is a considerable pressure drop on the water side due to the spray nozzles. Also, mist eliminators are always necessary due to the tendency of water entrainment by the air leaving the tower. It is generally known that this device has high capacity but low efficiency. The low efficiency is due to the low water holdup because the loose packing flow [7]. It is also known that the ratio of diameter-to length is one of the important parameters which play a vital role in spray tower design. For a large ratio air is needed to be thoroughly mixed with the spray. While, small ratio will let the spray quickly reach the tower walls, forming a film becoming ineffective as a spray. Therefore, design of spray towers requires knowledge of heat and mass transfer coefficients as well as the contact surface area of the water droplets. Many empirical correlations and design procedures are given by Kreith and Boehm [7].
Younis et al. [8], Orfi et al. [9] and Ben-Amara et al. [10] have used a spray tower as the humidifier in their HDH systems. They have tested the spray tower humidifier by varying the ratio of water-to-dry air mass flow rate and keeping both the inlet water temperature and absolute humidity constant while the inlet air temperature (80˚C) was higher than that of the water sprayed temperature (60˚C). They found that increasing the amount of water sprayed has increased the absolute outlet humidity. However, further increase in the water quantity resulted in air cooling and this condensed some of the water vapor content in the air. This means a decrease in the absolute humidity, although the outlet air is always saturated. Therefore, for air heated HDH cycles, there is an optimum value of the mass flow ratio which gives maximum air humidity. This fact promotes the use of multistage air heater and humidifier combinations to increase the fresh water production.
Amer et al. [11] have designed a humidifier of 200 cm height, 80 cm length, and 50 cm width. A packing material is fixed inside the humidifier to have a surface area of approximately 6 m2. The packing is supported such that it does not block the air flow and remains continuously wet. The water has been sprayed on the packing material using a hydraulic grid. A movable door has been provided to facilitate the changing of packing material easily to achieve a max of productivity of 5.8 l/hr. The humidifier used by Zhania et al. [12] in the desalination prototype is aped on the cross sectional area of the pad is 0.6 m × 0.8 m, while its height is 0.56 m. At the top, there is a liquid distributor, which can feed the pad with hot brackish water coming from solar water collectors while at the bottom there is a liquid collector, where brine is collected as it drains down the pad. Thus, the hot brackish water flows downward, while the air passes in a cross-flow direction. Textile (Viscose) of a 14 m2 (52 m2/m3) surface is used as packing to increase the interface area between the air and water, which form the wetted surface. On the outside, the humidifier is covered with a polyethylene sheet of thickness 15 mm and insulated with a layer of armaflex.
Nafey et al. [13] have used induced fan cooling tower as the system humidifying column with direct air–liquid contact. The tower has a circular cross section area, and its shape has a vertical venturi pipe consisting of four parts made of 0.7 mm thick galvanized steel sheet with a total height of 2.1 m. Eight nozzles are used to spray the hot water at the top of the humidifier. Canvas is used as packing to increase the interface area between the air and water.
Evaporator constructed by Hermosillo et al. [14] is a block of corrugated and properly treated cellulose paper commonly used in evaporative cooling systems. The air flows horizontally while the water drains downwards. The cross section is the same as condenser and the horizontal length is 0.15 m. The specific area is 300 m2/m3, thus giving a total area for evaporation, assuming complete wetting, of 4.2 m2. The whole system is thermally insulated with 0.05 m thick polystyrene foam plates.
Yamali and Solmusf [15] have studied the pad humidifier unit which consists of four pads in series, made of plastic material and it forms the wetted surface of the humidifier. The size of each pad is 35 × 35 × 12 cm. They were mounted vertically in a metal box of 35 cm wide, 60 cm long and 45 cm height. This metal box made of galvanized steel of 2 mm thickness, was constructed by welding and it was thermally insulated. At the top of the box, there is a liquid sprayer, which sprays liquid water to each pad cartridge, while at the bottom there is a water storage tank, where the water is collected as it drains down the pad cartridge. Thus, the water flows downward, while the air passes in a cross flow direction through the openings of the pad Cartridge. The air is humidified as it comes in contact with the wetted surface of the pad.
The humidifier used by Nawayseh et al. [4] was a typical cooling tower with wooden slats packing, as in the two units constructed in Jordan. The wooden slats were fixed in a wooden rectangular frame with an inclination of 45˚ in multiple rows along the whole height of the frame. The dimensions of the frame in the pilot and bench units were 1.0 × 0.18 × 2.0 m and 0.3 × 0.05 × 1.0 m, respectively. These dimensions provided packing surface areas of 14 m2/m3 for the pilot unit and 87 m2/m3 for the bench unit, with a minimum air pressure drop. The true surface area of the packing in the pilot and bench units was 5.04 m2 and 0.96 m2, respectively. In the 3 m high unit, constructed in Malaysia, the packing was made of wooden thin sheets combined in cross arrangement to form six modules of 0.5 m height. The modules were dropped from the top of the unit to form the 3 m height humidifier. The arrangements gave a packing surface area of 11.9 m2 (58 m2/m3).
Exactly opposite, in principle, to the spray tower is the bubble column. In the bubble column, a vessel is filled with water and air bubbles are ejected from several orifices located at the bottom of the vessel. Water diffuses into the air bubbles and causes the outlet air to be humidified. These columns are simple in design; however, the diffusion of water into the air bubbles depends on many parameters such as the bubble diameter, bubble velocity, gas hold-up (the ratio of air bubbles-to-water volume), water and air temperatures as well as the heat and mass transfer coefficients.
In HDH desalination systems, bubble columns have not been used as humidifiers so far. However, El-Agouz and Abugderah [16] have investigated experimentally the performance of a single stage bubble column using air bubbles passing through seawater. They have studied the influence of operating conditions on the vapor content difference and the humidification efficiency. This study showed strong dependence on saline water temperature and the air velocity. Moreover, the inlet air temperature has a small effect on the vapor content difference. The maximum experimentally obtained vapor content difference of the air was 222 g/kg of dry air at 75˚C of both water and air temperatures. However, other geometrical factors such as the orifice diameter, number of orifices, water head and column diameter were not considered. It is important to mention that there are many empirical correlations for these parameters as reported in Treyable [6] and Lydersen [17]. Therefore, an optimum design and performance evaluation study can be carried out before using the bubble columns in HDH systems. Wetted-wall towers have been used as a humidifier in HDH systems by Muller et al. [18] and Orfi et al. [9]. In a wetted-wall tower, a thin film of water is formed running downward inside a vertical pipe, with air flowing either co-currently or counter-currently. Water is loaded into the top of the tower, and a weir distributes the flow of water around the inner perimeter of the tube that wets the inner surface of the tube down its length. Such devices have been used for theoretical studies of mass transfer, since the contact area can be calculated, accurately. In [19] heated water has been distributed onto vertically hanging fleeces made of polypropylene and trickled downwards. The air moves in countercurrent flow to the brine through the humidifier and becomes saturated at the outlet. On the other hand, Orfi et al. [9] have used a different design for their wetted-wall humidifier. To improve the heat and mass exchange process, they covered the wooden vertical wetted-walls with a cotton wick to reduce the water flowing velocity and use the capillary effect to keep the vertical walls always wetted. Their design shows higher performance with about 100% humidification efficiency.
To increase the humidification efficiency, packing is typically used. Since it increases the dispersion of water droplets, the contact area and contact time. Devices that contain packing material are known as packed bed towers and special types that are used to cool water are called cooling towers. These packed bed are simply as vertical columns filled with packing materials and water is sprayed at the top while air flows in counter or crossflow arrangement. Packed bed towers have been used by many researchers as a humidifier device in HDH desalination systems because of the higher effectiveness. Different packing materials have been used as shown in Table 1. The factors influencing the choice of a packing material are its heat and mass transfer performance, the quality of water, pressure drop, cost and durability. Over the last 30 years, a gradual change in the types of fill used in packed bed towers has been done as indicated by Wallis and Aull [19]. The most dramatic change has been done by the introduction of film fills that provide significantly higher thermal performance through the increase of water-to-air contact area and a reduction in pressure drop. However, in HDH desalination applications, due to high fouling potential, these benefits are forfeited and the older splash-type fill packing is used. Mirsky and Bauthier [35] have presented a history of the development of packing materials while Aull and Krell [36] investigated the performance of various film-type fills. The Merkel, Poppe and epsilon-NTU heat and mass transfer methods of analysis are the cornerstone of cooling tower performance evaluation. A critical evaluation and refinement of these methods is given by Kloppers [37] while design and performance evaluation of cooling towers are discussed in somewhat detail by Kroger [38]. To evaluate the performance of humidifier, a definite definition of an efficiency or effectiveness should be used. Many researchers defined humidifier efficiency [9, 16] by,
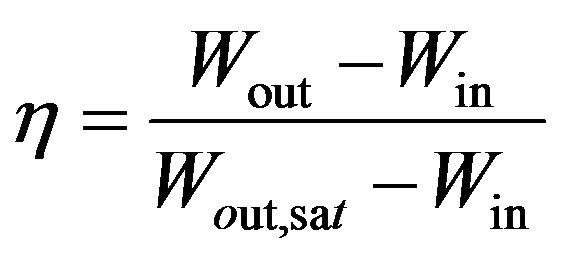 (1)
(1)
where Wout is outlet humidity ratio; win is inlet humidity ratio; and Wout,sat is outlet humidity ratio at saturation. Some figures for packing material are show in Figure 11.
4.2. Dehumidifiers (Condensers) in HDH Systems
For the design of a thermal system, it is often necessary, for selection purposes, to predict the heat transfer rates of heat exchangers under specific operating conditions. Heat exchangers are complex devices, the complexity being due to both to the geometry and to the physical phenomena involved in the transfer of heat. Many experimental studies have been carried out to study the heat and mass transfer characteristics of the dehumidifying heat exchangers.
The condensation tower of 200 cm height, 40 cm length, and 50 cm width has been theoretically and experimentally studied by Amer et al. [11]. A copper tube formed as a coil is used as a condenser of 15 m length and of 1.27 cm outer diameter. Fins are used to increase the surface area of the condenser. The total surface area of the condenser coil and its fins is approximately 6 m2.
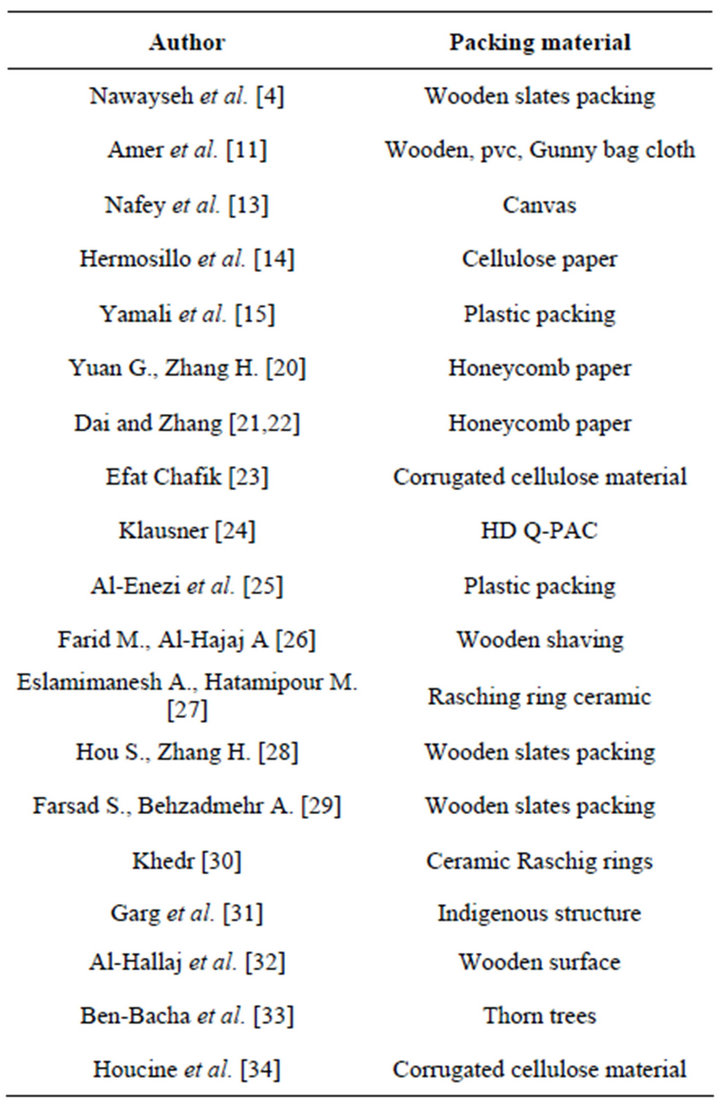
Table 1. Different types of packing materials.
The cooling water flows inside the coil and the air flows over the finned coil inside the condenser cabinet in a counter direction.
Zhania et al. [12] have investigated experimentally a new solar desalination prototype using the humidification–dehumidification principle. In this investigation, the evaporation chamber consists of Nt horizontal tubes made in copper of inner diameter and outer diameter equipped with small holes (1.5 mm diameter) provided on the upper surface of the tube. The holes work as pulverizes that pulverize the hot salt water. To augment the contact surface between air and water, thus, to increase the evaporation rate and to prevent pulverized hot salt water at the top of the evaporation chamber from mixing with the fresh water at the bottom of condensation chamber, each horizontal tube is covered with textile (viscose) of exchange surface aver. The bottom of the evaporation chamber was equipped with a ferry of a size 0.6 × 0.7 × 0.34 m to gather the brine that will be either recycled and combined with the feed solution at the entry point or rejected in case of increase of saltiness rates using an immersed water pump. The cross sectional area of the evaporation chamber is 0.6 × 0.7 m while the height is 1.37 m.
An air cooler heat exchanger is used by Nafey et al. [13] as a dehumidifier. It consists of an extended surface cross flow cooling coil. The condensed fresh water produced drains through a tube connection to the condensate collecting tank. The cooling water flows inside the extended surface tubes. The total number of tubes is 64. The tubes are made of copper of 46 cm length. The extended surface is made of 0.5 mm thick aluminum sheet. The total surface area of the condenser is 20 m2.
Hermosillo et al., [14] have studied water desalination by air humidification. In the experimental study, the condenser portion is a box of 0.305 × 0.305 m of cross section and 0.335 m of length. The heat exchanger inside this box is a liquid-gas type, with water flowing up wards through 105 vertical tubes and air flowing through 57 horizontal fins. The total heat exchange area, is 3.5 m2. The evaporator portion is a box of the same cross section and 0.40 m of length.
Three-air cooler heat exchangers manufactured by Yamali and Solmus [15] with copper tubes and corrugated aluminum fins were used as a dehumidifier. They were connected to each other with copper tubes in series (exit of one cooler was connected to the inlet of the other cooler). The surface area of each condenser is 3.5 m2 (i.e., the total surface area of the dehumidifier is 10.5 m2). In order to prevent air leakage and heat gain, dehumidifier heat exchanger constructed of 2 mm thick galvanized steel of dimensions are 40 × 47 × 34 cm was placed on an insulated metal box by welding.
Nawayseh et al., [4] concluded that, in order to utilize the latent heat of condensation of water efficiently, the condenser area must be made large. The overall heat transfer coefficient of the condenser is expected to be small due to:
1) The low velocity of the air circulated in the unit, even in forced circulation which was necessary to avoid excessive pressure drop.
2) The large reduction in the condensation heat transfer coefficient due to the mass transfer resistance occurring in the process of condensation of water vapor with non-condensable air.
3) The low water side heat transfer coefficient due to the low water flow rate per unit condenser area.
However, a small diameter tube was used to overcome this problem. In the desalination units constructed in Jordan, the condensers were constructed from 1.0 × 0.3 and 2.0 × 1.0 m galvanized steel plates for the bench and pilot units, respectively. In the pilot unit, a copper tube having 11 mm outer diameter and 18 m long was welded to the galvanized plate in a helical shape. The tube outside diameter and length in the bench unit were 8 mm and 3 m, respectively. Either one or two condensers, connected in series, were fixed vertically in one of the ducts in both units. Figure 12 shows sketches of the
 (a)
(a)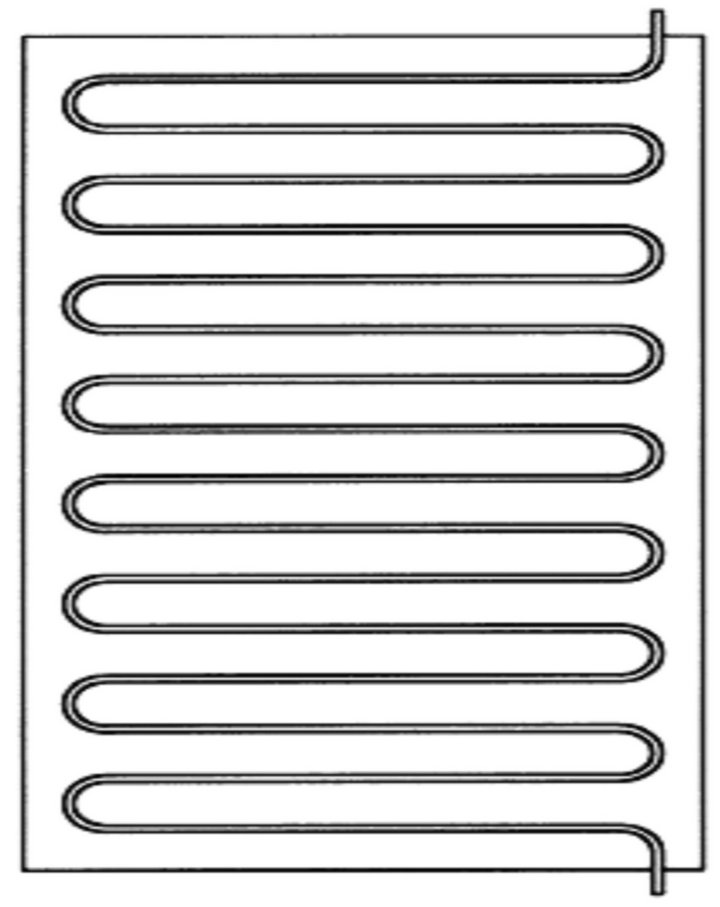 (b)
(b)
Figure 12. Sketch of the common type of condenser used in the desalination [6]. (a) Nawayseh (1996); (b) AI-Hallaj (1994).
condensers used in the units constructed in Malaysia and Jordan. In the pilot unit constructed in Malaysia, the condenser was simply a 3 m long cylinder having a diameter of 170 mm and made of galvanized steel plates. Ten longitudinal fins were soldered to the outer surface of the cylinder and nine similar fins were soldered to the inner surface. The height of the inside and outside fins was 50 mm. The thickness of the plate used to make the cylinder and the fins was 1.0 mm. A 19.2 m long copper tube having 9.5 mm inside diameter was soldered to the surface of the cylinder. The condenser was fixed vertically in the 316 mm diameter PVC pipe which is connected to the humidifier section by two short horizontal PVC pipes.
4.2.1. Plate Fin Tube Heat Exchanger
Plate fin tube heat exchanger is shown in Figure 13. McQuiston [39] has studied the dehumidification in evaporators to correlate the total j factor or sensible j factor with the air flow and heat exchanger characteris-
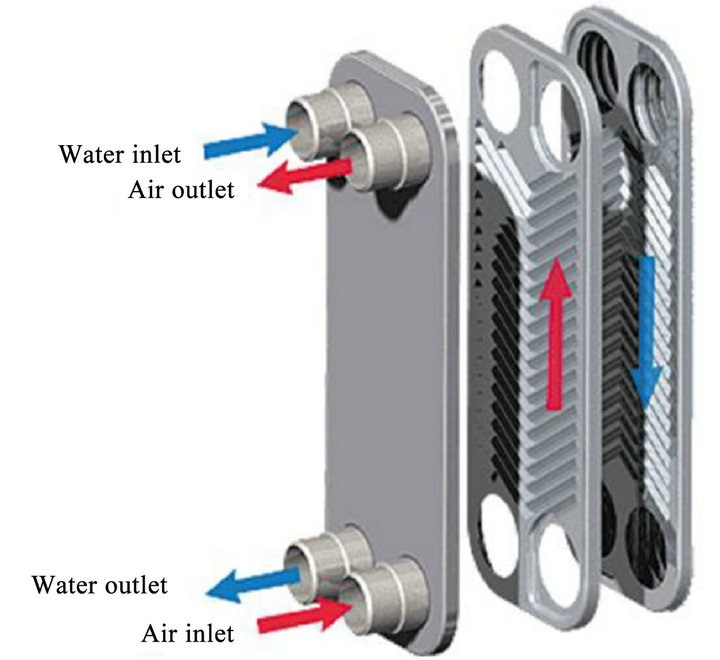
Figure 13. Plate fin tube heat exchange.
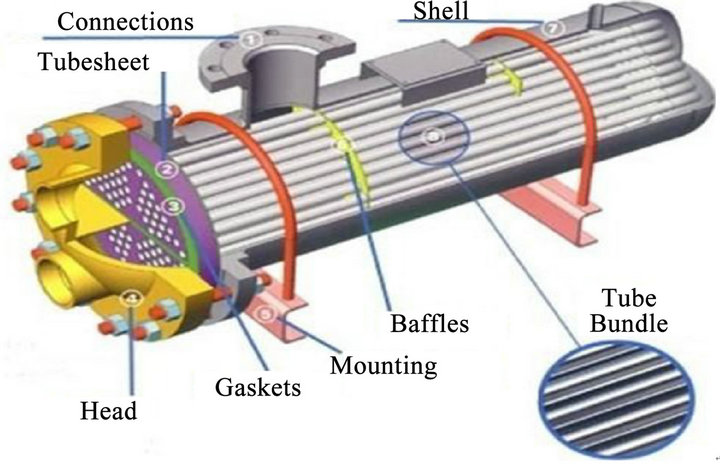
Figure 14. Shell and tube heat exchanger.
tics. The accuracy of predicting condensate flow rate varies according to changing in air flow rate and fin spacing. Rich [40] studied the effect of fin spacing on the heat transfer of multi-row, smooth-plate fin-and-tube heat exchangers. It has been found that the heat transfer coefficient is independent of the fin spacing within the range from 3 to 21 fins per inch at a given air mass flux. Later on, Rich [41] has studied the effect of the number of rows on heat transfer performance and pointed out that the average heat transfer coefficient for a deep coil may be higher or lower than that for a shallow coil, depending upon the Reynolds number. McQuiston [42] has developed a solution for efficiency of a tin plate of uniform cross section and concluded that mass transfer decreases fin efficiency, especially for very moist air with a low evaporator temperature. Saboya and Sparrow [43] in their study of heat transfer characteristics of two-row plate fin and tube heat exchanger configurations, found that a boundary layer on the forward part of the tin plate and a vortex system that develops in front of the tubes provide high mass transfer rates. Subsequently, McQuiston [44,45] performed a series of experiments to study the heat and mass transfer of plate tin tube heat exchangers. It has been found that both the total j factor and the sensible j factor were correlated with a parameter that combined tube diameter, tube transverse distance, and fin spacing. He also developed a correction factor for n-row heat exchangers based on the j factors for four-row plate-fin tube heat exchangers. Webb et al. [46] have developed a theoretical model to predict the condensation coefficient on horizontal integral-fin tubes designed for surface tension-induced drainage from the fin. Eckels and Rabas [47] have correlated the wet and dry sensible heat transfer coefficients with the transverse velocity of condensing water vapor. It has been found that the transverse velocity has a significant effect on heat, mass, and momentum transfer augmentation in a typical air-cooling operation. They have also reported that both wet and dry sensible heat transfer coefficients are linearly increased with the standard face velocity. Coney et al. [48] have numerically investigated fin performance with condensation from humid air and presented their results of average condensate heat transfer coefficients and overall air heat transfer coefficients in terms of bulk air velocity. A correlation of the enthalpy Colburn j factor has been developed by Jacobi and Goldschmidt [49]. This correlation characterizes the heat and mass transfer performance of the integral high-finned tube, evaporator, or dehumidifying heat exchanger at low Reynolds numbers. They concluded that although the sensible j factor is deleteriously affected by condensate retention at low Reynolds numbers, the overall heat transfer rates are much higher when condensation occurs. Mirth and Ramadhyani [50,51] have showed that wet-surface heat transfer coefficients scatter around the dry surface correlation; the trends were inconclusive with respect to whether or not the wetted surface causes heat transfer enhancement or degradation. They also investigated the heat and mass characteristics of wavy fin heat exchangers. The results showed that the Nusselt numbers were very sensitive to the change of inlet dew point temperatures and the Nusselt number decreases with an increase of dew point temperatures. Similar results have been reported by Fu et al. [52]. In dehumidifying heat exchangers having a louver fins configuration, they reported a pronounced decrease of the wet sensible heat transfer coefficients with the increase of the inlet relative humidity. On the contrary, the experimental data of Seshimo et al. [53] indicated that the Nusselt number was relatively independent of inlet conditions. Wu and Bong [54] derived an analytical solution for calculating overall fin efficiency for a partially wet fin. They also suggested that the overall fin efficiency be determined separately for the dry region and the wet region. Nevertheless, the effects of face velocity where the maximum condensate flow rate occurs had not been discussed in their work.
A better and more common procedure is to collect information about the heat transfer coefficients by means of correlations so that variations with respect to the operating parameters can be taken into account through standard non dimensional groups. Usually the form of the correlation cannot be totally justified from first principles; it is selected based on simplicity and common usage. Estimated errors in heat rates from correlations are normally larger than the experimental error, being mainly due to the data compression that occurs through the correlation process. Another reason for the inaccuracy in predictions is that, for most forms of correlating functions that are used. A least square analysis of the error gives multiple sets of values for the constants indicating that a local, rather than a global, optimum set of values may have been found.
The problem of accuracy in condensing heat exchangers predictions is addressed by an alternative approach using artificial neural networks (ANNs) [55]. ANNs have been developed in recent years and used successfully in many application areas of thermal engineering. Previous work on the prediction of heat rates in heat exchangers without condensation has been reported by Zhao et al. [56] and Diaz et al. [57]. The most attractive advantage of the method is that it allows the modeling of complex systems without requiring detailed knowledge of the physical processes. Kim and Song [58] found that the total heat and mass transfer rate from the plate increased with increasing the ratio of fin pitch to the tube diameter. Mon and Gross [59] studied the effects of fin pitches on four-row annular finned-tube bundles in staggered and inline alignments. They found that the boundary layer and horseshoe vortices between the fins were substantially dependent on the Reynolds number and the ratio of fin pitch to the height. Kim [60] measured the heat transfer characteristics of plate finned-tube heat exchangers with continuous fins having large fin pitches. He developed an empirical air side heat transfer correlation for continuous plate finned-tube heat exchangers with large fin pitches. Xie et al. [61] studied air side heat transfer and friction characteristics of continuous finned-tube heat exchangers for (1 - 6) tube rows. Yang et al. [62] studied fin pitch optimization of a continuous finned-tube heat exchanger under frosting conditions for fin pitches greater than 5 mm. Finned-tube heat exchangers having discrete plate fins with large fin pitches have been widely used to enhance the heat transfer performance of evaporators in refrigerators and freezers under dry and frosting conditions.
4.2.2. Shell and Tube Heat Exchanger
Shell and tube heat exchanger is shown in Figure 14. Kern [63] provided a simple method for calculating shell-side pressure drop and heat transfer coefficient. However, this method is restricted to a fixed baffle cut (25%) and cannot adequately account for baffle-to-shell and tube-to-baffle leakage. Kern method is not applicable in the laminar flow region where the shell-side Reynolds number is less than 2000. Although the Kern equation is not particularly accurate, it does allow a very simple and rapid calculation of shell-side heat transfer coefficient and pressure drop to be carried out. The concept of considering the various streams through the exchanger was originally proposed by Tinker [64]. He suggested a schematic flow pattern, which divided the shell-side flow into a number of individual streams. Tinker's model is based on the basis of stream analysis method, which utilizes a rigorous reiterative approach and is particularly suitable for computer calculations rather than hand calculation. Tinker's original analysis was quite complex and hard to understand. After an extensive series of experiments were carried out, a new method has emerged,

Figure 15. Water solar collector input/output block diagram.
commonly described as the Bell-Delaware method [65].
The Delaware method uses the principle of Tinkers model but more suitable for hand calculation. In this method, correction factors for baffle leakage effects, etc., are introduced based on extensive experimental data. This method is widely used and most recommended in manual design of an exchange; the thermal design engineer cannot avoid the trial and error routine. Accordingly there is a little interest in hand calculation method. For manual design, Saunders [66] has proposed very practical method that simple design factors are provided which enable the method proposed by Bell [65] to be used rapidly for a fixed set of geometrical parameters. In Bell's work, the correction factors for heat transfer and pressure drop correlations are given in the graphic form. For computer applications, Taborek [67] has reported the correlations for all correction factors involving Bell’s method. Wills et al. [68] have developed the stream analysis method that is viable for hand calculation. Hewitt [69] has provided a more readily accessible version of Wills method. Reppich and Zagermann [70] have introduced a computer-based design model to determine the optimum dimensions of segmentally baffled shell-andtube heat exchangers by calculating optimum shell side and tube-side pressure drops from the equations provided in their work. The six optimized dimensional parameters are number of tubes, tube length, shell diameter, number of baffles, baffle cut, and baffle spacing. The proposed model carries out also the cost analysis. Gaddis and Gnielinski [71] have presented a new procedure for calculating shell-side pressure drop, which is based principally on Delaware method. However, instead of using diagrams as in the Delaware method to calculate the pressure drop in the tube bank, they used the equations previously presented in [72]. Li and Kottke [73,74] have carried out series of experimental work on shell-and-tube heat exchangers to analyze shell-side heat transfer coefficient (HTC) and pressure loss. They employed a particular mass transfer measuring technique based on absorption, chemical and color giving reaction in their researches to obtain the local shell-side HTC by applying the extended Lewis analogy between heat and mass transfer to a mass transfer coefficient. They studied local shell-side HTC in shell and tube heat exchangers with disc-and-doughnut baffles and segmental baffles. They also investigated the effect of leakage and baffle spacing on pressure drop and HTC [75,76] respectively. Diaz et al. [77] gave lots of works in steady dynamic simulation and control heat exchangers using ANNs. Other researches about heat exchangers control by means of ANNs were reported in [78]. From aforementioned successful applications, it is shown that ANNs are well suitable to thermal analysis in engineering systems, especially in heat exchangers.
4.3. Water Heater System
An extensive analysis of the performance of solar water heaters, both experimentally and analytically is available in the literature. Some of the most important are discussed here.
Zhani et al. [79] have considered that solar energy collectors as heat exchangers that convert incoming solar energy to internal energy of the transport medium (air or water). The current solar desalination prototype employs the water solar collector use a sheet-and-tube, in copper material, absorber with the tubes as an integral part of the sheet, the inner diameter of the tubes is 10 mm and the outer one is 12 mm. The water solar collector can be viewed as a multivariable system with several input and output signals. Figures 15 and 16 present the water solar collector input/output diagram, these permits to visualize
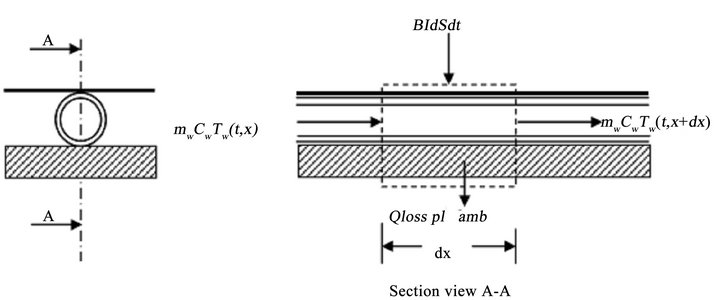
Figure 16. Thermal energy balance of differential section of solar water collector (one-temperature case).
the different variables imposed by the outside middle as a function of time. It displays the external variables that would affect the water solar collector as the solar radiation, I(t), ambient temperature, Tamb(t), the collector input signals, namely the water flow rate, mw(t), and temperature, Twe(t), as well as the output signal which is the water temperature, Tws(t). Both I(t) and Tamb(t) are considered as perturbations seen their aleatory behavior during the time. The plane solar collector can be described by two different models. The first model is formed by an equation to the partial derivatives. The second, be composed of two equations coupled to the partial derivatives binding the temperature of the fluid to that of the absorber.
Nafey et al. [13] used a solar water heater that used the solar concentrating collector, which is consisting of a reflector frame of parabolic shape as shown in Figure 17. The reflector is made of stainless steel sheet of 0.5 mm thickness, 1 m width and 2 m length. The reflector surface is supported on two steel frames about the focal axis of the reflector surface. Also a brass tube is located (with support) at the focal axis of the reflector surface. The brass tube is 2.5 m in length, 0.022 m in external diameter and 0.02 m in internal diameter. The brass tube is surrounded by a double glass transparent envelope of 0.04 m internal diameter and 0.95 m length.
By increasing the energy input to the system, the inlet temperatures of the water to the humidifier are increased. Then, the vaporization rate is increased, and hence, the productivity increases. Zhani and BenBacha [12] used water solar collector device for desalination system, which is composed of 6 collectors 2 m in length and 1 m in width. The water solar collector consists of a sheet, tubes made of copper material, absorber with the tubes as an integral part of the sheet. The inner diameter of the tubes is 10 mm and the outer one is 12 mm. Like the air solar collector, polyurethane foam was used for thermal insulation and a silicon sealant for insulation from the environment as shown in Figure 18.
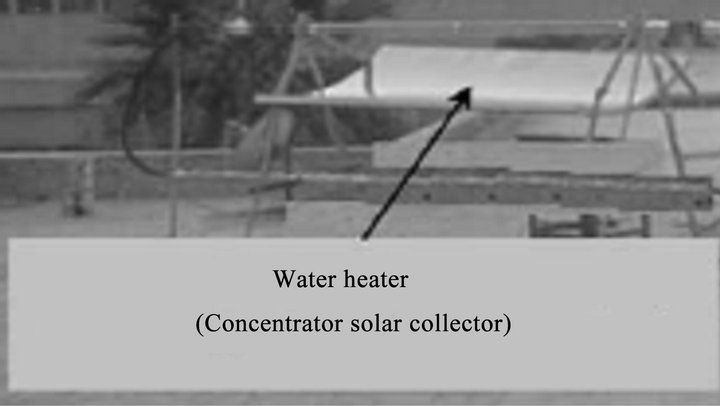
Figure 17. Solar concentrating collector (solar water heater) [13].
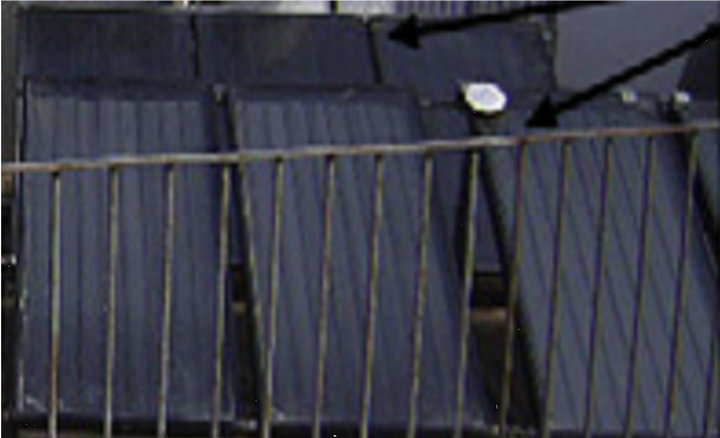
Figure 18. Flat plate solar collector array used in the desalination system [12].
The solar collector efficiency can be defined according to Equation (1) as a function of the water inlet and outlet temperature, area of the collector, water flow rate and solar radiation as reported in Yuan and Zhang [20] by,
 (2)
(2)
Abdel Dayem and Fatouh [80] used four parallel flatplate solar collectors with total surface area of 8.9 m2, oriented to the south and tilted 30 degrees with the horizontal. They are connected with a 200 liter insulated vertical storage tank. Gupta and Garg [81] developed a model for thermal performance of a natural circulation solar water heater with no load. They represented solar radiation and ambient temperature by Fourier series, and were able to predict a day's performance in a manner that agreed substantially with experiments. Ong [82,83] performed two studies to evaluate the thermal performance of a solar water heater. He instrumented a relatively small system with five thermocouples on the bottom surface of the water tubes and six thermocouples on the bottom surface of the collector plate. A total of six thermocouples were inserted into the storage tank, and a dye tracer mass flow meter was employed. Ong’s studies appear to be the first detailed ones on a thermosyphonic system. Kudish et al. [84] measured in their study the thermosyphon flow rate directly by adapting a simple and well-known laboratory technique, a constant level device, to a solar collector in the thermosyphon mode. The thermosyphon flow data gathered were utilized to construct a standard efficiency test curve, thus showing that this technique can be applied for testing collectors in the thermosyphon mode. They also correlated the instantaneous collector efficiency as a function of time of a day. Morrison and Braun [85] have studied system modeling and operating characteristics of thermosyphon solar water heater with vertical or horizontal storage tank. They found that the system performance is maximized when the daily collector volume flow is approximately equal to the daily load flow. Also they concluded that system with a horizontal tank did not perform well as vertical one. Hobson and Norton [86] developed in their study a characteristic curve for an individual directly-heated thermosyphon solar energy water heater obtained from data of 30 days’ tests. Using such a curve, the calculated annual solar fraction agreed well with the corresponding value computed from the numerical simulation. Furthermore, the analysis was extended, and they produced a simple but relatively accurate design method for direct thermosyphon solar energy water heaters. Shariah and Shalabi [87] studied optimization of design parameters for a thermosyphon solar water heater for two regions in Jordan represented by two cities, namely Amman and Aqaba through the use of a simulation program. Their results indicate that the solar fraction of the system can be improved by 10% to 25% when each studied parameter is chosen properly. It was also found that the solar fraction of a system installed in Aqaba (hot climate) is less sensitive to some parameters than the solar fraction of a similar system installed in Amman (mild climate).
4.4. Solar Air Heater
Zhani et al. [79] solar energy collectors are heat exchangers that convert incoming solar energy to internal energy of the transport medium (air or water). The air solar collector has 2 m length and 1 m width, and is formed by a single glass cover and an absorber. The absorbing aluminum material that traps the energy was constituted of 20 separated square channels with a thickness of 1 mm. The separating distance is 2 mm and each flow channel was 40 mm in width. The air gap between the absorber and the glass cover is 0.1 m. The rear and sides insulations were provided by polyurethane to reduce heat loss. A silicon sealant was used between the different components of the air solar collector to ensure insulation from the environment. The water solar collector device used by the desalination prototype is of 2 m in length and 1 m in width like the water solar collector, the air solar one can be viewed as a multivariable system with several input and output signals. This permit is used to visualize the different variables imposed by the outside middle as a function of time. It displays the external variables that would affect the air solar collector as the solar radiation, and ambient temperature, and the collector input signals, namely the air flow rate, and temperature, as well as the output signal which is the air temperature. The assumptions used in developing the mathematical model are listed below: the velocity of air is uniform, therefore the local state of air depends only on one side x, and the area of the absorber, glass cover and air are considered equal.
Yamali and Solmus [15] designed a double-pass solar air heater shown in Figure 19. This figure shows a view
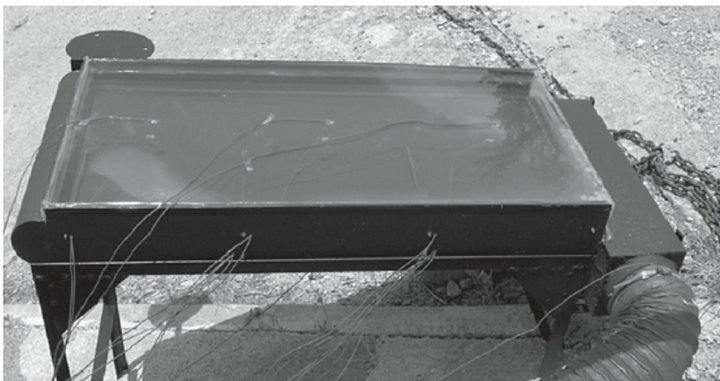
Figure 19. A view of the double-pass flat plate solar air heater [15].
of the double-pass flat plate solar air heater which is 50 cm wide, 100 cm long and 10 cm high. It consists of two glass covers having a thickness of 3 mm, insulated container and black painted copper absorber plate. The distance between the glass covers is 2.5 cm, the insulation thickness is 5 cm and the thermal conductivity of the insulation material is 0.04 W/mK. The container of the solar air heater is made of iron sheets of 2 mm thickness fabricated by welding and painted with a matt black dye. A matt black painted copper absorber plate (100 × 50 cm) with 1 mm thickness was placed horizontally on the centerline of the container. The solar air heater was positioned at a tilt angle of 30˚ facing south. Productivity of the system increases about 15% if a double-pass flat is used.
Nafey et al. [13] Solar air heater a tubeless flat plate solar collector with a single glass cover is used for air heating. The Heater effective area is 0.5 × 1 m and the absorber plate is made of copper with a thickness of 0.5 mm. The air gap between the absorber and the glass cover is 0.01 m.
Nawayseh et al. [4] constructed a simulation program in which the set of nonlinear equations describing the desalination unit were solved numerically. The predicted results of the simulation showed acceptable agreement with the experimental results of two different units constructed in Jordan and Malaysia. Energy was obtained either from solar or an electric heating source to heat the air. The air flow rate was found to have an insignificant effect on the productivity of desalinated water. While increasing the water flow rate was found to decrease productivity. In a later study, Nawayseh et al. [88] used the simulation program to optimize the unit performance by studying the effect of condenser and humidifier areas as well as the feed water flow rate. Ben Bacha et al. [89] modeled and simulated a solar multiple condensation evaporation system (SMCES). An experimental validation has been carried out to verify the accuracy of the model, and a few requirements have been suggested for the best operation and production for the SMCEC desalination unit. Dai et al. [21] derived a mathematical model for the open air cycle to simulate the unit performance numerically. The results revealed that a large error occurred at high inlet temperature of feed water. The water productivity and the hourly water production behave differently with regard to the variation of mass flow rate of air. Optimum mass flow rate of air exists only for hourly water production. The optimum value of the mass flow rate increased with the decrease of the temperature of the inlet water feed to the humidifier. Farid et al. [90] carried out a simulation study to investigate the performance of solar multi-effect humidification units based on the HDH principle. The study has focused on analyzing the effects of various components involved in the process along with the study of the effect of water flow rate on the desalination production. Nafey et al. [91] presented a numerical investigation of the HDH desalination process in which water is heated using a solar concentrator, and the air is heated using a flat-plate solar air heater. It has been reported that the productivity of the unit is strongly influenced by the air flow rate, cooling water flow rate and total solar energy incident through the day. Fath and Ghazy [92] investigated theoretically the performance of a solar desalination system using HDH technique. The system consists of a solar air heater 1 × 1 × 2 m the glass cover is conventional 3 mm window glass humidifier and dehumidifier. They concluded that productivity of the system is significantly affected by the solar air heater efficiency. The air heater used in this work was assumed to be consisting of two air conduits. The main idea behind this assumption is to improve the air heater effectiveness. The authors concluded that the feed water flow rate and dehumidifier effectiveness have an insignificant influence on the system productivity. Recently, Chafik [93,94] presented a procedure which consists of several steps or stages of air heating and humidification that lead to high vapor concentration in the airflow. This work deals with a study of a water desalination system by solar energy using the HDH principle. The system is a modular one and has the independent components namely: two solar collectors, an evaporator and a condenser. It was reported that, by this way, the airflow rate through the plant can be reduced and low investment and operating costs can be achieved. Moreover, the main equipment of the system, such as solar air collectors, humidifiers and dehumidifier, were designed and tested. Condensing equipment has been designed to recover desalinated water out of the humidified air. The study has two parts. The first one is concerned with the presentation of the characteristics of the designed and constructed components of the desalination system and some experimental results are also analyzed. In the second part, a general mathematical model for the system is presented. It includes the models of the different components of the developed system from the governing heat and mass transfer equations.
5. Performance Parameters for HDH System
There are several ways to characterize the performance of HDH systems. Some important parameters are used to define and to evaluate this performance such as, gained output ratio (GOR), specific water production, recovery ratio (RR), energy reuse factor (f), and specific entropy generation.
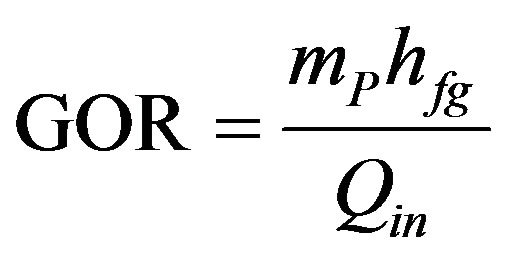
5.1. Gained Output Ratio (GOR)
The gained output ratio (GOR), sometimes known as the performance ratio, and evaluated by a dimensionless measure of the amount of product produced for a given heat input as in [95].
 (3)
(3)
where, hfg is the heat of vaporization evaluated at the inlet water temperature. For the cycles considered here, Qin = QHT. In the case of solar still has a GOR equal unity [96], it means that the system requires enough heat input to directly vaporize all of the produced water and that there is an ineffective energy recovery. A basic solar still will have a GOR of approximately 1, or less owing to losses. A high GOR is desirable since it means that less heat input is required per unit water produced. When the heat source is a fossil fuel, higher GOR means lower fuel costs. When the heat source is solar radiation, higher GOR means a smaller solar collector area and hence, reduced capital costs.
5.2. Specific Water Production
The amount of water produced per square meter of solar collector area per day is defined as specific water production. This parameter is an index of the solar energy efficiency of the HDH cycle. This parameter is of great importance as the majority of the capital cost of the HDH system since the solar collector cost is 40% - 45% for air-heated systems [97] and 20% - 35% for water-heated systems [23].
5.3. Recovery Ratio (RR)
The recovery ratio (RR) is defined as the ratio of the amount of water produced per kg of that feed. This parameter is also called the extraction efficiency [24]. This ratio in general found to be much lower for the HDH system than conventional systems. The advantage of a low recovery ratio is that complex brine pre-treatment process or brine disposal processes which may not be required for this system.
5.4. Energy Reuse Factor (f)
Energy reuse factor is defined as the ratio of energy recovered from the heated fluid to the energy supplied to the heated fluid [98]. This is also reflex another index of heat recovery of the system.
5.5. Specific Entropy Generation
Specific entropy generation for the cycle is defined as the total entropy generated in the desalination system divided by the mass flow rate of product water.
Thermodynamic arguments for the use of this parameter in analysis of HDH cycles, based on the least heat of separation, are provided by Mistry et al. [99].
6. Conclusion
Solar humidification-dehumidification desalination technology has been reviewed in detail in this paper. From the present review, it is found that the humidificationdehumidification desalination process HDH will be a suitable choice for fresh water production when the demand is decentralized. HDH is a low temperature process where total required thermal energy can be obtained from solar energy. Capacity of HDH units is between that produced by conventional methods and solar stills. Moreover, HDH is distinguished by simple operation and maintenance. From the condensed review, it was observed that an increase in evaporator and condenser surface areas significantly improves system productivity. But prior to implementing any techniques in design improvement, it is necessary to optimize the MEH unit by optimizing its component size to understand the effect of feed water and air flow rates. Although a fair amount of simulation studies have been conducted in the past, further design simulation is required to fully understand the complicated effects of air and water flow rates, the optimum size of individual components or modules of the unit and to generate a comprehensive model for the system. Table 2 shows some of HDH variables.
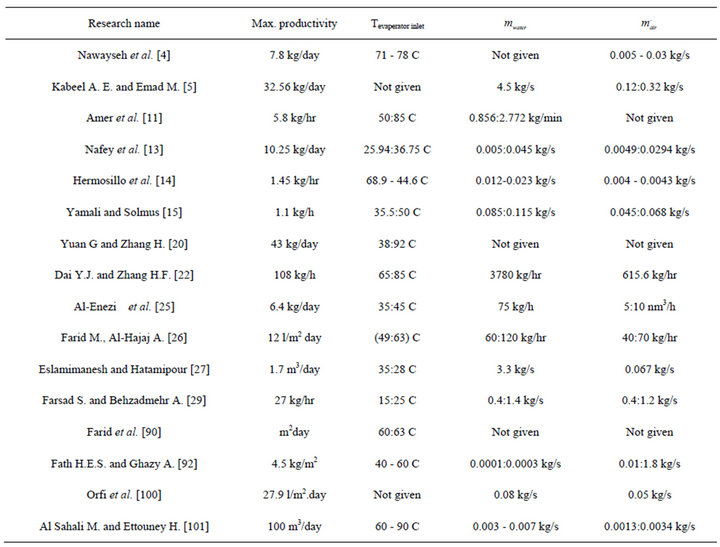
Table 2. Different variables of HDH.
‘
REFERENCES
- J. Bendfeld, Ch. Broker, K. Menne, E. Ortjohann, L. Temme, J. Vob and P. C. M. Carvallo, “Design of a PVPowered Reverse Osmosis Plant for Desalination of Brackish Water,” Proceedings of 2nd World Conference and Exhibition on Photovoltaic Solar Energy Conversion, Vienna, 6-10 July 1998, pp. 3075-3077.
- S. Kalogirou, “Economic Analysis of a Solar Assisted Desalination System,” Renewable Energy, Vol. 12, No. 4, 1997, pp. 351-367. doi:10.1016/S0960-1481(97)00063-3
- R. M. Morris and W. T. Hanbury, “Predication of Critical Desalination Parameters Using Radial Basis Functions Network,” Proceedings of the New Technologies for the Use of Renewable Energy Sources in Water Desalination, Sec.I, Athens, 1991, pp. 30-50.
- N. Kh. Nawayseh, M. Farid, S. Al-Hallaj and A. R. AlTimimi, “Solar Desalinate Heat Ion Based on Humidification Process-I and Mass Transfer Coefficients,” Energy Conversion and Management, Vol. 40, No. 13, 1999, pp. 1423-1439. doi:10.1016/S0196-8904(99)00018-7
- A. E. Kabeel and M. S. Emad El-Said, “A Hybrid Solar Desalination System of Air Humidification Dehumidification and Water Flashing Evaporation Part I. A Numerical Investigation,” Sixteen International Water Technology Conference, IWTC16, Istanbul, 7-10 May 2012.
- R. E. Treybal, “Mass Ttansfer Operation,” McGraw-Hill, NewYork, 1980.
- F. Kreith and R. F. Boehm, “Direct Contact Heat Transfer,” Hemisphere Corp., Washington, 1988.
- M. A. Younis, M. A. Darwish and F. Juwayhel, “Experimental and Theoretical Study of a Humidification-Dehumidification Desalting System,” Desalination, Vol. 94, No. 1, 1993, pp. 11-24, doi:10.1016/0011-9164(93 80151-C
- J. Orfi, M. Laplante, H. Marmouch, N. Galanis, B. Benhamou, S. B. Nasrallah and C. T. Nguyen, “Experimental and Theoretical Study of a Humidification-Dehumidification Water Desalination System Using Solar Energy,” Desalination, Vol. 168, 2004, pp. 151-159. doi:10.1016/j.desal.2004.06.181
- M. Ben-Amara, I. Houcine, A. Guizani and M. Maalej, “Experimental Study of a Multipl-Effect Humidification Solar Desalination Technique,” Desalination, Vol. 170, No. 3, 2004, pp. 209-221.
- E. H. Amer, H. Kotb, G. H. Mostafa and A. R. El-Ghalban, “Theoretical and Experimental Investigation of Humidification-Dehumidification Desalination Unit,” Desalination, Vol. 249, No. 3, 2009, pp. 949-959. doi:10.1016/j.desal.2009.06.063
- K. Zhania and H. B. Bacha, “Experimental Investigation of a New Solar Desalination Prototype Using the Humidification-Dehumidification Principle,” Renewable Energy, Vol. 35, No. 11, 2010, pp. 2610-2617. doi:10.1016/j.renene.2010.03.033
- A. S. Nafey, H. E. S. Fath, S. O. El-Helaby and A. M. Soliman, “Solar Desalination Using Humidification-Dehumidification Processes. Part II. An Experimental Investigation,” Energy Conversion and Management, Vol. 45, No. 7-8, 2004, pp. 1263-1277. doi:10.1016/S0196-890403 00152-3
- J. J. Hermosillo, C. A. Arancibia-Bulnes and C. A. Estrada, “Water Desalination by Air Humidification: Mathematical Model and Experimental Study,” Solar Energy, Vol. 86, No. 4, 2011, pp. 1070-1076.
- C. Yamali and I. Solmusf, “A Solar Desalination System Using Humidification-Dehumidification Process: Experimental Study and Comparison with the Theoretical Results,” Desalination, Vol. 220, No. 1-3, 2008, pp. 538- 551. doi:10.1016/j.desal.2007.01.054
- S. A. El-Agouz and M. Abugderah, “Experimental Analysis of Humidification Process by Air Passing through Seawater,” Energy Conversion and Management, Vol. 49, No. 12, 2008, pp. 3698-3703. doi:10.1016/j.enconman.2008.06.033
- A. Lydersen, “Mass Transfer in Engineering Practice,” John Wiley & Sons, Hoboken, 1985.
- H. Muller-Holst, M. Engelhardt, M. Herve and W. Scholkopf, “Solar Thermal Seawater Desalination Systems for Decentralised Use,” Renewable Energy, Vol. 14, No. 1-4, 1998, pp. 311-318. doi:10.1016/S0960-148198 00083-4
- J. S. Wallis and R. J. Aull, “Improving Cooling Tower Performance,” Hydrocarbon Engineering, 1999, pp. 92- 95.
- G. F. Yuan and H. F. Zhang, “Mathematical Modeling of a Closed Circulation Solar Desalination Unit with Humidification-Dehumidification,” Desalination, Vol. 205, No. 1-3, 2007, pp. 156-162. doi:10.1016/j.desal.2006.03.550
- Y. J. Dai, R. Z. Wang and H. F. Zhang, “Parametric Analysis to Improve the Performance of a Solar Desalination Unit with Humidification and Dehumidification,” Desalination, Vol. 142, No. 2, 2002, pp. 107-118. doi:10.1016/S0011-916401 00430-1
- Y. J. Dai and H. F. Zhang, “Experimental Investigation of a Solar Desalination Unit with Humidification and Dehumidification,” Desalination, Vol. 130, No. 2, 2000, pp. 169-175. doi:10.1016/S0011-916400 00084-9
- E. Chafik, “A New Type of Seawater Desalination Plants Using Solar Energy,” Desalination, Vol. 156, No. 1-3, 2003, pp. 333-348. doi:10.1016/S0011-916403 00364-3
- J. F. Klausner, R. Mei and Y. Li, “Innovative Fresh Water Production Process for Fossil Fuel Plants,” Annual Report, University of Florida, Gainesville, 2003, 58 Pages.
- G. Al-Enezi, H. Ettouney and N. Fawzy, “Low Temperature Humidification Dehumidification Desalination Process,” Energy Conversion and Management, Vol. 47, No. 4, 2006, pp. 470-484. doi:10.1016/j.enconman.2005.04.010
- M. Farida and A. W. Al-Hajajb, “Solar Desalination with Humidification Dehumidification Cycle,” Desalination, Vol. 106, No. 2, 1996, pp. 427-429.
- A. Eslamimanesh and M. S. Hatamipour, “Mathematical Modeling of a Direct Contact Humidification-Dehumidification Desalination Process,” Desalination, Vol. 237, No. 1-3, 2009, pp. 296-304. doi:10.1016/j.desal.2008.01.023
- Shaobo Hou and Hefei Zhang, “A Hybrid Solar Desalination Process of the Multi-Effect Humidification Dehumidification and Basin-Type Unit,” Desalination, Vol. 220, 2008, pp. 552-557. doi:10.1016/j.desal.2007.01.055
- S. Farsad and A. Behzadmehr, “Analysis of a Solar Desalination Unit with Humidification-Dehumidification Cycle Using DOE Method,” Desalination, Vol. 278, No. 1-3, 2011, pp. 70-76. doi:10.1016/j.desal.2011.05.008
- M. Khedr, “Techno-Economic Investigation of an Air Humidification-Dehumidification Desalination Process,” Chemical Engineering Technology, Vol. 16, No. 4, 1993, pp. 270-274. doi:10.1002/ceat.270160410
- H. P. Garg, R. S. Adhikari and R. Kumar, “Experimental Design and Computer Simulation of Multi-Effect Humidification (MEH)-Dehumidification Solar Distillation,” Desalination, Vol. 153, No. 1-3, 2002, pp. 81-86. doi:10.1016/S0011-916402 01106-2
- S. Al-Hallaj, M. M. Farid and A. R. Tamimi, “Solar Desalination with Humidification-Dehumidification Cycle: Performance of the Unit,” Desalination, Vol. 120, No. 3, 1998, pp. 273-280. doi:10.1016/S0011-916498 00224-0
- H. Ben-Bacha, T. Damak and M. Bouzguenda, “Experimental Validation of the Distillation Module of a Desalination Station Using the SMCEC Principle,” Renewable Energy, Vol. 28, No. 15, 2003, pp. 2335-2354. doi:10.1016/S0960-148103 00167-8
- I. Houcine, M. B. Amara, A. Guizani and M. Maalej, “Pilot Plant Testing of a New Solar Desalination Process by a Multiple-Effect-Humidification Technique,” Desalination, Vol. 196, No. 1-3, 2006, pp. 105-124. doi:10.1016/j.desal.2005.11.022
- G. R. Mirsky and J. Bauthier, “Evolution of Cooling Tower Fill,” CTI Journal, Vol. 14, No. 1, 1993, pp. 12- 19.
- R. J. Aull and T. Krell, “Design Features of Cross-Fluted Film Fill and Their Effect on Thermal Performance,” CTI Journal, Vol. 21, No. 2, 2000, pp. 12-33.
- J. C. Kloppers, “A Critical Evaluation and Refinement of the Performance Prediction of Wet-Cooling Towers,” PhD dissertation, University of Stellenbosch, Stellenbosch, 2003.
- D. G. Kroger, “Air-Cooled Heat Exchangers and Cooling Towers Thermal-Flow Performance Evaluation and Design, Vols. I and II,” Pen well Corp, Tulsa, 2004.
- F. C. McQuiston, “Finned Tube Heat Exchangers: State of the Art for the Air Side,” ASHRAE Transactions, Vol. 17, No. 1, 1980, pp. 14-15.
- D. G. Rich, “The Effect of Fin Spacing on the Heat Transfer and Friction Performance of Multi-Row, Smooth Plate Fin-and-Tube Heat Exchangers,” ASHRAE Transactions, Vol. 79, No. 2, 1973, pp. 137-145.
- D. G. Rich, “The Effect of the Number of Tube Rows on Heat Transfer Performance of Smooth Plate Fin-and-Tube Heat Exchangers,” ASHRAE Transactions, Vol. 81, No. 1, 1975, pp. 307-317.
- F. C. McQuiston, “Fin Efficiency with Combined Heat and Mass Transfer,” ASHRAE Transactions, Vol. 81, No. 1, 1975, pp. 350-355.
- F. E. M. Saboya and E. M. Sparrow, “Transfer Characteristics of Two-Row Plate Fin and Tube Heat Exchanger Configurations,” International Journal of Heat and Mass Transfer, Vol. 19, No. 1, 1976, pp. 41-49. doi:10.1016/0017-931076 90009-0
- F. C. McQuiston, “Heat Mass and Momentum Transfer Data for Five Plate-Fin Tube Transfer Surface,” ASHRAE Transaction Part 1, Vol. 84, No. 1, 1978, pp. 266-293.
- F. C. McQuiston, “Correlation of Heat, Mass and Momentum Transport Coefficients for Plate-Fin-Tube Heat Transfer Surfaces with Staggered Tubes,” ASHRAE Transaction, Vol. 84, No. 1, 1978, pp. 294-309.
- R. L. Webb, T. M. Rudy and M. A. Kedzierski, “Prediction of the Condensation Coefficient on Horizontal Integral-Fin Tubes,” Journal of Heat Transfer, Vol. 107, No. 2, 1985, pp. 369-376. doi:10.1115/1.3247424
- P. W. Eckels and T. J. Rabas, “Dehumidification: On the Correlation of Wet and Dry Transport Processes in Plate Finned-Tube Heat Exchangers,” Journal of Heat Transfer, Vol. 109, No. 3, 1987, pp. 575-582. doi:10.1115/1.3248127
- J. E. R. Coney, C. G. W. Sheppard and E. A. M. ElShafei, “Fin Performance with Condensation from Humid Air: A Numerical Investigation,” International Journal of Heat and Fluid Flow, Vol. 10, No. 3, 1989, pp. 224-231. doi:10.1016/0142-727X89 90041-6
- A. M. Jacobi and V. W. Goldschmidt, “Low Reynolds Number Heat and Mass Transfer Measurements of an Overall Counterflow, Baffled, Finned-Tube, Condensing Heat Exchanger,” International Journal of Heat and Mass Transfer, Vol. 33, No. 4, 1990, pp. 755-765. doi:10.1016/0017-931090 90173-R
- D. R. Mirth and S. Ramadhyani, “Prediction of CoolingCoil Performance under Condensing Conditions,” International Journal of Heat and Fluid Flow, Vol. 14, No. 4, 1993, pp. 391-400.
- D. R. Mirth and S. Ramadhyani, “Correlations for Predicting the Air-Side Nusselt Numbers and Friction Factors in Chilled-Water Cooling Coils,” Experimental Heat Transfer, Vol. 7, No. 2, 1994, PP. 143-162. doi:10.1080/08916159408946477
- W. L. Fu, C. C. Wang, W. R. Chang and C. T. Chang, “Effect of Anti-Corrosion Coating on the Thermal Characteristics of a Louvered Finned Tube Heat Exchangers Under Dehumidifying Conditions,” ASME-PUBLICATIONS-HTD, Vol. 320, 1995, pp. 75-82.
- Y. Seshimo, K. Ogawa, K. Marumoto and M. Fujii, “Heat and Mass Transfer Performances on Plate Fin and Tube Heat Exchangers with Dehumidification,” Heat TransferJapanese Research, Vol. 18, No. 5, 1989, pp. 79-94.
- G. Wu and T. Y. Bong, “Overall Efficiency of a Straight Fin with Combined Heat and Mass Transfer,” ASHRAE Transactions, Vol. 100, Pt. 1, 1994, pp. 367-374.
- M. Sen and K. T. Yang, “Applications of Artificial Neural Networks and Genetic Algorithms in Thermal Engineering,” CRC Handbook of Thermal Engineering, 2000, pp. 620-661.
- Zhao, X. McClain and R. L. Sen, “An Artificial Neural Network Model of Heat Exchanger,” Symposium of Thermal Science and Engineering in Honor of Chancellor-Lin-Tine, 1995, pp. 83-88.
- G. Diaz, M. Sen, K. T. Yang and R. L. McClain, “Simulation of Heat Exchanger Performance by Artificial Neural Networks,” International Journal of Heating Ventilating Air Conditioning and Refrigerating Research, Vol. 5, 1999, pp. 195-208.
- J. Y. Kim and T. H. Song, “Effect of Tube Alignment on the Heat Mass Transfer from a Plate Fin and Two-Tube Assembly: Naphthalene Sublimation Results,” International Journal of Heat and Mass Transfer, Vol. 46, No. 16, 2003, pp. 3051-3059. doi:10.1016/S0017-931003 00091-7
- M. S. Mon and U. Gross, “Numerical Study of Fin-Spacing Effects in Annular-Finned Tube Heat Exchangers,” International Journal of Heat and Mass Transfer, Vol. 47, No. 8-9, 2004, pp. 1953-1964. doi:10.1016/j.ijheatmasstransfer.2003.09.034
- [61] Y. Kim, “Heat Transfer Characteristics of Flat Plate Finned-Tube Heat Exchangers with Large Fin Pitch,” International Journal of Refrigeration, Vol. 28, No. 6, 2005, pp. 851-858. doi:10.1016/j.ijrefrig.2005.01.013
- [62] G. Xie, Q. Wang and B. Sunden, “Parametric Study and Multiple Correlations on Air-Side Heat Transfer and Friction Characteristics of Fin and Tube Heat Exchangers with Large Number of Large Diameter Tube Rows,” Applied Thermal Engineering, Vol. 29, No. 1, 2009, pp. 1- 16. doi:10.1016/j.applthermaleng.2008.01.014
- [63] D. K. Yang, K. S. Lee and S. Song, “Fin Spacing Optimization of a Fin Tube Heat Exchanger under Frosting Conditions,” International Journal of Heat and Mass Transfer, Vol. 49, No. 15-16, 2006, pp. 2619-2625. doi:10.1016/j.ijheatmasstransfer.2006.01.016
- [64] D. Q. Kern, “Process Heat Transfers,” Tata McGraw-Hill, Noida, 2002.
- [65] T. Tinker, “Shell Side Characteristics of Shell and Tube Heat Exchangers, Parts I, II and III, General Discussion of Heat Transfer,” Proceedings of the Institution of Mechanical Engineers, London, 1951.
- [66] K. J. Bell, “Final Report of the Cooperative Research Program on Shell and Tube Heat Exchangers,” Engineering Experimental Station Bulletin, Vol. 5, 1963.
- [67] E. A. D. Saunders, “Heat Exchangers: Selection, Design & Construction,” Halsted Pr, Sydney, 1988.
- [68] J. Taborek, “Recommended Method: Principles and Limitations,” In: G. F. Hewitt, Heat Exchanger Design Handbook, Begell House, New York, 2002.
- [69] M. J. N. Wills, D. Johnston and A. Harwell, “A New and Accurate Hand Calculation Method for Shellside Pressure Drop and Flow Distribution,” American Society of Mechanical Engineers, 1984, p. 67.
- [70] G. F. Hewitt, “Flow Stream Analysis Method for Segmentally Baffled Shell and Tube Heat Exchangers,” Heat Exchanger Design Handbook, 2002.
- [71] M. Reppich and S. Zagermann, “A New Design Method for Segmentally Baffled Heat Exchangers,” Computers & Chemical Engineering, Vol. 19, No. 1, 1995, pp. 137-142. doi:10.1016/0098-135495 87028-8
- [72] E. S. Gaddis and V. Gnielinski, “Pressure Drop on the Shell Side of Shell and Tube Heat Exchangers with Segmental Baffles,” Chemical Engineering and Processing, Vol. 36, No. 2, 1997, pp. 149-159. doi:10.1016/S0255-270196 04194-3
- [73] E. S. Gaddis and V. Gnielinski, “Pressure Drop in Cross Flow across Tube Bundles,” International Chemical Engineering, Vol. 25, No. 1, 1985, pp. 1-15.
- [74] H. Li and V. Kottke, “Local Heat Transfer in the First Baffle Compartment of the Shell and Tube Heat Exchangers for Staggered Tube Arrangement,” Experimental Thermal and Fluid Science, Vol. 16, No. 4, 1998, pp. 342-348. doi:10.1016/S0894-177797 10036-X
- [75] H. Li and V. Kottke, “Visualization and Determination of Local Heat Transfer Coefficients in Shell and Tube Heat Exchangers for Staggered Tube Arrangement by Mass Transfer Measurements,” Experimental Thermal and Fluid Science, Vol. 17, No. 3, 1998, pp. 210-216. doi:10.1016/S0894-177797 10064-4
- [76] H. Li and V. Kottke, “Effect of the Leakage on Pressure Drop and Local Heat Transfer in Shell and Tube Heat Exchangers for Staggered Tube Arrangement,” International Journal of Heat and Mass Transfer, Vol. 41, No. 2, 1998, pp. 425-434. doi:10.1016/S0017-931097 00112-9
- [77] H. Li and V. Kottke, “Effect of Baffle Spacing on Pressure Drop and Local Heat Transfer in Shell and Tube Heat Exchangers for Staggered Tube Arrangement,” International Journal of Heat and Mass Transfer, Vol. 41, No. 10, 1998, pp. 1303-1311. doi:10.1016/S0017-931097 00201-9
- [78] G. Diaz, M. Sen, T. Yang and R. L. McClain, “Dynamic Prediction and Control of Heat Exchangers Using Artificial Neural Networks,” International Journal of Heat and Mass Transfer, Vol. 44, No. 9, 2001, pp. 1671-1679. doi:10.1016/S0017-931000 00228-3
- [79] M. Ayoubi, “Dynamic Multi-Layer Perceptron Networks: Application to the Nonlinear Identification and Predictive Control of a Heat Exchanger,” Applications of Neural Adaptive Control Technology, 1997, p. 205.
- [80] K. Zhani, H. Ben Bacha and T. Damak, “Modeling and Experimental Validation of a Humidification-Dehumidification Desalination Unit Solar Part,” Energy, Vol. 36, No. 5, 2011, pp. 3159-3169. doi:10.1016/j.energy.2011.03.005
- [81] M. Adel and M. Fatouh, “Experimental and Numerical Investigation of Humidification/Dehumidification Solar Water Desalination Systems,” Desalination, Vol. 247, 2009, pp. 594-609. doi:10.1016/j.desal.2008.12.039
- [82] C. L. Gupta and H. P. Garg, “System Design in Solar Water Heaters with Natural Circulation,” Solar Energy, Vol. 12, No. 2, 1968, pp. 163-170. doi:10.1016/0038-092X68 90003-0
- [83] K. S. Ong, “A Finite-Difference Method to Evaluate the Thermal Performance of a Solar Water Heater,” Solar Energy, Vol. 16, No. 3, 1974, pp. 137-147. doi:10.1016/0038-092X74 90010-3
- [84] K. S. Ong, “An Improved Computer Program for the Thermal Performance of a Solar Water Heater,” Solar Energy, Vol. 18, No. 3, 1976, pp. 183-191, doi:10.1016/0038-092X76 90017-7
- [85] A. I. Kudish, P. Santamaura and P. Beaufort, “Direct Measurement and Analysis of Thermosiphon Flow,” Solar Energy, Vol. 35, No. 2, 1985, pp. 167-173. doi:10.1016/0038-092X85 90006-4
- [86] G. L. Morrison and J. E. Braun, “System Modeling and Operation Characteristics of Thermosyphon Solar Water Heaters,” Solar Energy, Vol. 34, No. 2, 1985, pp. 389-405. doi:10.1016/0038-092X85 90051-9
- [87] P. A. Hobson and B. Norton, “A Design Monogram for Direct Thermosyphon Solar-Energy Water Heaters,” Solar Energy, Vol. 43, No. 2, 1989, pp. 85-95. doi:10.1016/0038-092X89 90150-3
- [88] A. Shariah and B. Shalabi, “Optimal Design for a Thermosyphon Solar Water Heater,” Renewable Energy, Vol. 11, No. 3, 1997, pp. 351-361. doi:10.1016/S0960-148197 00005-0
- [89] N. K. Nawayseh, M. M. Farid, A. A. Omar, S. M. AlHallaj and A. R. Tamimi, “A Simulation Study to Improve the Performance of a Solar Humidification-Dehumidification Desalination Unit Constructed in Jordan,” Desalination, Vol. 109, No. 3, 1997, pp. 277-284. doi:10.1016/S0011-916497 00074-X
- [90] H. Ben Bacha, M. Bouzguenda, M. S. Abid and A. Y. Maalej, “Modeling and Simulation of a Water Desalination Station with Solar Multiple Condensation Evaporation Cycle Technique,” Renewable Energy, Vol. 18, No. 3, 1999, pp. 349-365. doi:10.1016/S0960-148198 00800-3
- [91] M. M. Farid, S. Parekh, J. R. Selman and S. Al-Hallaj, “Solar Desalination with a Humidification-Dehumidification Cycle: Mathematical Modeling of the Unit,” Desalination, Vol. 151, No. 2, 2003, pp. 153-164. doi:10.1016/S0011-916402 00994-3
- [92] A. S. Nafey, H. E. Fath, S. O. El-Helaby and A. Soliman, “Solar Desalination Using Humidification Dehumidification Processes. Part I. An Numerical Investigation,” Energy Conversion and Management, Vol. 45, No. 2, 2004, pp. 1243-1261. doi:10.1016/S0196-890403 00151-1
- [93] H. E. Fath and A. Ghazy, “Solar Desalination Using Humodification-Dehumidification Technology,” Desalination, Vol. 142, No. 2, 2002, pp. 119-133.
- [94] E. Chafik, “A New Seawater Desalination Process Using Solar Energy,” Desalination, Vol. 153, No. 1, 2003, pp. 25-37. doi:10.1016/S0011-916402 01090-1
- [95] E. Chafik, “Design of Plants for Solar Desalination Using the Multi-Stage Heating Humidifying Technique,” Desalination, Vol. 168, No. 3, 2004, pp. 55-71. doi:10.1016/j.desal.2004.06.169
- [96] H. Karan, A. Mitsos and H. John, “Optimal Operating Conditions and Configurations for Humidification-Dehumidification Desalination Cycles,” International Journal of Thermal Sciences, Vol. 50, No. 5, 2011, pp. 779- 789. doi:10.1016/j.ijthermalsci.2010.12.013
- [97] S. B. Hou and H. F. Zhang “A Hybrid Solar Desalination Process of the Multi-Effect humidification Dehumidification and Basin-Type Unit,” Desalination, Vol. 220, No. 1-3, 2008, pp. 552-557. doi:10.1016/j.desal.2007.01.055
- [98] H. Muller-Holst, “Solar Thermal Desalination Using the Multiple Effect Humidification MEH Method,” In: Book Chapter, Solar Desalination for the 21st Century, Pergamon Press, Oxford, 2007, pp. 215-225.
- [99] B. M. Hamieh and J. R. Beckmann, “Seawater Desalination Using Dew-Vaporation Technique: Theoretical Development and Design Evolution,” Desalination, Vol. 195, No. 2, 2006, pp. 1-13. doi:10.1016/j.desal.2005.09.034
- [100] K. H. Mistry, J. H. Lienhard and S. M. Zubair, “Effect of Entropy Generation on the Performance of Humidification-Dehumidification Desalination Cycles,” International Journal of Thermal Sciences, Vol. 49, 2010, pp. 1837-1847. doi:10.1016/j.ijthermalsci.2010.05.002
- [101] J. Orfi, N. Galanis and M. Laplante, “Air HumidificationDehumidification for a Water Desalination System Using Solar Energy,” Desalination, Vol. 203, No. 1-3, 2007, pp. 471-481. doi:10.1016/j.desal.2006.04.022
- [102] M. Al-Sahali and M. Hisham, “Humidification Dehumidification Desalination Process: Design and Performance Evaluation,” Chemical Engineering Journal, Vol. 143, No. 1-3, 2008, pp. 257-264. doi:10.1016/j.cej.2008.04.030