Open Journal of Civil Engineering
Vol.2 No.3(2012), Article ID:22997,7 pages DOI:10.4236/ojce.2012.23021
Evaluation of Screw Reinforcement on Bearing Performance of Wood Depending on Screw Position
Research Institute for Sustainable Humanosphere (RISH), Kyoto University, Kyoto, Japan
Email: murakamisatoru@rish.kyoto-u.ac.jp
Received May 12, 2012; revised June 15, 2012; accepted June 28, 2012
Keywords: Screw; Reinforcement; FEM; Partial Compression; Bearing
ABSTRACT
In this study, the reinforcement of wood by screws for partial compression perpendicular to the grain was studied. For the estimation of stiffness and strength, the reinforcement effect of screws depending on their position under the loading plate was evaluated by taking into account the internal displacement distribution of the wood. The finite element analysis (FEA) was used to investigate the internal displacement distribution of the wood. Then an approximate function that can be applied to various internal displacement distributions under loading plate was proposed. From the shear resistance mechanism between the screw and wood by taking their relative displacement distribution into consideration, the equations to estimate the initial stiffness and yield strength of the bearing performance of the wood reinforced by screws were derived. Then partial compression test was carried out for wood reinforced by screws with setting screw thread at various positions. The values obtained by the equations corresponded with the tendency of the experimental results. It was found that the screw reinforcement is more effective when its thread is positioned as much as distant from the contact surface.
1. Introduction
Compression performance of wood perpendicular to the grain is significantly inferior to that parallel to the grain. This becomes one of the causes of the insufficient performance of timber connection. The bearing performance of a beam to support a column or the momentresisting joint where the beam push into the column against rotation can be listed as examples. Therefore it has been a concern in timber engineering to enhance the compression performaice of wood perpendicular to the grain.
Holms had studied about inserting Glass Fibre Reinforced Polymers (GFRF) or Hot Pressed Wood Dowel (HPWD) into the wood perpendicular to the grain to give higher initial stiffness and strength on the wood [1]. However, their method may hold some difficulties on the availability of the materials and the workability on the site.
The easier methods for reinforcement are to drive screws parallel to loading direction. In this method, the screws work as piles to transmit compression stress to inner part of the wood. Bejtka [2,3] had studied the beam support reinforced by screws. He used Volkersen’s theory to predict stress distribution along screw axis, and derived the equations to estimate the initial stiffness and maximum strength. However, his method didn’t consider the position of screws. Because the head of the screw move together with the wood surface under loading plate, it should be taken into account that the screw resistance doesn’t work nearby the wood surface.
In this study, the mechanical model of the screw reinforcement for bearing performance of the wood is proposed by taking the internal displacement distribution of wood into consideration in terms of the influence of the position of screws.
2. Mechanical Model
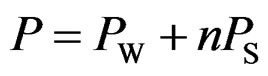
In the case where wood reinforced by screws is subjected to partial compressions as shown in Figure 1, the resistance load of the wood (PW) and that of the individual screws (PS) are set to be independent and work as serial springs. Hence, the total resistance load and initial stiffness can be expressed by the Equation (1).
 (1)
(1)
In the above equation, P is the total resistance load and n is the number of the inserted screws.
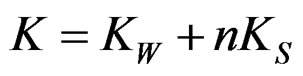
Therefore, the whole initial stiffness (K) is obtained from initial stiffness of the wood (KW) and that of the individual screws (KS) as shown in the Equation (2).
 (2)
(2)
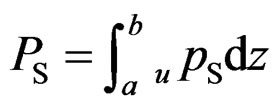
PS is acquired from integration of the screw resistance per unit length (upS) over the thread length (from a to b) as shown below.
 (3)
(3)
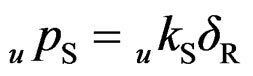
Here, “a” and “b” are the positions on the vertical axis (z-axis) at the beginning and end of the thread. Since the Hook’s law can be applied on the relationship between the displacement and the resistance at each small portion, upS is obtained by multiplying the relative displacement between the wood and screw (δR) with the pull-out stiffness of the screws per unit length (ukS).
 (4)
(4)
The displacement of the wood (δW) changes along the depth direction as shown in Figure 2. Especially in the case of partial compression, the displacement distribution becomes nonlinear shape. And it differs at each position under loading plate. Therefore, it is important to determine the shape of the δW displacement distribution of the wood.
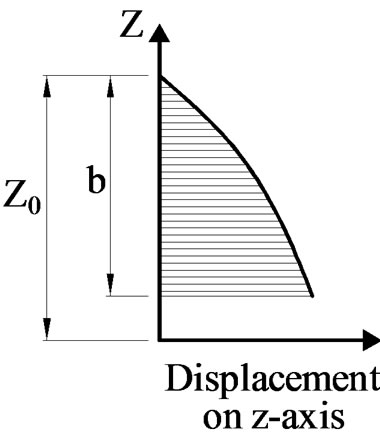
Figure 3(a) shows the assumption of the δW distribution along z-axis. δW shows the maximum value at the top surface and gradually descents to the bottom.
The displacement of the screw (δS) can be assumed to be constant from head to tip as shown in Figure 3(b). This is because the Young’s modulus of the metal screw is much higher than that of the wood. Thus, δR is obtained as the difference of δW and δS at each point along the z-axis as shown in Figure 3(c). The relative displacement at top surface of the wood becomes zero because
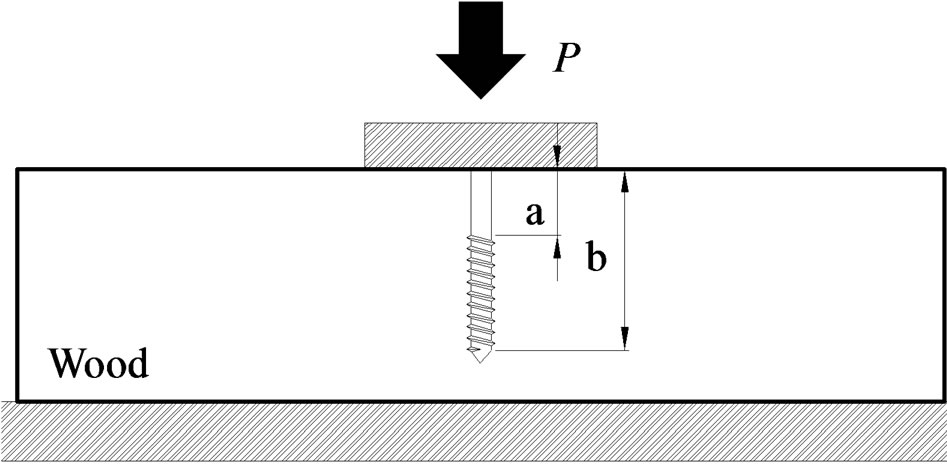
Figure 1. Position of screw thread.
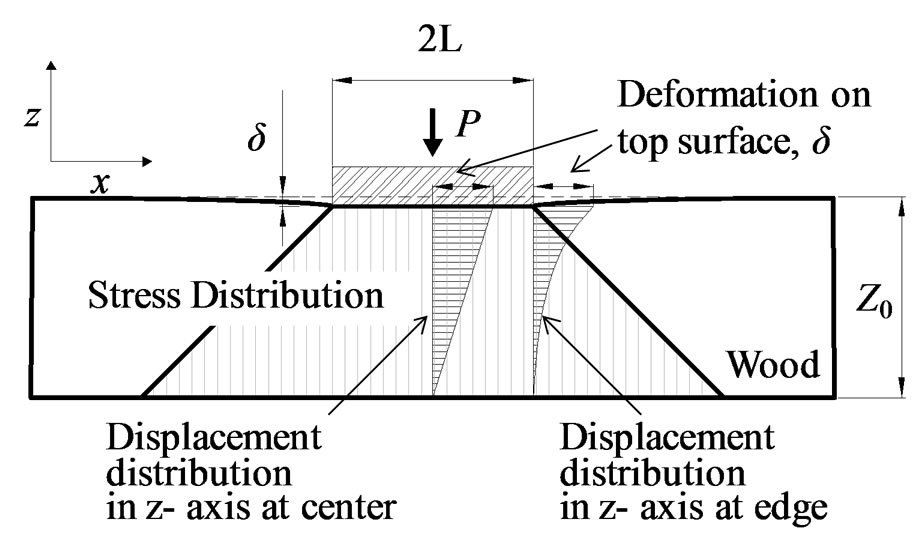
Figure 2. Model of δW.
 (a)
(a)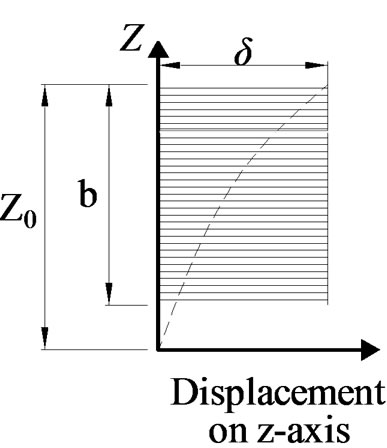 (b)
(b)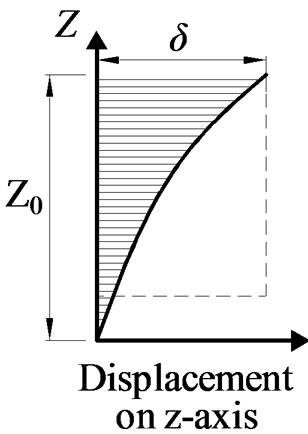 (c)
(c)
Figure 3. Displacement distributions. (a) Wood (δW); (b) Screw (δS); (c) Relative displacement (δR).
the screws move together with the loading plate downward.
In this study, we tried to provide a practical estimation model for screw reinforcement. Therefore an approximated equation was adapted for internal displacement distribution of the wood with avoiding mathematical stringency.
The following two assumptions based on Tanahashi’s report [4,5] were taken into account in the model:
1) The displacement in the direction of the x-axis is assumed to be none at any point.
2) The vertical δW distribution can be written as the Equation (5) by using the form function  (z).
(z).
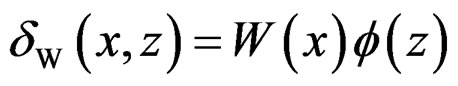 (5)
(5)
Here,
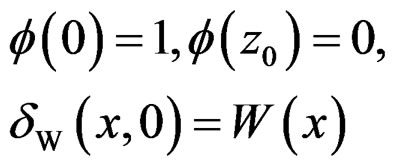 (6)
(6)
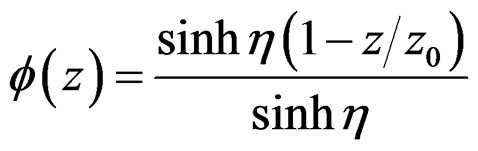 (7)
(7)
Here, η is non-dimensional constant for determining the shape of the displacement distribution. Theoretically η can be given by the relationships among Young’s modulus and shear modulus of wood [4], but the equations are too complex for the practical design method. Therefore in this study, we tried to define η in approximate function based on FEA result mentioned in the following chapter.
Because W(x) is equal to the surface displacement (δ) at contact surface under loading plate as shown in Figure 1, δW can be shown as Equation (8).
 (8)
(8)
As mentioned before, δS is equal to the sunk displacement on the surface (δ).
 (9)
(9)
δR is defined by the difference between δS and δW.
 (10)
(10)
As a result, PS is obtained by integration of upS between the screw thread parts as shown in Figure 1.
 (11)
(11)
The yield point on the bearing performance of the screw reinforced wood can be defined when either screw or the wood reaches to the yield displacement. The screw yield occurs at the tip of screw.
 (12)
(12)
Here, δS_y is the relative yield displacement of the screw and wood, and δW_y is the yield displacement of the wood in partial compression.
The yield strength (Py) can be obtained by using δy and K.
 (13)
(13)
3. Material and Method
3.1. Finite Element Analyses
In order to decide the function of η, two-dimension elastic analyses were conducted by using commercialized FEA software “MSC’s Marc (Ver. 2010)”. The end distance and width of the top plate were considered as the parameters in order to examine the influence on the δR distributions.
The dimensions of the wood used in the analysis are shown in Figure 4. The wood was supported by rigid foundation at the bottom and uniformly deformed at the top surface by the top rigid plate moved downward. Six different end distances were modeled, ranging from 0.2 to 1.5 times of the height (z0). This was decided based on the limitation of influence of end distance reported by Madsen [6]. Seven types of width of the plate variations were modeled from 0.3 z0 to 3 z0. The wood material was modeled as orthotropic characteristics by using the material constants [7] shown in Table 1 assuming Japanese cedar (Cryptomeria japonica). The contact phenomenon was considered between the loading plate, wood and foundation respectively.
3.2. The Pull-Out Test of Screws
The value of ukS and δs_y were obtained from the pull-out test with thin wood plate specimen, in which the shear stress along the screw is almost uniform. The setup is shown in Figure 5. Japanese cedar (Density in dry condition. 303.3 ± 23.3 kg/m3, Moisture content: 11.0 ± 0.6% of 90(L) *90(T) *14(R) [mm] in size were used as the base member, where “L”, “T” and “R” stands for longitudinal, tangential and radial direction respectively. The screws with thread’s outer diameter of 6.2 mm and inner diameter of 4.4 mm were inserted at the centre of the specimen into radial direction.
A lead hole with which the diameter is equivalent to 80% (3.5 mm) of the inner diameter of the screw was pre-drilled to prevent cracks on the wood. A metal plate with a hole of 6.5 mm in diameter was used to hold specimen (Figure 6) to avoid the unfavorable bending and shearing deformations around the screw. Five samples were tested for each test condition. The tensile load was applied to the head of the screw through universal test machine (Instron: Model 1125) at the constant speed of 0.3 mm/min. The test was terminated when the load decreased to 20% of the maximum value. The value of the applied load was divided by the specimen’s thickness of 14mm for obtaining the performance per unit length along screw axis.
A representative unit load-displacement curve was shown in Figure 7. The load suddenly dropped down after elastic region. Thus, the maximum point was used
Figure 4. Dimensions in FEA.
to determine the specific properties. The load and displacement at the maximum point were defined as upy-S and δy-S respectively. The slope of the line going through the origin point and maximum point is defined as ukS.
Table 1. Elastic constants.
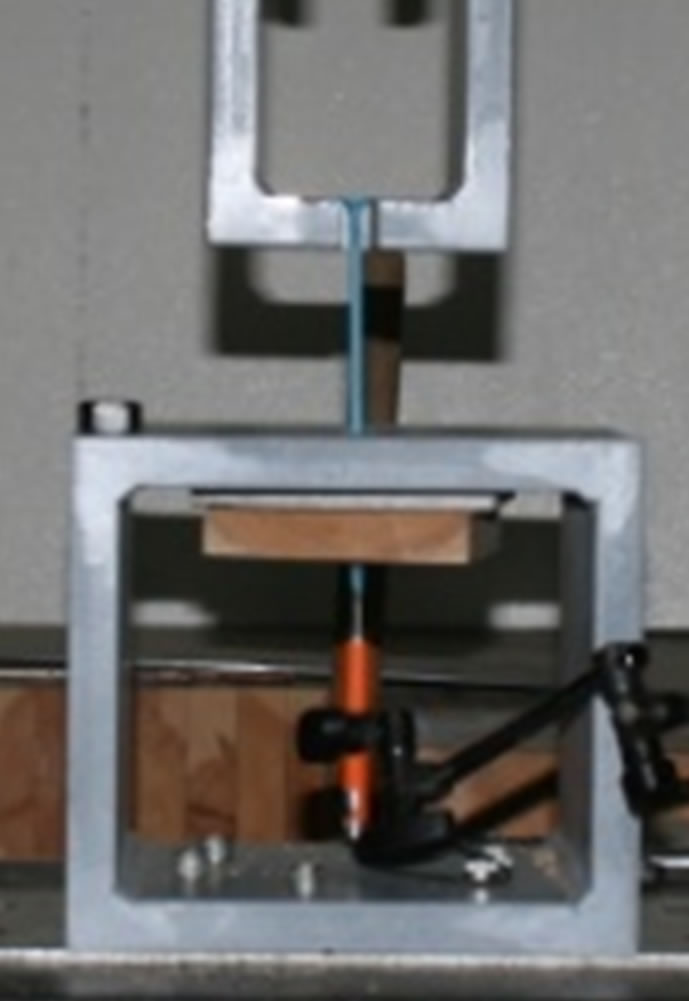
Figure 5. Set-up of jig.
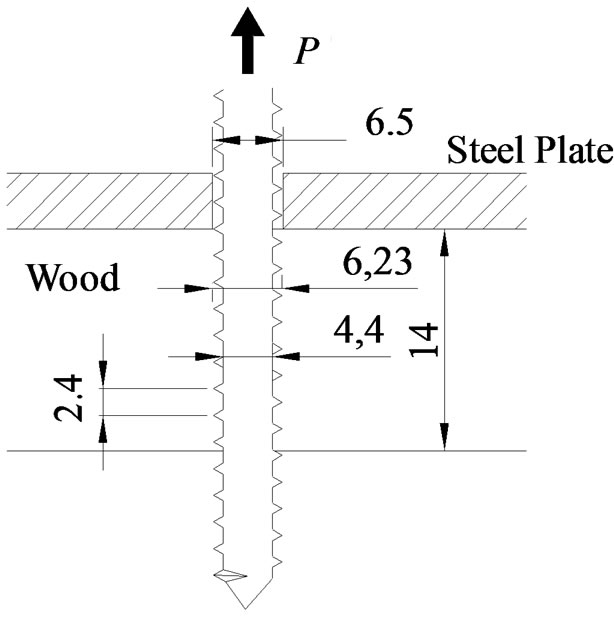
Figure 6. Cross-section of specimen.
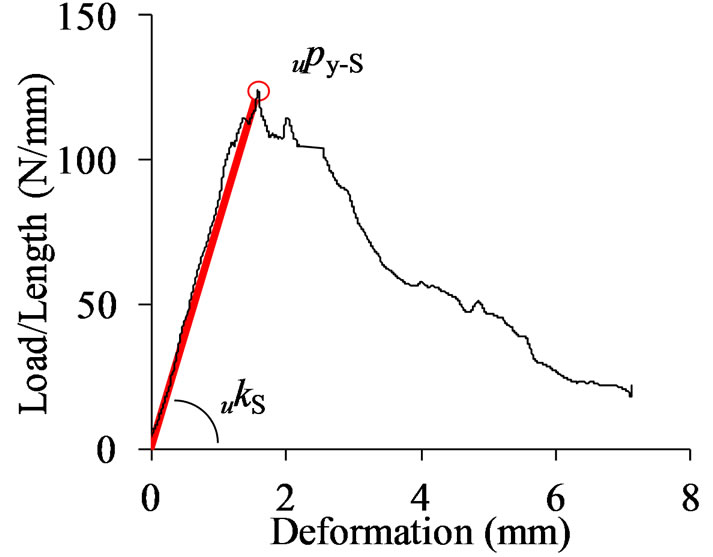
Figure 7. Determination of characteristic values of screw.
3.3. Partial Compression Test
For the verification of the models, the partial compression tests for wood reinforced by screws were conducted. Glued laminated timber (GLT) made of Japanese cedar (Density in dry condition: 372.9 ± 26.1 kg/m3, Moisture Content: 10.7% ± 2.3%) with the dimensions of 400 (L) *100 (R) *20 (T) [mm], was used (Figure 8) to make sure the homogeneity of the material. The centre of the compression was compressed by steel plate with the length of 100 mm.
The test parameter was the position of the thread of the screws in the vertical (z) and horizontal (x) axis. In order to change the positions of the thread on z-axis in the wood, four types of the screws with different lengths were used (Figure 9), which have the equal thread length of 20 mm and the shank part of different length. After inserting the screw up to the designated position, the protruded parts of the screws over the wood’s surface were cut by a grinder. The shapes and dimensions of the inner and outer diameter of the thread as well as the pitch are the same as those described in the pull-out tests. A couple of screws were inserted into the specimen symmetrically from the centre of the specimen.
The positions of the screws in the x-direction were 10, 30, 40 and 45 mm from the centre of the specimen as shown in Figure 10.
Holes of 5 mm in diameter were pre-drilled in the specimens up to the thread part of the screw to prevent friction between the shank of the screws and wood. And holes of 3.5 mm in diameter were drilled in the corresponding part of the specimen to the threaded part of the screws. The unreinforced specimens were tested as the reference. Five replications were tested for each condi-
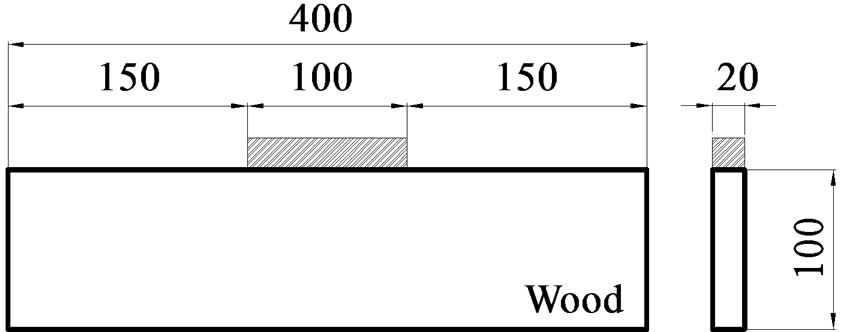
Figure 8. Dimensions of test specimens.
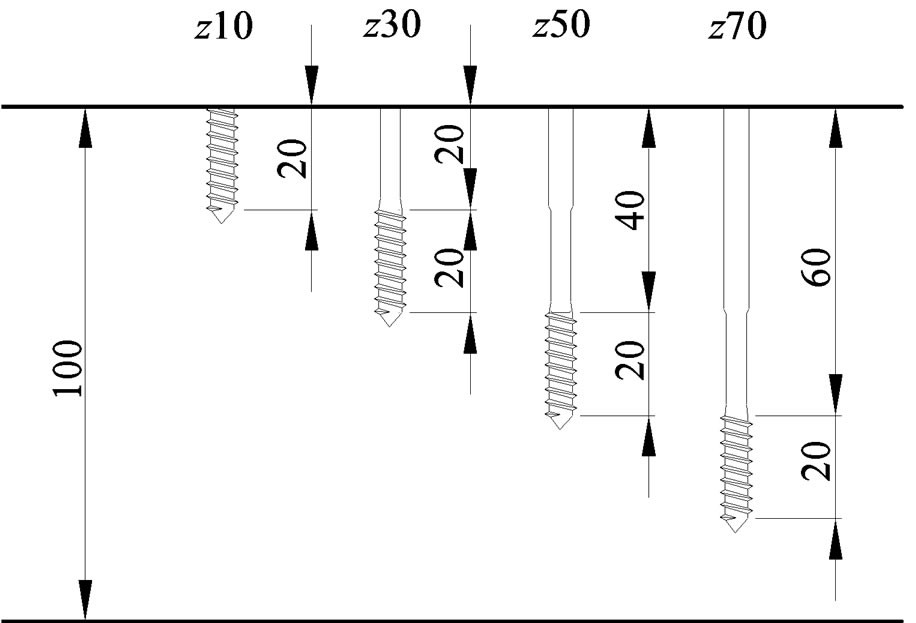
Figure 9. Positions of the thread on z-axis.
tion. The compressive load was applied to the plate at the constant speed of 0.3 mm/min until displacement of the plate exceeded 5% of specimen’s height.
In Eurocode [8], the intersection of the load, displacement curve and the offset line of the stiffness line by 1% of the specimen height are defined as yield point. However, this method gives rather bigger value than the proportional limit. In this study, in order to obtain the value close to proportional limit, Japanese standard method [9] for bilinear approximation was used. The specific values of initial stiffness (K) and yield strength (Py) were calculated by using the automatic extraction program “PICKPOINT [10]” as shown in Figure 11.
4. Result and Discussion
4.1. Results on FEA
The δW on the cross-sections at the centre of specimen (m-m’) and those of δW on the cross-sections at the edge of loading plate (n-n’) as indicated in Figure 5, were obtained from the FEA results when the loading plate were moved by 0.1 mm downward. Figure 12 shows the variation of the δW distribution among the cases of the different end distances and plate widths. Figure 12(a) indicates that there is no significant difference among the results of the various end distances on the cross section at the centre. The same tendency was also observed in the cross-section at the edge of the loading plate except the case of the end distance of 20 mm as shown in Figure 12(b). The δW distribution in m-m’ section showed almost strait form. On the other hand, the swelled form of
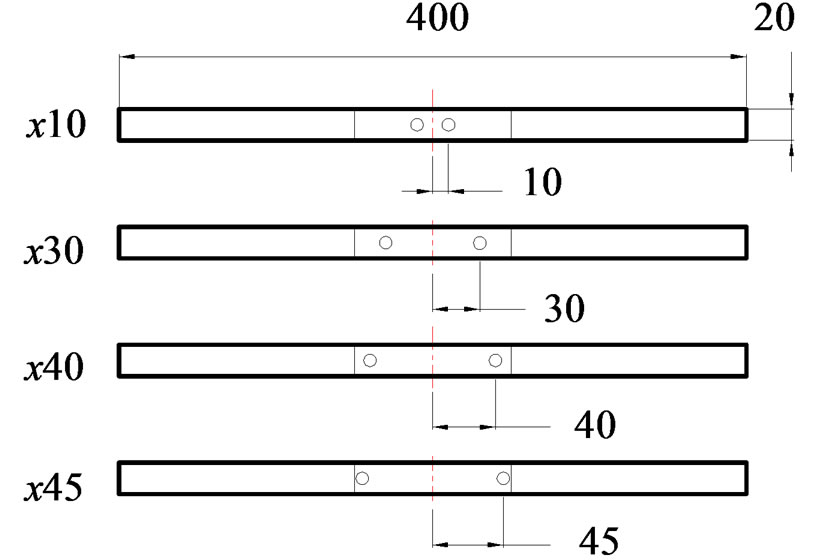
Figure 10. Positions of the thread in the x-axis.
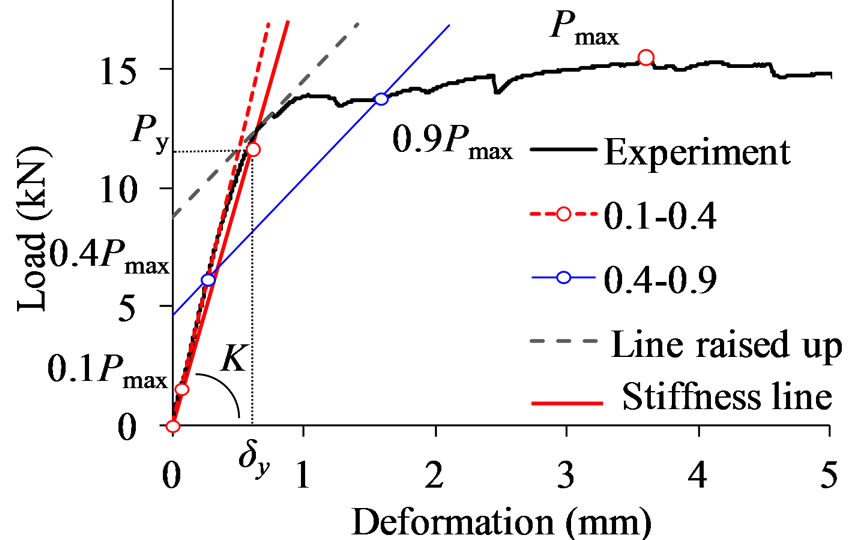
Figure 11. Calculation method of K and Py.
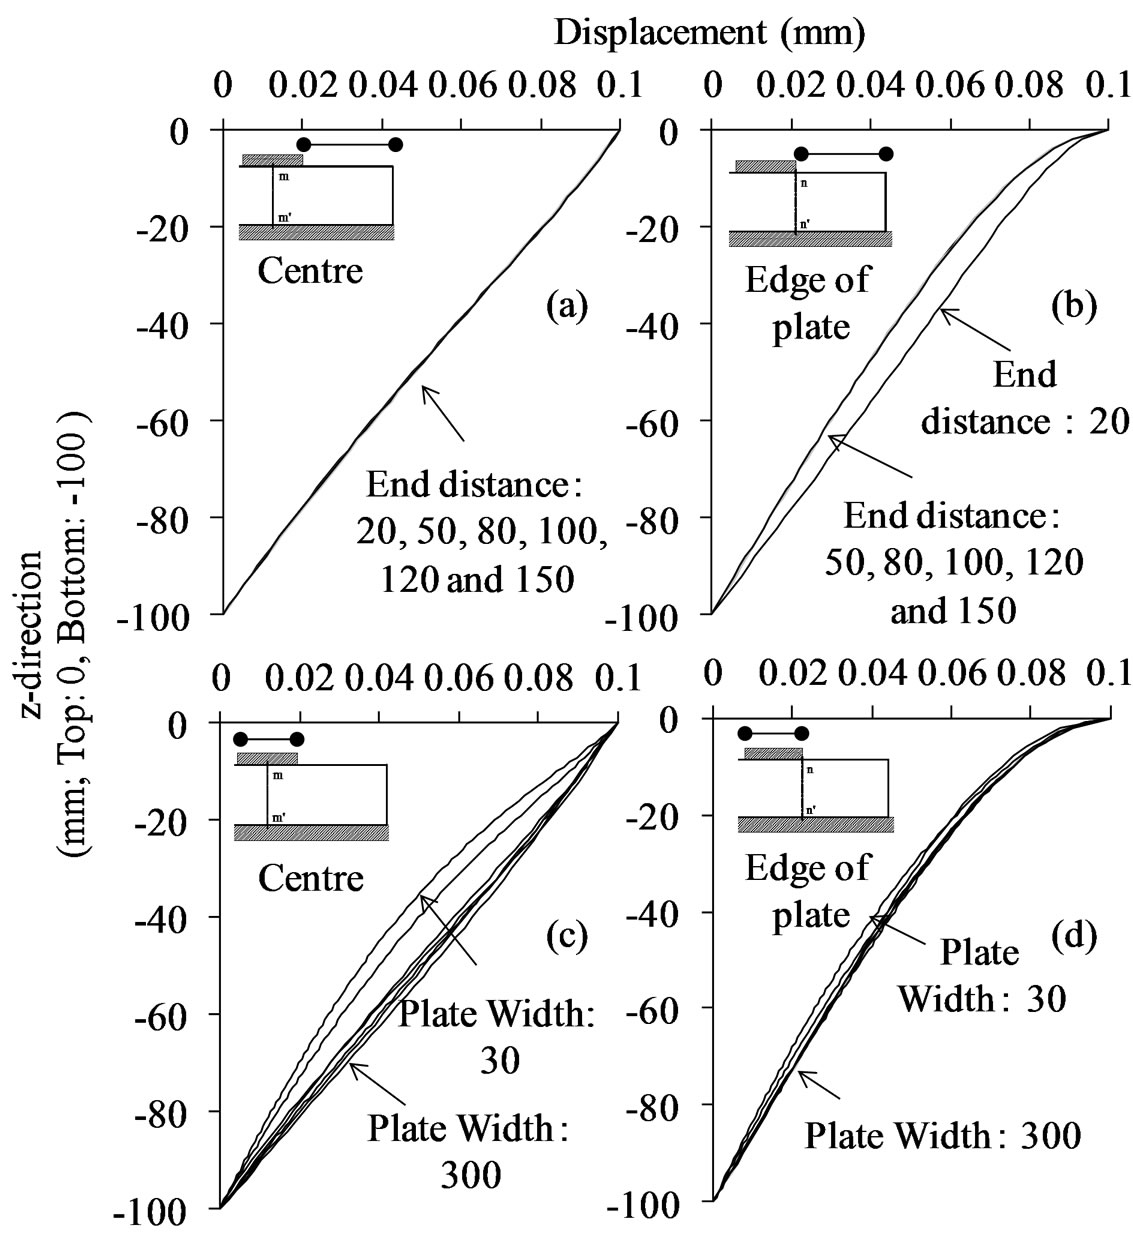
Figure 12. Displacement distribution by FEA.
δW distribution in n-n’ section indicates the influence of stress spreading in partial compression. Observation from Figure 12(c) shows that the δW distributes linearly except the condition that the width of the plate is extremely short. When the top plate becomes extremely wide, it can be considered that the δW distribution in the m-m’ section becomes identical to that of full compression. The δW distributions in the n-n’ section appears to be similar regardless of the plate width difference as shown in Figure 12(d).
η was obtained from least square approximation method with Equation (8) for δw distribution of FEA results. Then, the value of η on the cross-sections of n-n’ and m-m’ were 1.87 and 0.02 respectively. Those values were rounded off to the natural number of 2 and 0. These results are shown in Figure 13. Figure 14 shows change of δw distributions depending on the position of the cross-section obtained from FEA. It is observed that the curvature of δw distributions become steep as the position goes from the centre to the edge. Thus, we assumed that η changes linearly from the centre to the edge. η can be expressed by linier function of x regardless of the end distance or the plate width.
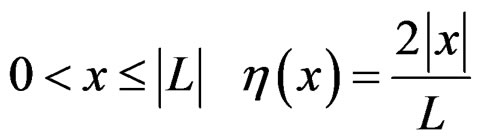 (14)
(14)
Here, L is the half length of the loading plate. The predicted curves by Equation (14) were compared with the FEA results in Figure 14, in condition of 100 mm in the plate length and 150mm in the end distance. It was shown that both agree fairly well.
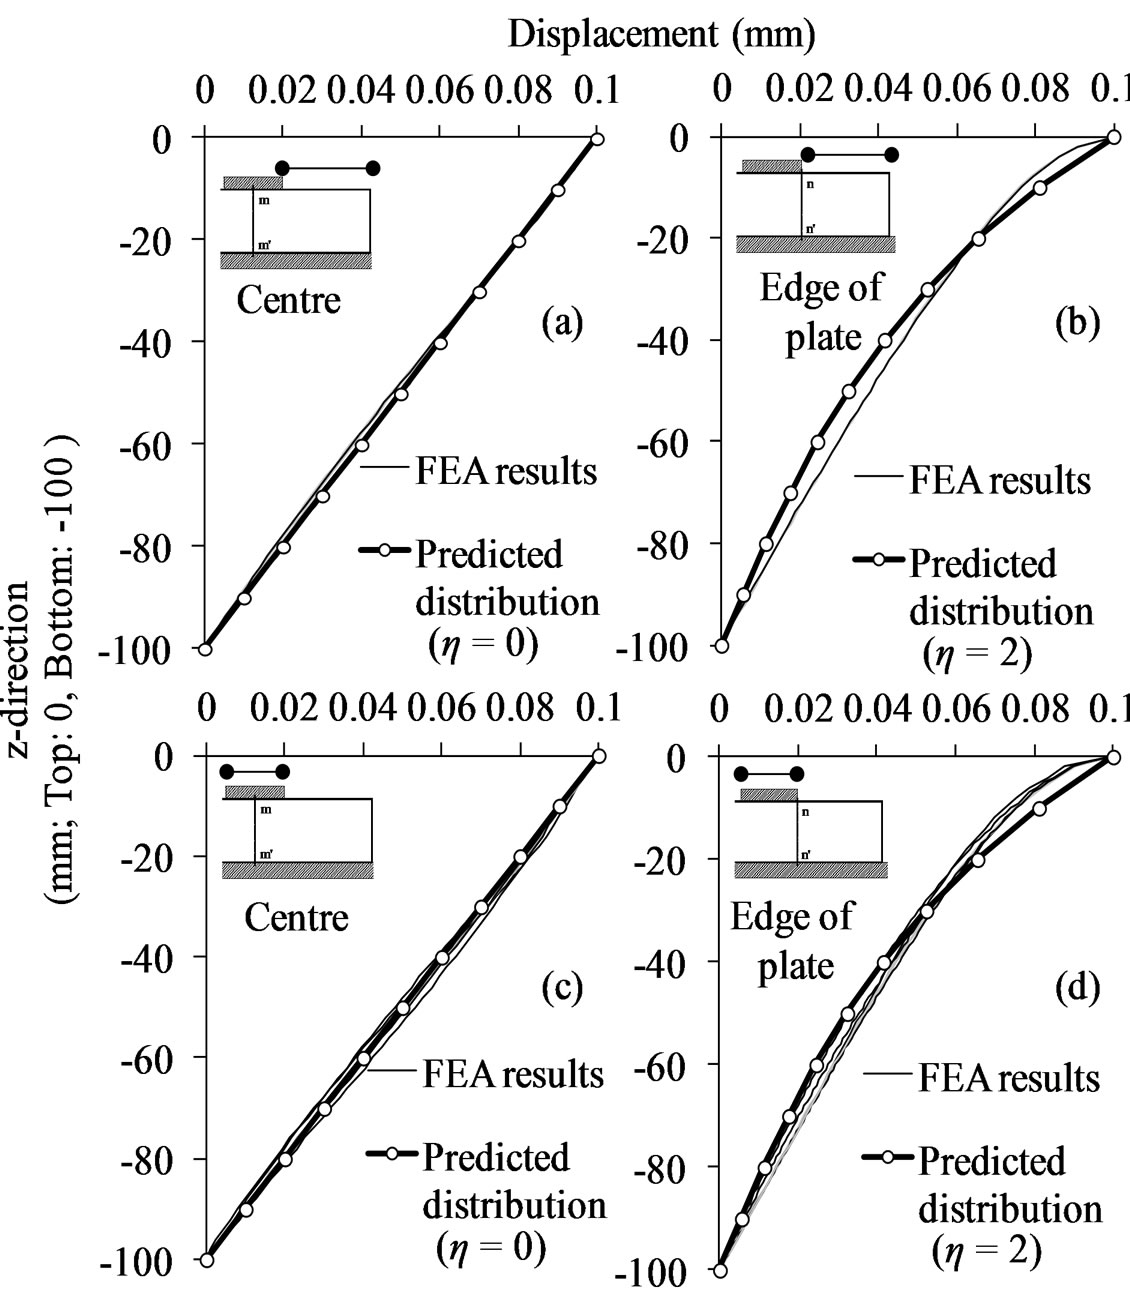
Figure 13. Predicted displacement distributions.

Figure 14. Displacement distribution on each cross-section.
4.2. Pull-Out Test for Screws
Characteristic values obtained from the tests are shown in Table 2.
4.3. Partial Compression Test
Figure 15 shows the typical relationships between load and displacement (the condition of x10z10, x30z30 and x45z70). The curve drawn in circular dots indicates the averaged result of non-reinforced specimens.
Comparing the results with and without screws, the improvement in strength is obvious. In the cases of the non-reinforced samples, the load kept increasing even after yield point. The same tendency was observed in the cases where the screws inserted at shallow portion. On the other hand, the increase of the load after yield point didn’t occur in the deeply inserted the screws. The sudden decreases in the load were not observed in any condition.
For the prediction of initial stiffness and yield strength, the performances of the screw shown in Table 2 were used. Kw in the Equation (2) and δW_y in the Equation (12) were obtained experimentally using the test result of non-reinforced specimen by following bi-linear approximation method. It was shown that the experimental results are closely according with the predicted results obtained from the equations in Figure 15.
Figure 16 and Figure 17 show the comparisons of experimental and predicted values for initial stiffness and yield strength. Each graph corresponds to the results of the different positions of the screws on z-axis. The hori-
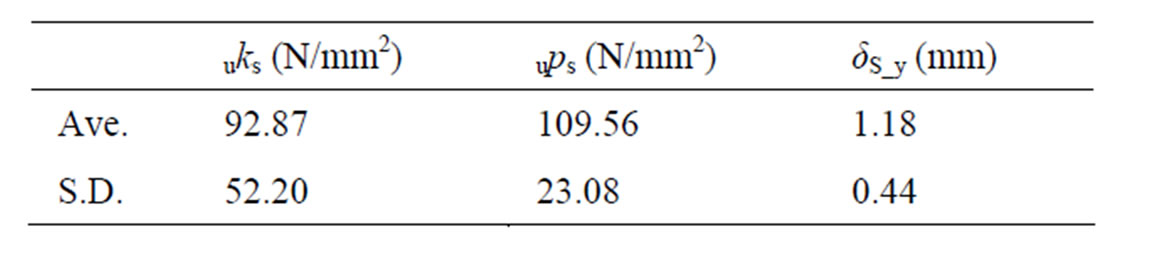
Table 2. Characteristic values obtained from test results.
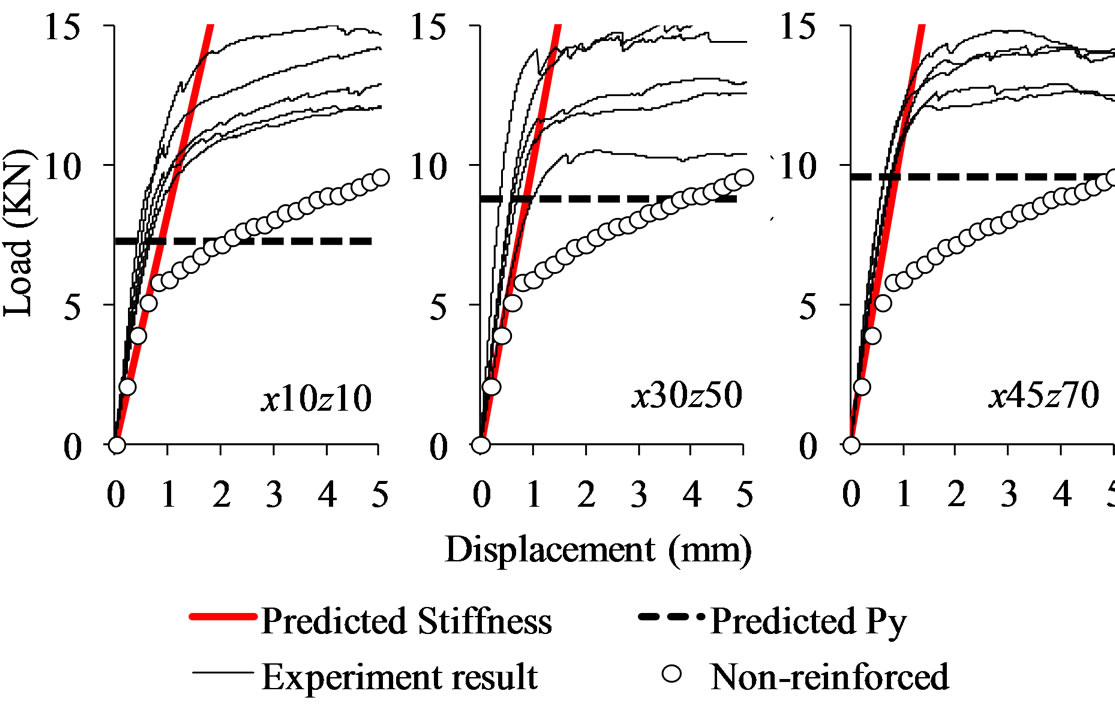
Figure 15. Relationships between load and displacement.
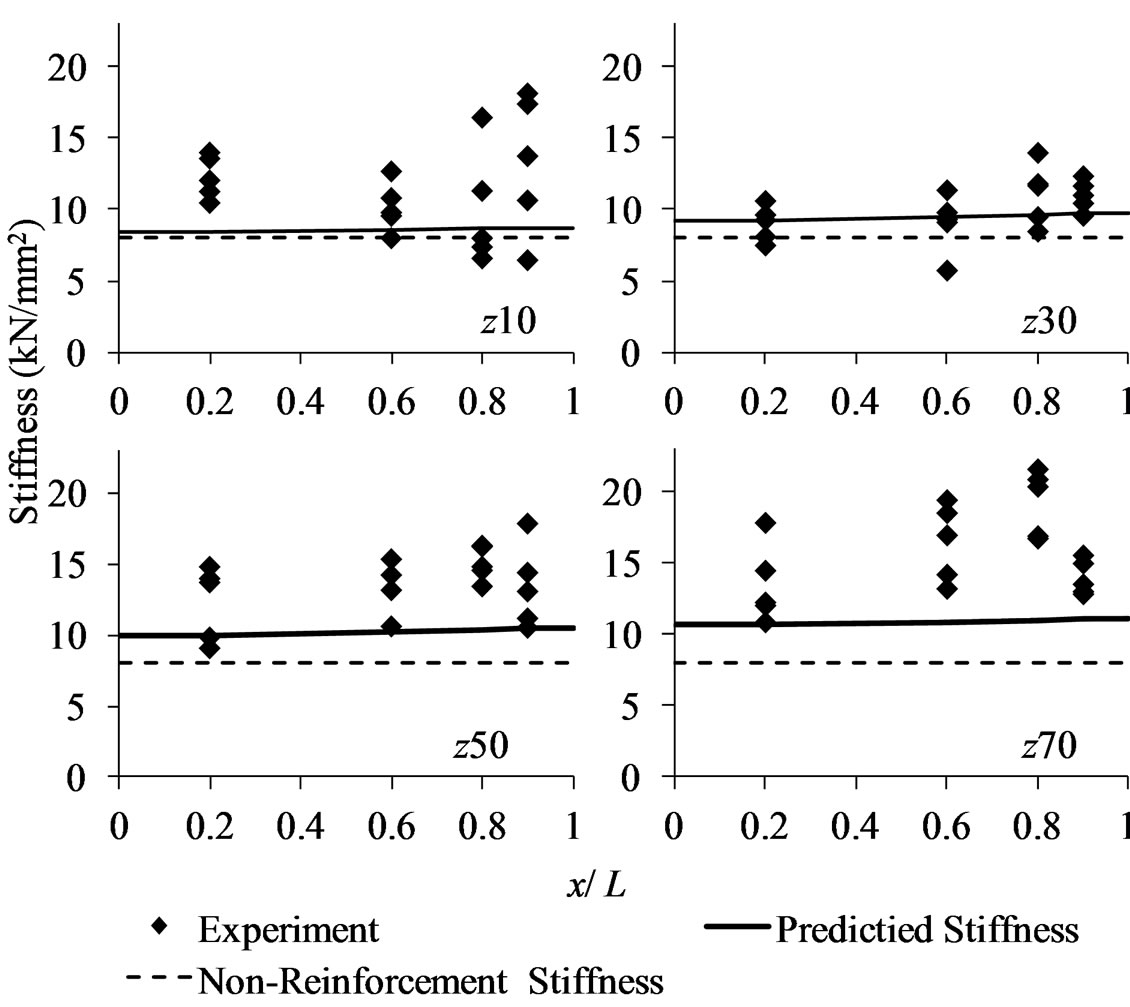
Figure 16. Initial stiffness on each condition.
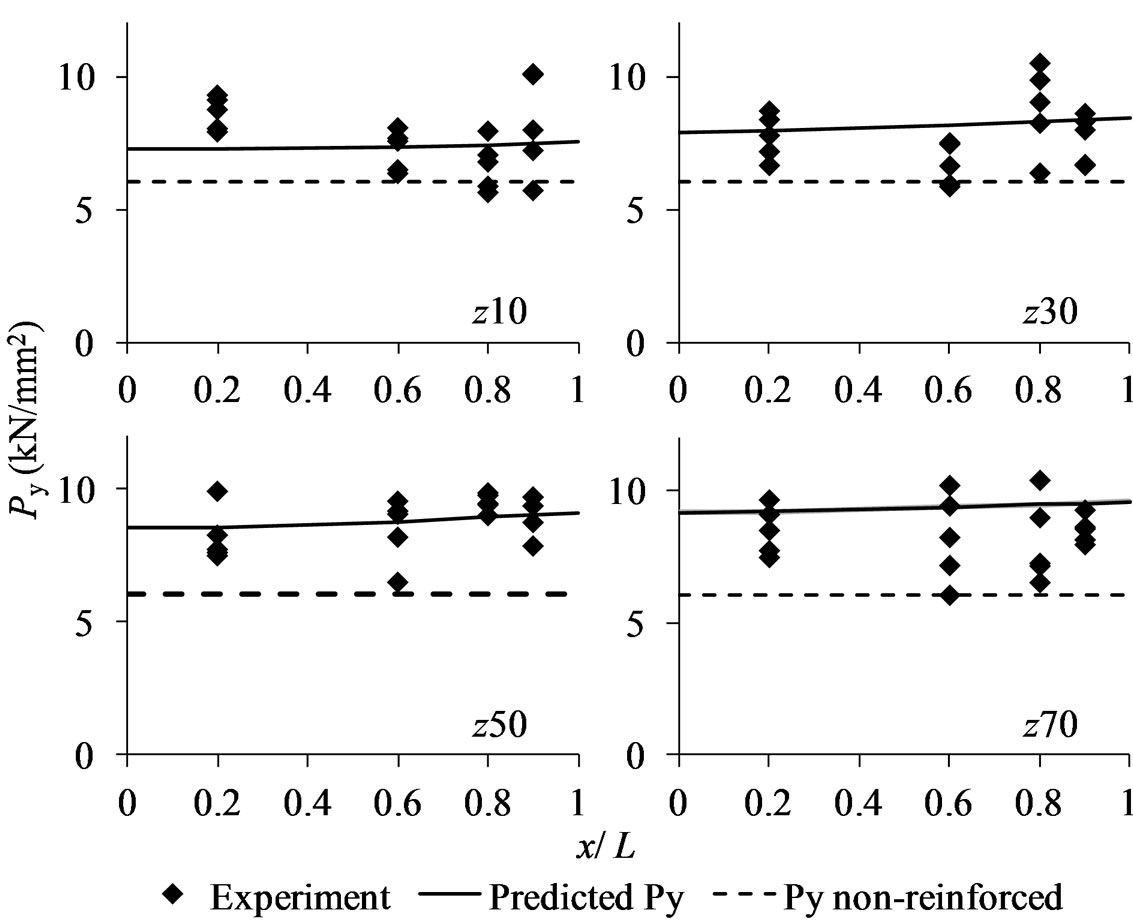
Figure 17. Yield strength on each condition.
zontal axis of the graphs indicates positions of screw on x-axis.
Although experimental results showed big variation, the tendency of the change on the initial stiffness and yield strength of the experimental result in accordance with the position of the screw thread was well estimated by the analytical model. There is a tendency that the stiffness and yield strength increases as the screws are inserted into the wood at the area closer to the edge. Also, it was found that inserting the screws into the wood at deeper position bring the higher initial stiffness and yield strength.
Depending on the prediction, the initial stiffness and yield strength are increased by the same value of 38% respectively in comparison with non-reinforce specimen. KS and the strength created by the screw at the yield point on the condition of x50z10 were 8.23 times higher than those on the condition of x0z10 in terms of the prediction.
5. Conclusion
Proposed equations appear to be satisfactory for the evaluation of the initial stiffness and yield strength of the bearing performance of wood reinforced by the screws. It was found that the screw reinforcement is more effective when its thread is arranged more deeply from the contact surface and close to the compressed edge.
6. Acknowledgements
The authors would like to thank to Kokubu Corp. for the aid on the material. We used the supercomputer of ACCMS, Kyoto University.
REFERENCES
- T. Holmes and R. Harris, “Use of Non-Metallic Dowels to Control Vertical Movement in Platform Timber Frame Buildings,” Master’s Thesis, Bath University, Bath, 2011.
- I. Bejtka and H. J. Blass: “Self-Tapping Screws as Reinforcements in Beam Supports,” CIB-W18, Florence, 2006.
- I. Bejtka, “Verstärkung von Bauteilen aus Holz mit Vollgewindeschrauben,” Band 2 der Reihe Karlsruher Berichte zum Ingenieurholzbau. Herausgeber, Karlsruhe University, Karlsruhe, Germany, 2005 (In German).
- H. Tanahashi, H. Shimizu and Y. Suzuki, “Elastic Surface Displacements of Orthotropic Wood Due to Partial Compression Based on Pasternak Model,” Journal of Structural Construction Engineering, Vol. 609, 2006, pp. 129-136. (In Japanese)
- V. Z. Vlasov and N. N. Leont’ev, “Beams, Plates and Shell of Elastic Foundation,” Israel Program for Scientific Translations, 1966.
- B. Madsen, R. F. Hooley and C. P. Hall, “A Design Method for Bearing Stresses in Wood,” Canadian Journal of Civil Engineering, Vol. 9, No. 2, 1982, pp. 338-349. doi:10.1139/l82-035
- Forest Research Institute of Forestry Agency, “Handbook of Wood Industry,” Maruzen, Tokyo, 1982 (In Japanese).
- EN 408: 2003 Timber Structures. Structural Timber and Glued Laminated Timber, Determination of Some Physical and Mechanical Properties, 2006
- Architectural Institute of Japan, Standard for Structural Design of Timber Structures, Maruzen, Tokyo, 2006, pp. 108-109 (In Japanese).
- M. Karube, M. Harada and T. Hayashi, “A Proposal of Bi-Linear Modeling Tool for Assess Its Method and Problems in Common Tool for Load-Deformation Curves of Wooden Structures,” Digests of Annual Meeting of Architectural Institute of Japan, C-1, III, 2001, pp. 215- 216 (In Japanese).