Open Journal of Social Sciences
Vol.04 No.05(2016), Article ID:66647,12 pages
10.4236/jss.2016.45019
Where Is Nepal in the Demographic Transition within the Wider Context of the Nutrition Transition?
Yagya Prasad Subedi1*, Padam Simkhada2, Edwin van Teijlingen3
1Division of Applied Health Sciences, University of Aberdeen, Aberdeen, UK
2Centre for Public Health, Liverpool John Moores University, Liverpool, UK
3Faculty of Health & Social Sciences, Bournemouth University, Bournemouth, UK

Copyright © 2016 by authors and Scientific Research Publishing Inc.
This work is licensed under the Creative Commons Attribution International License (CC BY).
http://creativecommons.org/licenses/by/4.0/


Received 19 April 2016; accepted 20 May 2016; published 23 May 2016
ABSTRACT
Historically, the process of nutrition transition begins with the shifts in demographic transition, moving away from high to low mortality, high to low fertility, high percentage of young population to high proportion of elderly population, high to low population growth rate; and short to long life expectancy at birth. The objective is to identify where Nepal is in demographic transition and whether demographic transition is considered as one of the proximate covariates of nutrition transition. Nepal’s position in the demographic transition has been identified by using Popkin’s framework which is scaled from Pattern I to Pattern V. The time series trends indicated that new patterns of demographic transition have been observed during 1995-2010, which is similar to the pattern IV of the nutrition transition as described by Popkin. Before 1970, the death rates were fluctuating around 30 to 50 deaths per thousand populations. The birth rate per thousand populations was more than 44, which was really high. Both fertility and mortality appear to start declining from 1970. During 1995-2010, birth rate declined from 38 to 24 per thousand populations. The time series trends indicated that new patterns of demographic transition have been observed during 1990-2010, which is similar to the transition between Pattern III and IV of the nutrition transition. Nepal is a country with faster declined in mortality followed by fertility decline, increasing life expectancy above 60 years, decreasing age-structure of below 15 years of population, increasing trends of urban population and beginning of large scale international migration. It may be concluded from above evidences that Nepal is across the new pattern of transition after 1990s in the demographic transition including the increasing risk of chronic diseases of elderly people related to excess consumption of fat, sugar and process foods.
Keywords:
Demographic, Nutrition, Chronic Diseases, Food, Fat, Transition, Nepal

1. Introduction
Demographic transition is a description of the observed long-term trends in fertility/mortality, age structure, and longevity and residency patterns [1] . In traditional societies both the fertility and mortality were high and in modern society both fertility and mortality are low. In between, there is a demographic transition. The theory of demographic transition classified various countries into three categories: the countries with high birth rates and high but declining death rates; declining birth rates and death rates, with death rates declining faster; and rapidly declining birth rates and death rates, with birth rates declining faster.
A considerable amount of literature has been published on the demographic and nutrition transition in developing countries. These studies have indicated that demographic and nutrition transition is underway and rapid in such countries, with the simultaneous co-existence of undernutrition and obesity [2] . It is speculated that the process of demographic transition in Nepal began during the 1990s. However, patterns and trends of demographic transition in Nepal are continuously changing. In this circumstance, this study addressed the following research questions: Is Nepal a country in demographic transition? Where is it in each stage of the demographic transitions? What explanations are associated with these transitions?
2. Objectives
The main aim of the paper is to identify the demographic transition in Nepal over the past four decades. The specific objectives are as follow, to:
1) identify the shifts and time-series trends of population dynamics to explain where Nepal was in the demographic transition.
2) describe the patterns of these changes observed in population dynamics in Nepal.
3) locate Nepal within the Popkin’s frame-work of the nutrition transition.
3. Data and Methods
This study adopts Popkin’s methodology for the identification of Nepal’s position in demographic transition [2] . There are ten proxy foci identified by Popkin to describe the nutrition transition, which are grouped into four categories―economic, demographic, dietary and epidemiological transitions for the purposes of this analysis. Demographic variables include four proxies: a) mortality/fertility; b) age-structure; c) life expectancy or longevity; and d) residency patterns (Table 1).
Although time series data generally exhibit random fluctuations, a time series may also show gradual shifts or movements to relatively higher or lower values over a longer period of time. If a time series plot exhibits this type of behaviour, we say that a trend pattern exists. A trend exists usually with the long-term dynamic variables/factors such as changing demographic characteristics - crude birth rates, crude death rates, age structure, life expectancy at birth and urban populations.
The average annual percentage of change/growth of demographic proxy variables for the period of forty years starting from 1970 to 2010 have been computed using two methods. The first one is annual growth rate method hat that would take the country from first year’s level to the last. The formula for the average growth/change rate adopted for the computation is = {100*(
The second one is ordinary least squares trend-line plotting method to predict the annual rate of growth for the exponential time line equation, which is minimizes the sum of squares of the difference between actual time series data and predicted time series data. Therefore, the estimated trend line is fitted best to capture the real trend of the past 40 years.
The data types included in the CBS/N databases were:
1) Population Censuses

Table 1. Data sources for demographic explanatory variables.
2) Demographic Sample Surveys
3) Vital Registration
4) Population Registers
5) Administrative Statistics/Official records
According to broader framework of the nutrition transition, birth/death rates, age structure, life expectancy at birth, and residency patterns were considered as proxy foci to identify the position of demographic transition in Nepal. Age structure, prevalence of population ages 0 - 14; 15 - 64; and 65 and over, and young and old dependency ratios were considered as additional demographic explanatory variables. Young dependency ratio is defined as the proportion of 0 - 15 years’ population divided by 15 - 64 years’ population. Elderly/old dependency ratio is defined as the proportion of 65+ years’ population divided by 15 - 64 years’ population. Rural, urban, and total population were used as explanatory variables for residency patterns.
The operational definition of the variables used by national statistical office and computation techniques are presented as follows. Population growth rate, the annual growth rate of population, was computed based on the natural logarithmic technique. The crude birth rate (CBR) is a measure of the rate of births among a population; it measures growth or decline of a population. Similarly, the crude death rate (CDR) is a measure of the rate of deaths among a population. The natural increase (NI) of population can be observed from the difference between CBR and CDR in the population of 1000 (or 100). Rates of CBR, CDR and NI was available from the census data of CBS/N. Proportion of population ages <15, 15 - 64, >64 (% of total) are the population between the ages of defined category ages less than 15, 15 to 64, more than 64 years as a percentage of the total population. This information was available from population databases of Ministry of Health and Population, and census databases of the Central Bureau of Statistics.
Life expectancy at birth: the estimated number of years that a newborn could expect to live, if he or she were subject to the age-specific death rates of a given period. It measures how many years a new-born baby will be expected to live on average given current age-specific death rates. Life expectancy at birth is an indicator of longevity, mortality conditions and, by proxy, of health conditions. Age-specific death rates were required to compute the life expectancy at births that were available in the population databases of Ministry of Health and Population (MoHP), Nepal and census databases of CBS/N. Infant mortality rate; The number of infants, out of every 1000 babies born in a given year, who die before reaching age 1 [13] . Infants’ birth and death information was available from health databases of MoHP and census databases of CBS/N.
However, the data gaps are also bridged up from the international databases including Population Reference Bureau (PRB) and United Nations Development Indicators to compare the countries of the south Asia. Initially, the data were collected in five years’ interval. Following this, the average annual rate of change for the past forty years starting from 1970 (or 1990) to 2010 was computed using natural logarithmic growth rate formula.
4. Literature Review
Demographic Transition
Initially the concept of “Demographic Transition” was developed by the American demographer Warren Thompson, by observing the changes, or transitions, in birth and death rates in industrialized societies over the past two hundred years or so [1] . The demographic transition describes the change from pre-industrial high fertility and mortality to post-industrial low fertility and mortality. Decline in mortality―especially infant and child mortality marks the beginning of almost all-demographic transition. The population growth is between the fertility and mortality. The demographic transition must be accompanied by a cycle in population growth and in the age structure. Changes in the structure are especially intensified since infants and children enjoy most of the early declines in mortality [3] . Most countries have seen child and adult survival rates increase during the first stage of their demographic transition. This has usually been followed by a decline in fertility in the second stage and, thus, strongly decreasing young dependency ratios [4] .
Demographic transition also called demographic evolution, each hypothesis established by many demographers such as Thompson, Notestein, Blacker, Davis and so on, many widely supported. They wanted to explain population change in association with the modernization processes, which started in the later part of the 19th century. However, it should be noted that this hypothesis is exclusively based on the historical experience of Western countries [5] .
Embedded in the classical demographic transition theory is the concept of modernization and development, which brings about changes in mortality and fertility. Initially decline in mortality takes place and fertility decline is the response to this decline in mortality. Timing of fertility response depends on the level of development and modernization in the countries concern [6] .
However the European fertility project which found no evidences of association between socioeconomic development and demographic change [5] . Caldwell provided further critique to demographic transition theory by stressing the importance of western values regarding nuclear families. In another words western values were more important than the level of development [6] . Caldwell’s argument has also been challenged by the different studies, which have cited the presence of nuclear families before the demographic transition [7] . Finally, it should be noted that demographic transition should include not only vital events, but also mobility transitions, which has not been dealt explicitly by classical traditional demographic transition theory. The reason is that migration and distribution of population is not only concomitant with fertility and mortality, but also closely related with modernization [5] .
Although there is still some controversy over the demographic transition theory, it is still an important theory commonly discussed to explain the demographic changes, which are taking place around the world. The first stage of demographic change is the time when the both the fertility and mortality fluctuate and are quite high. This is the period when the natural growth rate of the population is quite low [8] [9] . The second stage of transition is when the mortality starts to decline while fertility remains more or less constant this is the period when the growth rate starts to take place [10] .
At the third stage, fertility also starts to decline as a response to declining mortality. Finally the fourth stage is when fertility and mortality are quite close and fertility is close to response replacement and fluctuates according to different environmental conditions [11] .
The outcome of demographic transition has been already capitalised by the western and Southeast Asian countries through demographic “dividend”. The demographic dividend is delivered through a number of mechanisms. The most important are labour supply, gross domestic savings, and human capital formation [3] .
The demographic transition affects labour supply in two ways. First, there is an essentially mechanical effect, based on the regular and inevitable aging of the baby boom generation. When this generation is between 15 and 64, it is more likely to be working, thus lowering the ratio of dependents to non-dependants [10] . During the peak working years of 25 to 59, this effect is especially strong. The number of people who would like to work (labour supply) therefore gets bigger, and provided the labour market can absorb the larger numbers of workers, per capita production increases [12] .
Second, women are more likely to enter the workforce, as family size declines. This effect is magnified by the fact that, with adult women themselves more likely to have been brought up in small families, they are more likely to be educated [13] . This increases their productivity in the labour market, underlining progress towards a stronger workforce and smaller families [3] .
The demographic transition also encourages the growth of savings, thus improving a country’s prospects for investment and growth [9] . Again, there is an accounting and a behavioural effect at work [3] . The young and the old consume more than they generate, unlike working-age people, who tend to have a higher level of economic outputs, and also a higher level of savings [14] . Further, people tend to save more between the ages of 40 and 65, when they are less likely to be investing in their children and the need to prepare for their retirement is becoming more stable [15] . So when large numbers of baby boomers start hitting their forties, national savings will tend to rise [16] .
Incentives to make certain choices can reinforce this tendency to save among the new young baby boomers Improved health, and longevity, make saving easier and more attractive [9] . A healthy population must plan far in advance if it is to maintain its standard of living through decades of retirement [3] . A nuclear family, with both parents working, is likely to save more for the maintenance of future retirements [17] . Additionally, private household savings can provide the capital accumulation needed to finance growth, as seen in East Asia.
Finally, the demographic transition has significant effects on investments in human capital; effects that are the least tangible, but may be the most significant and far-reaching [13] . The demographic transition begins with changes in mortality that results in a population that lives longer and stays healthier. A longer life expectancy causes fundamental changes in the way that people live [3] . Attitudes to education, family, retirement, the role of women and work all tend to shift. A society, especially if it is taking full advantage of the demographic dividend, is certain to experience deep-rooted changes in its culture, as its people become more valuable assets [6] .
As life expectancy increases, parents are likely to choose to educate their children to more advanced levels. Healthier children, in turn, tend to experience greater cognitive development per year of schooling than their less healthy counterparts [3] . The result of this educational investment is that the labour force as a whole becomes more productive, promoting higher wages and a better standard of living [6] . Women and men therefore tend to enter the workforce later, partly because they are being educated for longer, but they are likely to be more productive once they start working [3] .
All these mechanisms are heavily dependent on the policy environment. A growing number of adults will only be productive if there is sufficient flexibility in the labour market to allow its expansion, and macroeconomic policies that permit and encourage investment [6] . Similarly, people will only save if they have access to adequate saving mechanisms and have confidence in domestic financial markets [3] .
Finally, the demographic transition creates conditions where people will tend to invest in their health and education, offering great economic benefits, especially in the modern worlds increasingly sophisticated economies [3] . But governments invariably play a vital role in creating an environment where high quality health and education provision is possible-necessary steps to make the most of their country’s demographic opportunities [11] .
5. Results
5.1. Size of Population
Nepal’s population of 28.8 million seems very small compared to its giant neighbours, India and China. Its high rate of population growth has been a matter of great concern for the country. The inter census annual population growth rate of Nepal was 2.05% in 1970s, but it was 1.3%, still high, in 2011. The increase in population in inter census period during 1970s was 22.7 percent in 1070, but it was 14.4 percentage in 2011. International migration has also begun in Nepal from 1991 and net out migration reached to 1,690,938 in 2010 (Table 2).
The increasing number of net out migration is an unclear matter in Nepal because there may be confounding effects of internal as well as international migration from the open boarder. There may be internal migration from the Mountain and Hill regions to the Terai, but the evidence of these figures migration are not clear. On the other hand, there is also a free flow of migrants across the open boarder between India and Nepal, which may be a very imprecise issue to infer.
5.2. Birth and Death Rates
The major two primary demographic processes that determine the structure, distribution and growth of any population are birth and death rates. The death rates in Nepal declined remarkably for the first time during 1970-1990 followed by the decline in birth rates during 1990-2010. Death rates are approaching the lower level, but birth rates are falling down but they are still relatively higher.
Crude death rates have decreased over the past four decades; but the population is still growing. The CDR per 1000 population has decreased from 22.2 in 1970 to 6.2 in 2010. Similarly, Infant Mortality Rate (IMR) per 1000 population has decreased from 167.3 in 1970 to 47.1 in 2010. The CBR per 1000 population decreased from 43.9 in 1970 to 25.6 in 2010. The TFR per woman has also decreased from 6.4 to 3.0 from 1970 to 2010. The overall population is still growing by 2.3% per annum.
Mortality in Nepal started to decline before the 1970s and the pace of mortality decline has become faster since the 1990s. CDR was a little over 35 in 1950s, which decreased to less than 20 in 1970s and further to 6.2
Table 2. Size of population in Nepal.
in 2010. IMR of around 250 per thousand live births prevailed in the country during the fifties [13] . In the seventies, it was decreased to around 170 per thousand live births. It has reached to 47 per 1000 live births in 2011.
Fertility in Nepal was declining slowly till nineties, and thereafter, it started to decline in the greater pace. The CBR is around 25 per thousand in Nepal in 2010. The level of TFR till mid-nineties was around 5. A substantial reduction in fertility can be seen during the period 2000 to 2010 when a decline of more than one child per women was observed.
The time series trend line of birth rates, crude (per 1000 people) computed from least squares trend line plotting method shows that the trend line explains approximately 96.0% of reality (R2 = 0.8592). The real annual rate of decline of birth rates, crude (per 1000 people) is 1.3% (Figure 1). The trend line equation in the graph indicates that the real decline in births was approximately 2.0% per year, but there are two distinct patterns in the periods before and after 1990. The declining rate of births before 1990 was slower than after 1990.
The time series trend line of death rates, crude (per 1000 people) computed from least squares trend line plotting method shows that the trend line explains approximately 99.3% of reality (R2 = 0.9929). The real annual rate of decline of birth rates, crude (per 1000 people) is 3.1% (Figure 1). The trend line equation in the graph indicates that the real decline in births was approximately three% per year, but there are two distinct patterns in the periods before and after 1990. The declining rate of death before 1990 was faster than after 1990, which is quite opposite to the birth rates.
Above statistics indicate that Nepal and Pakistan are, little bit behind in demographic transition whereas the demographic transition in other South Asian countries is faster than Nepalese transition, because the CBR, TFR and population growth rates are still high in Nepal compared to the other South Asian Countries (Table 3).
5.3. Age Structure of Population
The population of Nepal is comprised primarily a below 15-year population, and since the 1970s, it has always remained young. More than 36 percent of present population is under 15 years of age. More than half of the population is in the age group 15 - 64. This age structure indicates approximately one person is in the working ages (15 - 64 years) has to take care of more than one infant/young and old populations. This age structure with high dependency on working age population is mainly due to high fertility and declining mortality in all ages, particularly in below 15 ages.
The young population is relatively decreasing in Nepal, but the working age populations have been gradually increasing over the past four decades. From 1990 to 2010, the prevalence of young people (0 - 14 years) has been decreasing annually by 0.3%. An increase of 0.2% is found for the group aged 15-64 years. The important point here is that a large cohort population is entering into the working age group in coming 10 to 15 years, which is going to create large dividend to the economy if the country can invest for human capital formation. There has been an annual decrease in the young dependency ratio of 0.5%. On the other hand, the elderly population aged 65 and over, has also increased by an annual rate of 0.9%. In 1970 a large prevalence of the population (41.5%) was under 15 years of age, which decreased to 36.2% in 2010.
The time series trend line of population ages 0 - 14 (% of total) computed from least squares trend line plotting method shows that the trend line explains approximately 44.0% of reality (R2 = 0.4417). The real annual rate of decline of population ages 0 - 14 (% of total) is 0.20 % (Figure 2). There are two distinct patterns in the periods before and after 1990. The proportion of population ages 0 - 14 (% of total) population ages 0 - 14 (% of total)was stagnant before 1990, but started declining slowly after 1990; the overall annual average rate of decline for the whole period is very weak.
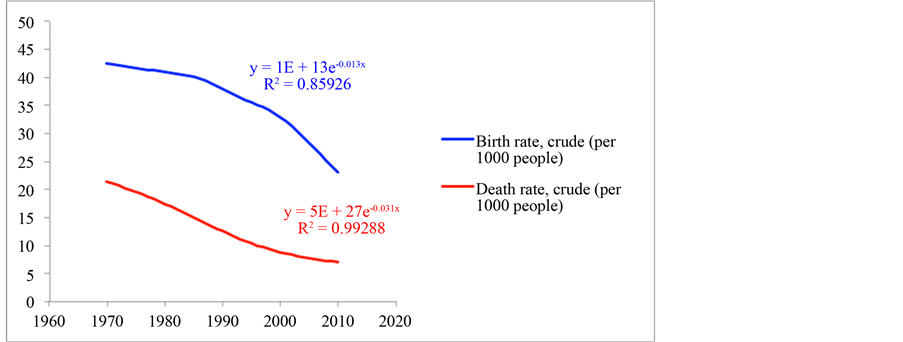
Figure 1. Birth and death trends in Nepal.

Figure 2. Age structure of population in Nepal.
Table 3. Comparison of south Asian countries.
The time series trend line of population ages 15 - 64 (% of total) computed from least squares trend line plotting method shows that the trend line explains approximately 18.4% of reality (R2 = 0.1842). The real annual rate of increase of population ages 15 - 64 (% of total), is 0.1% (Figure 2). The trend line equation in the graph indicates that the real increase in the proportion of population ages 15 - 64 (% of total) is negligible, but there are two distinct patterns in the periods before and after 1990. The growth proportion of population ages 15 - 64 (% of total) was stagnant before 1990, but started increasing slowly after 1990, the resultant annual average rate of increase for the whole period is very weak.
The time series trend line of ratio of dependents to working age population computed from least squares trend line plotting method shows that the trend line explains approximately 19.0% of reality (R2 = 0.1878). The real annual rate of decline of dependents to working age population is 0.1% (Figure 2). There are two distinct patterns in the periods before and after 1990. The proportion of dependents to working age population was increasing before 1990, but started declining after 1990; the resultant annual average rate of change for the whole period is very weak.
5.4. Life Expectancy (Longevity)
The expectation of life at birth for males was 27.1 in 1955 [19] . These figures increased to 57 in 1995. Such a significant change in life expectancy may be due to the improvement of health facilities that has reduced death rates, especially between infant and children during the last decade [13] . Life expectancy has increased by 1.2% every year. In 1970 the average life expectancy of Nepalese people was 42.81 years, which had increased to 67.6 years in 2010.
The time series trend line of life expectancy at birth computed from least squares trend line plotting method shows that the trend line explains approximately 99.2% of reality (R2 = 0.9919). The real annual rate of growth of life expectancy at birth is 1.2% (Figure 3). There is a solid pattern of growth of longevity throughout the period of past 40 years. The resultant annual average rate of growth of life expectancy at birth for the whole period is consistent.
5.5. Residency Patterns of Population
The residency pattern in Nepal has greatly changed. The proportion of urban population, considered as a proxy of urbanisation in Nepal, increased from 4.0% in 1970 to 21.0% in 2010. This includes natural increase and migration to the cities.
The time series trend line of total population (R2 = 0.9995), rural population (R2 = 0.9972) and urban population (R2 = 0.9988) computed from least squares trend line plotting method show that these trend lines explains approximately 99.9% of reality. The real annual rate of growth of urban population is 6.3%. The trend line equation in the graph indicates that the residency pattern in terms of urban population was increased by more than six per cent per year (Figure 4). The trend lines clearly indicate that the period before and after 1990 has distinctly two different patterns. The increase in urban population was slower before 1990 and became faster after 1990, but the growth of total population (2.36%) and rural population (1.96%) are uniform throughout the 40 years period.
Altogether Hill and Mountain regions comprise 77% of the total land area and have about 49.7% of the total population in 2011. Terai region comprises 23% of the total land area and contains 50.3% of the population (Table 4).
The proportion of Mountain and Hill regions population to total population was 62.4% in 1971, but it reached to 50.27% in 2011. The proportion of Terai region population to total population was 37.6 percent in 1971, but it reached to 50.3 percent in 2011 (Table 4). The proportion of Mountain and Hill region populations are gradually decreasing in each census period, but the Terai region’s proportion is increasing. The increasing number of
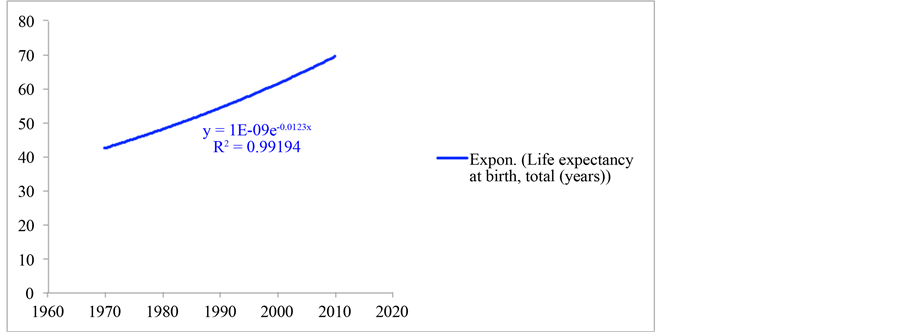
Figure 3. Life expectancy at birth in Nepal.
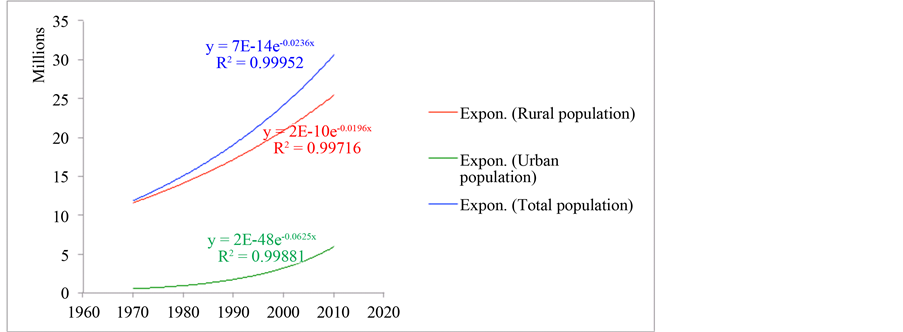
Figure 4. Urban and rural populations in Nepal.
Table 4. Geographic distribution of population in Nepal.
emigration in the Terai is not clear because there may be due to internal and/or international migration from the open boarder.
6. Discussion
Since 1950, Asia has witnessed a dramatic demographic transition, affecting the population growth rate, deaths, and births. It has implications for the environment, schooling, the position of women and social security [13] . The salient changes involved in this transition include reduction in the infant mortality rate by over two-thirds, from 184 infant deaths to 51 per 1000 live births and an increase in life expectancy at birth by 25 years; decline in the TFR by more than half, from around six children per woman to 2.6; and decrease of 0.6 percentage points in the population growth rate [11] . Although the transition has been under way across the length and breadth of Asia, its onset, speed, and present status vary greatly between and also within countries [16] . The national demographic profiles, which were generally similar in the 1950s, now differ widely and divide into three distinct regional clusters―South Asia with high population growth rate and high fertility; South-east Asia moderate with population growth rate and moderate fertility; and East Asia with low population growth rate low fertility [6] .
The population growth rates across Asia’s three regions differ greatly, ranging from 0.6% in East Asia, 1.3% in South-east Asia to 1.7% in South Asia (Mari-Bhat, 2002). Projected over the next 20 years, 65% of the increase in population (492 out of 757 million) will be in South Asia, which by 2025 would account for close to half of the population of Asia (46.2%) [11] .
Like industrial revolutions, the demographic transition takes many decades in 19th century Europe, but it has been much faster in post war Asia. The practices, investments, and technologies that had been development and put into practice in Europe did not exist in Asia [6] . There was a big gap between best health practice prevailing in industrialized Europe and local health practice prevailing in Asia. The process was speeded up even further by investment in health-improving social overhead, which was heavily financed by world funding agencies. The possibilities for an Asian catch up with the west in terms of health and demography where enormous in the late 1940s, may be driven by external factors [3] . In the half century since then, Asia has exploited the catch-up potential with such enthusiasm that it has produced one of the fastest and most dramatic transitions ever seen [18] .
Asia’s demographic transition followed the stylized model by starting with a decline in mortality rates. By the late 1940s, the crude death rate began declining very rapidly everywhere in Asia. The decline proceeded most rapidly in east Asia and it was accompanied by an increase in life expectancy from 61.2 to 74.6 years from 1960 to 1992 [6] . Similar declines occurred in southeast and south Asia where life expectancy improved from 51.6 to 67.2 and from 46.9 to 60.6, respectively [13] . In the 1950s and 1960s, most of the aggregate mortality decline was being driven by mortality decline in the youngest cohorts [3] .
There are a number of possible explanations for the rapid decline in Asian child mortality in the middle of the century, which, after all, was the real force driving the age distribution over the first two phases of the demographic transition. One possibility has already been suggested: in the 1940s, Asia escaped from four or five decades of relative isolation, ushering in an era of health technology transfer and diffusion of new public health programs and techniques [6] . Another possibility is that increased agriculture productivity and trade in food both raised nutrition sufficiently to lower infant mortality dramatically over less than a decade, and did so everywhere in Asia [18] . Perhaps, but it seem unlikely given that magnitude and timing of that mortality decline was so similar everywhere in Asia, regardless of level of development and productivity performance in agriculture [13] .
The demographic transition in East Asia was mostly exogenous. Like the stylized version, the infant mortality decline in the Asian demographic transition was followed, with a lag, by decline in fertility [11] . While the timing of the mortality decline was remarkably similar across rich and poor Asia, the lag between the drop in mortality and fertility, as well as the size of the ensuring fertility fall, varied [3] . The crude birth rate in East Asia does fall much more rapidly than it does in Southeast or South Asia, but the timing is not so different. In the most countries, like Singapore, Korea, and Malaysia, fertility began to decline about fifteen years after the child mortality drop [6] . In countries, like Thailand, the delay was longer, closer to 25 years [18] . What is remarkable about the onset of the Asian fertility decline is the very short period over which it occurred and that it was so dramatic everywhere, even where the pace of economic development was slow [6] .
There are, of course, a number of possible explanations for the decline in fertility. Two well-known demographers argue that government intervention mattered a great deal and that the intervention was distinctly Asian [3] . The general view seems to be that family planning programs have been central to the decline in Asian fertility, beginning with India in 1951 [11] .
The pace and timing of the demographic transition has led to enormously divergent trends in population growth and population age structure across Asia [6] . The ratio of the working-age population to the non-working age population for the three sub regions in Asia with only two precocious exception, Japan and Sri Lanka, Asia’s surge to peak youth dependency rates occurred in the 1960s and 1970s; reflected the low ratio of the working-age population to the non-working-age population [3] . With the exception of Japan, the elderly dependency rate has been mostly irrelevant to Asia in this century, even to the more economically mature East Asia [6] .
The ratio of working-age population to non-working―age population is rising in Asia seen 1975, but this increase has been especially dramatic in East Asia [13] . According to the UN projections, the ratio of working-age population to non-working-age population will peak East Asia in 2010 (ending the second phase of demographic transition), followed by decline (the third phase of demographic transition) [3] . This reflects the increase in the elderly dependency rate in East Asia as the knot in the age distribution works to change the direction of population dynamics.
During the period 1950-2004, mortality decline sharply in most countries of Asia and preceded the fertility decline, by several decades in many cases. The CDR dropped by two-thirds from around 24 per 1000 during the early 1959s to eight per 1000 in 2004 [13] . Life expectancy at birth in the region, which in the 1950s averaged a mere 41 years, had by 2004 risen by 25 years, with a regional breakdown of 28 years in East Asia, 24 in the South-east and 23 years in the South Asia. in 1950, no country in Asia had a life expectancy of more than 75 years and only few became equal or exceeded 60 years [11] . Now only Afghanistan, Cambodia and East Timor have a life expectancy of less than 60 at birth [13] .
Notwithstanding these dramatic improvements, the gap between high and low mortality countries continues to be wide, and wider still in under-five mortality. The under-five morality rate per 1000 live births ranges from 89 in South Asia, 53 in South-east Asia to 39 in East Asia, and 10 per 1000 (or less) in Hong Kong, Japan and Singapore [6] . The mortality pattern for South Asia is distinctive with very high death rates among children (up to age 15) and the elderly, indicating high incidences of infectious and parasitic diseases, which can be easily avoided by means of basic medical care [3] .
The gender differences in mortality and life expectancy in the South Asia region stand out as being contrary to the usual pattern. The mortality rate for girls (aged 0 - 5) is higher than the corresponding rates for boys, which reflects the widespread preferential treatment of boys [18] . Life expectancy for females is not higher than that for males, as it normally is, but either the same, as in Bangladesh, or shorter, as in India [11] . However, Sri Lanka and Iran, also in South Asia, conform to the usual norm of longer life expectancy of females than of males, as do South- east and East Asia [13] .
With a delay following the downward trend in mortality, the total fertility rate in Asia has dropped sharply from six children in the 1950s to 2.4 births per woman in 2000 [6] . Almost all countries have experienced a decline, but the extent of the decline, its time pattern, and the current rates vary greatly across countries and inter-regional differences within some countries.
In terms of the TFRs, South-east Asia is the most heterogeneous region with member countries in all three columns. In contrast, East Asia is the most homogeneous; bar Mongolia, every country in the region has a below-replacement TFR and the region as whole is in the final stage of transition. Similarly, apart from Sri Lanka, every country in South Asia has a higher than replacement level TFR [13] . This contrast ties in with the population growth rate in South Asia being almost three times that in East Asia, 1.7% compared with 0.6% [18] .
The demographic transition that Asian countries would face in the near future will vary with the stages of the transition. In the countries in the initial phase of the transition with a high TFR and population growth rate, such as Afghanistan, Cambodia, Laos, Nepal and Pakistan, the challenge would be to educate the swelling numbers of children in the age group 6 - 14, and to provide employment to the entrants to the labour force [13] . The current and past TFRs have a far-reaching impact on the age structure of the population, usually summarised by the percentage of children (under age 15) and of the elderly (aged 65 or above) in the population [6] .
Population migration, mostly rural-to-urban and associated urbanisation, which does both widen economic opportunities open to the labour force; and create problems such as the increased pressure on the exploitation of natural resources [6] . In Asia, as elsewhere, urbanisation has taken two forms: first, the expansion of existing urban settlements combined with rural-to-urban migration and, second, and the urbanisation of rural localities without migration [3] .
7. Where Is Nepal in the Demographic Transition?
Before 1970, the death rates in Nepal were fluctuating around 30 to 50 deaths per thousand populations. The birth rate per thousand populations was more than 44, which was really high. Both fertility and mortality appear to start declining from 1970. During 1995-2010, birth rates declined from 38 to 24 per thousand populations. The population of Nepal is still growing faster. In terms of demographic transition, it is still relatively young because approximately 60% of population is of below 15 years, while the national average life expectancy at birth is approximately 68 years, and elderly dependency ratio is very low [19] . It may be concluded from above evidences that Nepal is across the new pattern of transition after 1990 in the demographic transition described by Popkin (Table 5).
Table 5. Patterns of demographic transition Nepal (highlighted block in the Popkin’s Framework).
Nepal’s position in the demographic transition has been identified by using Popkin’s framework which is scaled from Pattern I to Pattern V (Table 5). The time series trends indicated that new patterns of demographic transition have been observed during 1990-2010, which is similar to the transition between Pattern III and IV of the nutrition transition as described by Popkin [2] . Popkin suggests a country with faster declining mortality, slow fertility declining in rural areas, increasing population, increasing life expectancy above 60 years, decreasing age-structure of below 15 years of population but still dependency ratio, increasing trends of urban population and beginning of international migration, is considered as the country in transition from Pattern III to IV in the demographic transition. It may be concluded from above evidence that Nepal is across the new pattern of transition after 1990s in the demographic transition including the increasing risk of chronic diseases of elderly people possibly related to increasing life expectancy and excess consumption of fat, sugar and process foods.
Cite this paper
Yagya Prasad Subedi,Padam Simkhada,Edwin van Teijlingen, (2016) Where Is Nepal in the Demographic Transition within the Wider Context of the Nutrition Transition?. Open Journal of Social Sciences,04,155-166. doi: 10.4236/jss.2016.45019
References
- 1. Warren, S.T. (1935) Movements of Population. American Journal of Sociology, 40, 713-719. http://dx.doi.org/10.1086/216974
- 2. Popkin, B.M. (1993) Nutrition Patterns and Transitions. Population and Development Review, 19, 138-157. http://dx.doi.org/10.2307/2938388
- 3. Bloom, D., Canning, D. and Sevilla, J. (2010) The Effect of Health on Economic Growth: Theory and Evidence. NBER Working Paper: 8587, Cambridge, MA.
- 4. Judith, B. (1984) An Analysis of Recent Data on the Population of China. Population and Development Review, 10, 241-271. http://dx.doi.org/10.2307/1973082
- 5. Kuroda, T. (1978) The Demographic Transition in Japan. Social Science & Medicine. Part A: Medical Psychology & Medical Sociology, 12, 451-457. http://dx.doi.org/10.1016/0271-7123(78)90112-8
- 6. Mari-Bhat, P.N. (2002) India’s Changing Dates with Replacement Fertility: A Review of Recent Fertility Trends and Future Prospects. In: Expert Group Meeting on Completing the Fertility Transition, United Nations, New York: ESA/P/WP, 376-391.
www.un.org/esa/population/publications/completingfertility/RevisedBHATpaper.PDF - 7. Santow, G. (2001) Mortality, Epidemiological, and Health Transitions. In: Smelser, N.J. and Baltes, P.B., Eds., International Encyclopedia of the Social & Behavioral Sciences, Pergamon, Oxford, 10071-10075. http://dx.doi.org/10.1016/B0-08-043076-7/02119-7
- 8. Macunovich, D. (2000) Macunovich Response to Abernethy. Population and Environment, 21, 343-346. http://dx.doi.org/10.1007/BF02436136
- 9. Mateos-Planas, X. (2002) The Demographic Transition in Europe: A Neoclassical Dynastic Approach. Review of Economic Dynamics, 5, 646-680. http://dx.doi.org/10.1006/redy.2001.0156
- 10. Kurek, S. (2011) Population Changes in Poland: A Second Demographic Transition View. Procedia-Social and Behavioral Sciences, 19, 389-396. http://dx.doi.org/10.1016/j.sbspro.2011.05.146
- 11. Gubhaju, B.B. and Moriki-Durand, Y. (2002) Below-Replacement Fertility in East and South-East Asia: Consequences and Policy Responses. Workshop on Fertility Decline, Below Replacement Fertility and the Family in Asia: Prospects, Consequences and Policies, National University of Singapore, Singapore, 10-12 April, 3-9.
- 12. Bjorvatn, K. and Farzanegan, M.R. (2013) Demographic Transition in Resource Rich Countries: A Blessing or a Curse? World Development, 45, 337-351. http://dx.doi.org/10.1016/j.worlddev.2013.01.026
- 13. United Nations (UN) (2005) A Review of Recent Fertility Trends and Future Prospects. UN, New York.
- 14. Harald, F. (1969) Feedbacks in Economic and Demographic Transition. Science, 166, 837-847. http://dx.doi.org/10.1126/science.166.3907.837
- 15. Coale, A. and Hoover, E. (1958) The Effects of Economic and Population Growth on National Savings and Inequality. Demography, 34, 97-114.
- 16. Dyson, T., Cassen, R. and Visaria, L. (2004) Twenty-First Century India—Population, Economy, Human Development, and the Environment. Oxford University Press, Oxford.
- 17. Seetharam, K.S. (2002) Half a Century of Unparalleled Demographic Change: The Asia-Pacific Experience. Asia-Pacific Population Journal, 17, 13-30.
- 18. Momota, A. and Futagami, K. (2000) Demographic Transition Pattern in a Small Country. Economics Letters, 67, 231- 237. http://dx.doi.org/10.1016/S0165-1765(99)00257-8
- 19. Central Bureau of Statistics (CBS) (2012) Nepal Population and Housing Census 2011. CBS/N, Kathmandu.
NOTES

*Corresponding author.