Open Journal of Social Sciences
Vol.03 No.07(2015), Article ID:58273,7 pages
10.4236/jss.2015.37040
A Comparative Study of Competitive Brand Based on Customer-Perceived Value―Evidences from IAT
Yaozhong Liu, Qifeng Sun
School of Management, Jinan University, Guangzhou, China
Email: 542133977@qq.com
Copyright © 2015 by authors and Scientific Research Publishing Inc.
This work is licensed under the Creative Commons Attribution International License (CC BY).
http://creativecommons.org/licenses/by/4.0/


Received 25 June 2015; accepted 21 July 2015; published 24 July 2015
ABSTRACT
The difference of the product differentiation fuels the competition of brands, steering the direction from the simple product competition to the added value of the brand. In the brands competition, customer-perceived value is the core of the competing. High customer-perceived value means the appropriate brand image left in the customers’ mind, thereby affecting the consumer loyalty and frequency of purchase again, showing the status of the brand. Using the method of IAT (implicit association test), the text analyzes the difference of the user experience of two competitive brands, and has an insight into the advantages and disadvantages of the competitive brand from four dimensions. The result shows that, overall speaking, the customer-perceived value of McDonald is higher than that of KFC, but in the dimension of service and value, the customer-perceived value of KFC is much higher, giving the direction for the marketers to make the appropriate tactics based on the difference of the brand customer-perceived value.
Keywords:
Brand, Customer Perceived Value, Implicit Association Test

1. Introduction
At present, with the increasing difficulty in the product differentiation, more and more companies begin to realize the value of brand. As advertising scientist Larry Light says, the future war of marketing is the brand battle, which will be the dominant competitive mode. In 1955, Burleigh B. Gardner and Stdney J. Levy noted that a brand had not only the function value, but also the emotion value in Product and Brand published on Harvard Business Review. Stephen King also stressed the difference between product and brand in the book, Explore a New Brand, noting that, “It is the brand that makes the company success, not just products”, and emphasized that “The difference is the added value of brand beyond the product function”. Brand is invisible, not a separate physical entity, and the core is the added value, obtained from the consumer subjective feeling which is a psychological evaluation [1] . Brand product presents not only the physical properties, but also some humanity properties, social effects [2] , and self-labeling effects, via the brand culture to express its value. In industry, the crucial issue of brand marketing makes different customer experiences, forming the core competence advantage and also it is a hot topic of academic research.
On average, brand has accounted for 56% of the full value of the company; in fast moving consumer industry, the number can reach as high as 62%. Therefore, from the perspective of customer-perceived value, this paper tries to analyze the different customer experiences in different brands, explore the difference between competitive brands, enrich the relevant research of brand and provide a theoretical basis of brand marketing for scholars and practitioners.
2. Literature Review
2.1. Brand and Brand Competence
According to the different understanding of brand, the concept differs. Some definitions and understandings are as follows:
American marketing association defines brand as: the brand is a name, mark, symbol, proper noun or design, or just a mix, to recognize special product produced by particular retailer and make it apart from the competitors [3] .
A more brief definition made by famous American scholar John Philips Jones: Brand is the special product that could provide worthwhile function benefits and value-added products [3] .
Most of the definition states that: brand has not only the physical entity, is invisible, the core is the added-value, which comes from the subjective experience. Brand comes to be an expression, customer use the brand culture, culture connotation to express views and appeals, to establish their own unique image.
As early as 20 years ago, futurist Alwin Toftler (1996) summarized the economic development stage of human history on “Future Shock” and divided it into three sections: product economy, service economy and experience economy. With such, brand competition can also be divided into three levels: product competition, service competition, experience competition, and the last will be the new levels of the brand competition. To apply the different strategies, enterprises would provide brand experience that is different from competitors and satisfy the customers’ heterogeneous demands, thus obtaining the competition advantage. And this advantage is hard to imitate, because it is invisible and permeating in all aspects of business products and services, which will not only be a tough challenge for competitors, but also effectively block new entrants threats and enhance the brand market bargaining power to get higher returns. Customers are willing to pay higher prices for different experience causing different brand experience can reduce customer sensitivity to price.
2.2. Customer Perceived Value
Along with profound changes in consumer demands and brand connotation, the competition among the brand have beyond the function of product or service, brand experience will be the core influential factor that influence the customers’ choice, recognition and identification, the one who can bring unusual and unique experience of the brand will come out on top in the brand war.
Zeithaml (1988) deems customer perceived value (CPV) as the evaluation of the effectiveness of the product, which is based on the customers’ comparison about the payment and the acquisition [4] .
Monroe and Krishnan (1985) propose the formation of the perceived value, stress the relationship between perceived value and consuming intention. They think that the positive perceived value could promote the consuming intention [5] . Moreover, Slater and Narver (2000) think that when providing more value than the competitors, enterprise could obtain more customer perceived values, which can be deem as competitive advantage to develop market ability that is relative with sales growth measured by CPV [6] . Ulaga and Chacour (2001) also demonstrate that the analyses of CPV is not only a market research tool, but also a powerful competing and measuring one [7] . Duman and Mattila (2005) consider that CPV has a direct influence on consumer loyalty and behavior intention [8] . Jorge Vera, Andrea Trujillo (2013) have the same result in Mexican bank research [9] . Sangmook Lee, Naehyun Jin, Hyuckgi Lee (2014) demonstrate that CPV has a positive regulation on whatever emotion or behavior loyalty in tourist research [10] . All in all, what is the brand core source of competitive advantage and the core of the customer’s key selling point as well as ongoing long-term purchasing behavior is the continued customer satisfaction, which comes from customer perceived value. So, from the point of CPV, this paper will analyses the difference between competitors to explore different experiences, then seek different brand marketing strategies to meet customer expectations of the brand, to provide maximum customer perceived value, customer satisfaction, and finally to get the brand a competitive advantage.
Baolong Ma, Lin Zhang, Gao Wang and Fei Li deem consumer perceived value as the four-dimensional structure, that is functional performance, perceived cost, emotional and social value [11] . Function is the quality and property of the product and service, cost is the efficiency of the long-term and short-term depletion; emotion value is the inner experience in the processes of using; social value is the ability that the product could enhance the consumers’ self social concept. According to the characters of the fast food industry we selected, we adjust the structure of the four dimensions, that is: “QSCV” (Quality, Service, Cleanness, Value), which means providing class quality products, thoughtful service, clean environment and comfortable and affordable experience the standard idea and struggling goal and coincided with the four-dimension of CPV, so we just define the structure as Q (quality), S (service), C (cleanness), V (value), and explore the differences of CPV of two competitive brands.
2.3. Implicit Association Test
Most researches of consumer attitude and cognition have been employed questionnaire, using the explicit report data. On the one hand, these data all comes from the awareness content and cannot reflect the subjects’ inner attitude and other influence factors [12] ; on the other hand, a numerous of researchers have demonstrated that explicit test cannot have a whole cognition about the consumer behavior, and a large number of choice cannot be explained by the consumers’ explicit attitude [13] . Fitzsimons et al. (2002) also states that implicit awareness has impact on consumers’ perception and memory [14] . Dijksterhuis et al. (2005) further study the unconscious function, demonstrating that most of those are spontaneously pursuing goals [13] . In fact, many decisions in life are inducing by the background and clues, or automatic initiated by unconscious attitudes, without explicit process.
Implicit Association Test (IAT) is proposed by Greenwald in 1998. IAT is indexed by reaction time, through a kind of classification task to test the links of two concepts and then analyses the implicit social cognition. IAT include “Compatible Task” and “Incompatible Task”, which is classified by the implicit cognition structure, the former one means the relationship of the target concept and attribute concept is coincide, the another means not. The more tighter the two concepts links, the less the reaction time, and incompatible task could raise more cognition conflict and reaction time. The reaction time difference will be the IAT index, reflecting the relative attitude about the two concepts.
Given the advantages of IAT method itself, more and more research employ it in different applied areas. IAT widely applied in candidates running [15] , racial stereotyping research [16] , different advertising slogans in different concepts causing different consumer psychology [17] , and the match between brand management and the stereotype of consumers of the product [18] , all these demonstrating the widely use of IAT and the reliability and validity [19] . So, this paper employed IAT as the research method, explore the difference of CPV of competitive brands from the view of CPV.
3. Method
3.1. Participants
Thirty Subjects comes from Jinan University (15 males and 15 females) for lab experiment. The participants were aged 20 to 25 years old, they all have normal vision, good memory and never been IAT experiment.
3.2. Experiment Materials
Experiment is IAT, including target concept and attribute concept.
Collect target concept: we collect McDonald and KFC product graphs via the internet, and let 40 subjects rate the representation of these products of their own brand, and select 12 pieces of the most representative. All graphs are standard processed by Photoshop.
Collect attribute concept: all the verbs are collected from four dimensions: Q (quality), S (service), C (cleanness) via KFC and McDonald website about the verbs describing the enterprise culture. And also select 5 - 10 verbs describing the products providing by 40 students. Combing the result of frequency analysis and the fast food industry ideas, we select the top “12” positive verbs and top “12” negative verbs, more details as Table 1.
3.3. Experiment Procedure
The experiment is programming by Eprime 2.0, and accomplished on the computer. All of the responses, like reaction time, will be automatically recorded by the program.
The procedure has seven steps, just as Table 2. All the subjects will be randomly divided into two groups, one group will receive the McDonald and positive verbs first combined procedure, another group will receive KFC and positive verbs first combined one, that is the third and fourth are replaced by the sixth and seventh. IAT experiment is accomplished alone.
3.4. Data Processing
The data processing method follows the steps proposed by Greenwald (1998). First of all, just select and analyses the test stages; then, sign the time longer than 3000 ms as 3000 ms, and shorter than 300 ms as 300 ms, this just because the too long reaction time showed subjects disturbed and too short showed subjects having prepare for the experiment; then, averaging the times of two test stages; finally, to ensure the stability of the variance, the data of the reaction will be logarithmic conversion, as the IAT analysis of the raw data. We will deem McDonald and positive, KFC positive sharing the same key as combined task stage one, the another test stage as combined task stage two. The average time difference between stage one and two will be the IAT effect, which reflect that from the view of CPV, the difference of the two brand experience, and then analyses the brand discrepancy. Moreover, this paper will calculate the difference respectively from the four dimensions to explore the difference brand experience in different dimension.
4. Data Processing Result
4.1. Overall IAT Effect Analysis
The statistical analyses were performed with SPSS for Windows (version 21.0). We conducted repeated- measures analyses of variance (ANOVAs) with sequence of the two stages runs (McDonald and positive verbs first

Table 1. Stimuli samples.
Table 2. Experiment design.
vs. KFC and positive verbs first) as between-subject factor. This revealed significant main effects for stages,  , p < 0.001. In IAT experiment, the reaction time of the combined task one (M = 6.9506, SD = 0.35) is statistically shorter than the combined task two (M = 7.36, SD = 0.34), which means that combined task one is compatible task, combined task two is the incompatible. In another word, compared with the combination of McDonald and negative verbs, KFC and positive verbs, the combination of McDonald and positive verbs, KFC and negative verbs is more closer, reflecting in the whole CPV, consumer has a more higher impression on McDonald than KFC. Table 3 depicts the participant’s RTs.
4.2. IAT Effect Analyses in Different Dimensions
We have measured the CPV from four dimensions, that is Q (quality), S (service), C (cleanness), V (value). We arranged the reaction time according the different stage, and then paired samples T-test was conducted on the data, result as follows.
4.2.1. Quality
In this dimension, combined task one and combined task two has be paired to conduct the t-test, just as the Table 4 shows, the discrepancy is statistically different (t = −10.119, p < 0.001), reflecting that in this dimension, the CPV of the two brand has discrepancy, and compared with the combination of KFC and positive verbs, the combination of McDonald and positive verbs is more closer. In another word, in quality dimension, consumer perceived-value about McDonald is higher, which means that consumer consider McDonald’s product more high-grade.
4.2.2. Service
In this dimension, combined task one and combined task two has be paired to conduct the t-test, just as the Table 5 shows, the discrepancy is statistically different (t = 8.564, p < 0.001), reflecting that in this dimension, the CPV of the two brand has discrepancy, and compared with the combination of McDonald and positive verbs, the combination of KFC and positive verbs is more closer. In another word, in service dimension, consumer perceived-value about KFC is higher, which means that consumer consider KFC’s service high-grade.
4.2.3. Cleanness
In this dimension, combined task one and combined task two has be paired to conduct the t-test, just as the Table 6 shows, the discrepancy is statistically different (t = −8.63, p < 0.001), reflecting that in this dimension, the CPV of the two brand has discrepancy, and compared with the combination of KFC and positive verbs, the
Table 3. IAT effect of competitive brands.
Table 4. IAT effect of quality dimension.
Table 5. IAT effect of service dimension.
Table 6. IAT effect of cleanness dimension.
combination of McDonald and positive verbs is more closer. In another word, in cleanness dimension, consumer perceived-value about McDonald is higher, which means that consumer consider McDonald’s products and environment more sanitation.
4.2.4. Value
In this dimension, combined task one and combined task two has be paired to conduct the t-test, just as the Table 7 shows, the discrepancy is statistically different (t = 5.524, p < 0.001), reflecting that in this dimension, the CPV of the two brand has discrepancy, and compared with the combination of McDonald and positive verbs, the combination of KFC and positive verbs is more closer. In another word, in cleanness dimension, consumer perceived-value about KFC is higher, which means that consumer consider that KFC could provide more the products and service, satisfying the emotion and social added value needs of the consumers.
5. Discussion
The consumer behavior is not always influenced by their conscious level mind, some subjects actually have a brand preference even though they state that they don’t have in self-reporting, which means that explicit measure like self-reporting cannot wholly reflect the real consumer attitude.
Implicit Association Test (IAT) examine the degree of the connection two concepts linked on neural network, quantify the connection strength, and then analyses the real reality attitudes of the two concepts.
Employing the IAT, the experiment measured consumer perceived-value about a pair of competitive brands, finding that the whole average reaction time of McDonald is shorter than KFC’s, which means that the association between McDonald and positive verbs is closer than KFC and positive. Put it in another way, from the whole perspective, consumer perceived-value about McDonald is higher than KFC.
Meanwhile, we compare consumer perceived-value about McDonald’s and KFC respectively from the four dimensions. See as in Graph 1 finding that in dimension of Quality and Cleanness, the CPV of McDonald is higher than KFC; but in dimension of Service and Value, the CPV of KFC is higher than McDonald. In other words, consumer think that McDonald have more high grade products and cleaner environment; KFC’s service provide consumer more fantastic consuming experience.
Therefore, in the study of consumer attitude, we should not only analyze the brand preference from the whole perspective, but also the different dimensions, so as to find the brand’s relative real strengths and weaknesses, learn from each other and maximum the benefit.
6. Conclusion
This paper is the first research using the IAT to study consumer-perceived value, and using the CPV to investigate the difference of the competitive brands. Most of previous works focus on the difference between explicit and implicit attitude about consumer brand preference, but this paper tries to evaluate the brand from four dimensions of the CPV; from this perspective, marketers could have a generally understanding of brand difference and a deeper exploration about the subtle psychological difference, and then grasp the needs unsatisfied, thus executing a differentiation strategy to provide consumers with different brand experiences to earn brand loyalty.
Deficiency and Prospect
First of all, this paper explored the CPV difference from the implicit view, without measuring the explicit CPV to be compared; we will accomplish it in the future study.
Secondly, many previous researchers have demonstrated the validity of IAT in implicit social cognition area. But, the choice of IAT is out of the reality consumer scene, and recorded by the computer, accurate to the millisecond response time, which is susceptible to situational factors. Moreover, the data processing process also has
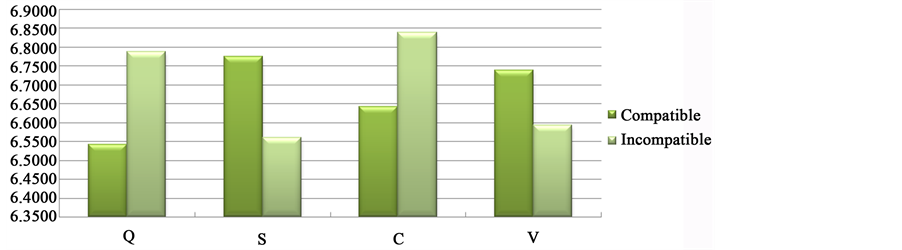
Graph 1. Means comparison of four dimensions.
Table 7. IAT effect of value dimension.
its shortcomings that will be improved in future.
Thirdly, the sample selected is college students; its limitation narrows the applicability of the results of the experimental study.
Finally, we explore the discrepancy of CPV of the competitive brand in four dimensions, but do not discuss the reason that makes such difference, which will be accomplished in the future study.
Cite this paper
YaozhongLiu,QifengSun, (2015) A Comparative Study of Competitive Brand Based on Customer-Perceived Value—Evidences from IAT. Open Journal of Social Sciences,03,275-282. doi: 10.4236/jss.2015.37040
References
- 1. Wang, G. (2004) Customers’ Value and Enterprises’ Competitive Advantage-Taking Mobile Industry as an Example. Management World, 10, 97-109.
- 2. Zhu, J.Q. (1997) Discussions on the Humanistic Significance and Social Effects of the Brand. Journal of Xiamen University, 2, 30.
- 3. Yang, Z.L. and Peterson, R.T. (2004) Customer Perceived Value, Satisfaction, and Loyalty: The Role of Switching Costs. Psychology & Marketing, 21, 799-822. http://dx.doi.org/10.1002/mar.20030
- 4. Zeithaml, V.A. (1988) Consumer Perceptions of Price, Quality, and Value: A Means-End Model and Synthesis of Evidence. Journal of Marketing, 52, 2-22. http://dx.doi.org/10.2307/1251446
- 5. Dodds, W.B., Monroe, K.B. and Grewal, D. (1991) Effects of Price, Brand, and Store Information on Buyers’ Product Evaluations. Journal of Marketing Research, 38, 307-326. http://dx.doi.org/10.2307/3172866
- 6. Slater, N. (2000) The Positive Effect of a Market Orientation on Business Profitability: A Balanced Replication. Journal of Business Research, 48, 69-73. http://dx.doi.org/10.1016/S0148-2963(98)00077-0
- 7. Ulaga, W. and Chacour, S. (2001) Measuring Customer Perceived Value in Business Markets: A Prerequisite for Marketing Strategy Development and Implementation. Industrial Marketing Management, 30, 525-540. http://dx.doi.org/10.1016/S0019-8501(99)00122-4
- 8. Duman, T. and Mattila, A.S. (2005) The Role of Affective Factors on Perceived Cruise Vacation Value. Tourism Management, 26, 311-323. http://dx.doi.org/10.1016/j.tourman.2003.11.014
- 9. Vera, J. and Trujillo, A. (2013) Service Quality Dimension and Superior Customer Perceived Value in Retail Bank: An Empirical Study on Mexican Consumers. Journal of Retailing and Consumer Services, 20, 579-586. http://dx.doi.org/10.1016/j.jretconser.2013.06.005
- 10. Lee, S., Jin, N. and Lee, H. (2014) The Moderating Role of Water Park Service Quality, Environment, Image, and Food Quality on Perceived Value and Customer Loyalty: A South Korean Case Study. Journal of Quality Assurance in Hospitality & Tourism, 15, 19-43.
http://dx.doi.org/10.1080/1528008X.2014.855102 - 11. Lee, S., Jin, N. and Lee, H. (2014) The Moderating Role of Water Park Service Quality, Environment, Image, and Food Quality on Perceived Value and Customer Loyalty: A South Korean Case Study. Journal of Quality Assurance in Hospitality & Tourism, 15, 19-43.
http://dx.doi.org/10.1080/1528008X.2014.855102 - 12. Ma, B.L., Zhang, L., Wang, G. and Li, F. (2010) The Effects of Product-Harm Crisis on Brand Performance. International Journal of Market Research, 52, 443-458. http://dx.doi.org/10.2501/s1470785309201399
- 13. Vantomme, D., Geuens, M. and Dewitte, S. (2005) How to Portray Men and Women in Advertisements? Explicit and Implicit Evaluations of Ads Depicting Different Gender Roles. Social Science Research Network.
- 14. Dijksterhuis, A., Bos, M.W., Nordgren, L.F. and Van Baaren, R.B. (2006) On Making the Right Choice: The Deliberation-without-Attention Effect. Science, 311, 1005-1007.
- 15. Maison, D., Greenwald, A.G. and Bruin, R. (2001) The Implicit Association Test as a Measure of Implicit Consumer Attitudes. Polish Psychological Bulletin, 32, 1-9.
- 16. Greenwald, A.G., Poehlman, T.A., Uhlmann, E.L. and Banaji, M.R. (2009) Understanding and Using the Implicit Association Test: III. Meta-Analysis of Predictive Validity. Journal of Personality and Social Psychology, 97, 17-41. http://dx.doi.org/10.1037/a0015575
- 17. Brunel, F.F., Tietje, B.C. and Greenwald, A.G. (2004) Is the Implicit Association Test a Valid and Valuable Measure of Implicit Consumer Social Cognition? Journal of Consumer Psychology, 14, 385-404.
- 18. Dimofte, C.V. and Yalch, R.F. (2007) Consumer Response to Polysemous Brand Slogans. Journal of Consumer Research, 33, 515-522. http://dx.doi.org/10.1086/510225
- 19. Dimofte, C.V. (2010) Implicit Measures of Consumer Cognition: A Review. Psychology and Marketing, 27, 921-937.