Open Journal of Forestry
Vol.4 No.3(2014), Article ID:44948,8 pages DOI:10.4236/ojf.2014.43030
Characteristics and Growing Stocks Volume of Forest Stand in Dry Temperate Forest of Chilas Gilgit-Baltistan
Abdul Raqeeb1, Syed Moazzam Nizami1, Amir Saleem1, Muhammad Hanif2
1Department of Forestry and Range Management, Arid Agriculture University, Rawalpindi, Pakistan
2Department of Mathematics & Statistics, Arid Agriculture University, Rawalpindi, Pakistan
Email: moazzam.nizami@uaar.edu.pk
Copyright © 2014 by authors and Scientific Research Publishing Inc.
This work is licensed under the Creative Commons Attribution International License (CC BY).
http://creativecommons.org/licenses/by/4.0/


Received 21 February 2014; revised 23 March 2014; accepted 3 April 2014
ABSTRACT
Chilas forest sub division in Diamer district, of Gilgit-Baltistan is located at northern regions of Pakistan. We estimated tree density, diameter, height and volume of the dominant tree species in four blocks (Thore, Chilas, Thak Niat and Gunar) of Chilas forest sub division. The tree density of deodar was maximum with average 26 tree∙ha−1 and minimum was of Chalgoza 4 trees∙ha−1. The maximum average height showed by the dominant species (Fir, Kail, Deodar, and Chilgoza) of the study area to be 20.40, 16.06, 12.24 and 12.12 m respectively. Moreover the average maximum volume attained by the Kail, Fir, Deodar and Chalgoza trees was 1.92, 1.57, 0.46 and 0.291 m3∙tree−1 respectively. Regression analysis was carried out to determine the relationship between diameter (cm), height (m), tree density (trees∙ha−1) and volume (m3∙ha−1). The findings of the study will help the future scientific management of the forest for sustained yield. The study also provides information about the unexplored growing stock and structure of the forests. Additionally, this study will help to understand the patterns of tree species composition and diversity in the northern part of Pakistan with dry temperate climate.
Keywords:Growing Stock, Dry Temperate, Chilas Forest

1. Introduction
The forest growing stock (GS), is a key parameter in the context of forest resource management and global change issues. The GS characteristics which are also referred to as species composition, forest structure, tree height, tree age, stem volume or bole volume of living trees, represent the volume of the tree stems for all living species per unit area, including bark but excluding branches and stumps. The growing stock volume is a major predictor for assessing the above-ground biomass (Häme et al., 1992) and is central for estimating compartment (Jenkins et al., 2003) or total above-ground biomass (Somogyi et al., 2008), which is a fundamental variable for estimating the net carbon dioxide exchange between the land surface and the atmosphere. Thus, growing stock volume is important for a more detailed evaluation of terrestrial biosphere models (Beer et al., 2006), but also for inversely estimating parameters of biosphere models (Carvalhais et al., 2010; Williams et al., 2005).
The GS is typically estimated from in situ measurements of the diameter at breast height (dbh) collected at sample plots. Inventory can be aided by aerial photography or very high resolution satellite images. Typically, the estimation accuracy is required to be in the order of 10% - 20% (confidence interval 0.95). While this requirement can be met in small areas, e.g. dedicated to the exploitation of timber resources, it is likely that growing stock volume measurements over extended areas are affected by larger uncertainties and errors, especially in remote regions where detailed and frequent surveys are difficult.
Roughly 90% of Pakistani forests are inventoried by provincial forest departments in a time span of 5 - 10 years. The high costs linked with local surveys, the scarceness of resources and the large extent of the areas to be mapped hinder accurate inventory of forest resources and frequent update. In the absence of other reliable sources of information, the growing stock volume derived from inventoried measurements end up being the reference dataset for resources assessments and carbon budget calculations well beyond the time for which they can be considered true. As a result, figures on total growing stock volume and trends of carbon accumulation can suffer in the long run from biases and large uncertainties. Kindermann et al. (2008) showed that downscaling national estimates of growing stock volume reported in the 2005 Forest Resources Assessment to 0.5˚C resulted in unrealistic growing stock volume estimates in several regions of the world due to errors or omissions in the input dataset. Particularly in Pakistan for the preparation of this report, the FAO (2006) consulted with experts through ten regional and sub-regional workshops to have Pakistan’s growing stock estimates. The data regarding Pakistan in FRA 2005 present the total carbon stocks (M∙t) for the entire country. However, no scientific work was executed on actual measurements regarding biomass and carbon stocks estimation in any forest type of Pakistan and the FRA (2005) estimates are based on remote sensing and may be error prone (Nizami, 2010).
The scope of this paper is to provide the ground based inventory results for the characteristics of unrevealed forests of Chilas, Gilgit Baltistan in northern dry temperate region. The primary objective of the study is to determine the growing stock and its characteristics in the mostly public owned natural forests in the chilas forest division. Some fragmentary studies have been conducted on the diversity and composition (Iqbal, 2001) of the dominant forest types of the Gilgit Baltistan as part of the management plan but studies to determine the relationship between tree density, tree height, stand volume and diameter of the tree is still lacking. This information is of utmost importance to determine the C stock density in different forest types of this region with link to Kyoto Protocol and UN-REDD (United Nations-Reducing emission from deforestation and degradation). The present study was undertaken in dry temperate forests of Gilgit Baltistan in the region of Chilas with the aim of assessing the forest structure and growing stock characteristics in terms of stem density (No. of trees∙ha−1), tree height (m), dbh (cm) and volume (m3∙tree−1). Moreover, regression models for height and volume with respect to diameter of the dominant species were also developed.
2. Methods and Materials
The Chilas Forest Division lies at elevation range of 1829 - 3506 m. The geographical location of the area is t 35˚23'07''N and 74˚34'07''E with a total of 0.1 m∙ha forest area. Mostly forests in the area are privately owned, however, they are managed by the forest department. From management point of view, forests have been divided into two subdivisions namely Chilas and Darel-Tangir. The present study was conducted in Chilas sub division. The vegetation of area falls in dry temperate coniferous forest containing the natural forests which mainly consisted of Cedrus deodara (Diar/Deodar), Pinus wallichiana (Kail), Abies pindrow (Fir), and Pinus gerardiana (Chilgoza) etc. Some forest areas are virgin/untouched dense vegetation and at some places forests have been subjected to overuse due to illegal cuttings and free grazing (Rao & Marwat, 2003).
The Chilas Forest Division is divided into 4 forest ranges namely; Chilas head quarter, Gunar Range, Thore Range and Thak Niat Babusar Range. The study area was divided into 4 blocks. From each block 4 plots was selected using stratification as dense, moderate, sparse and blank forest areas. For the assessment of growing stock the plot size was 100 × 100 m. From each plot following parameters were studied: identification of the species, Tree density (Total no of trees∙ha−1), diameter (cm), trees height (m), tree age (years) and tree volume (m3).
Height of the tree was determine by trigonometric principles using angle of elevation and depression measured through Abney’s level and distance between tree and observer was measured. Following formulae were used for calculating height at different positions:
1)  (When observer and tree were at same level);
2)  (when observer was at higher level than tree base);
3)  (when observer was below tree base);
(where OB is the inclined distance between observer and tree base; x is the angle of elevation and y is the angle of depression). The volume was determined by formula given by Nizami (2012).
3. Results and Discussion
3.1. Species Composition
Deodar (Cedrus deodara) trees were only confined to Thore, Chilas and Thak Niat, that represents southern aspects and were on lower elevations of Chilas forest sub-division. This might be due to the reason that deodar is a strong light demander species. Similarly Chalgoza (Pinus gerardiana) trees were also found in these blocks showing association with the deodar trees. The Pinus wallichiana (Kail) trees were present in all four blocks. The kail tree like cool places with partial overhead shade, this is the reason why these were confined to higher elevations than deodar and Chalgoza? Similarly fir trees were also found only in three locations. It was pointed out that species wise the forests of the study area were dominated by Deodar, Fir, Kail and Chalgoza tree species (Table 1).
Block wise species composition (%) revealed that in Thore decodar is greater than kail and kail is greater than Chalgosa trees. In Chilas block, Deodar tree is greater in percentage than kail and kail is greater than Fir and Chalgosa. Likewise in Thak Niat block, again deodar dominates over Kail and Kail dominates over Chalgosa and Fir trees, but the situation is different in Gunar block in which the forest area is 50% dominated by kail and 50% by Fir trees (Table 1). Shujaul et al. (2014) also reported that C.deodara and P. wallichiana are the dominant species of this region.
3.2. Tree Density
The tree density of deodar was maximum with average 26 tree∙ha−1 and minimum was of Chalgoza 4 trees∙ha−1 (Table 1). The relationship between tree density (No. of trees∙ha−1) and their diameter was analyzed by allometric equations (Figure 1) and linear quadratic relationship was found between tree density and diameter of the trees with value of co-efficient of determination (R2) equals to 0.99, 0.98, 0.99 & 0.99 for Kail, Deodar, Fir and

Table 1. Location wise Tree Density (No. of trees∙ha−1) and % species composition.
Note: Figures in brackets are the percentage.
Chilgosa species in the study area respectively (Figures 1-4). Diameters of deodar (Cedrus deodara) trees were measured at 1 (30.48 cm) interval aboveground level up to 7 feet (2.13 meters) and each set of diameters showed a strong linear correlation with diameter at breast height (Hussain, 1984; Fatime & Hussain, 1984). Chandra et al. (2010) had reported that conifer-dominated upper west himalayan A. pindrow forest and moist C. deodara forest had statistically higher total density than all the other forest types in the Himalayan region of India and Pakistan. They have reported the density of 507 and 447 trees∙ha−1 in both the forest types. Comparatively the present study reported far less.
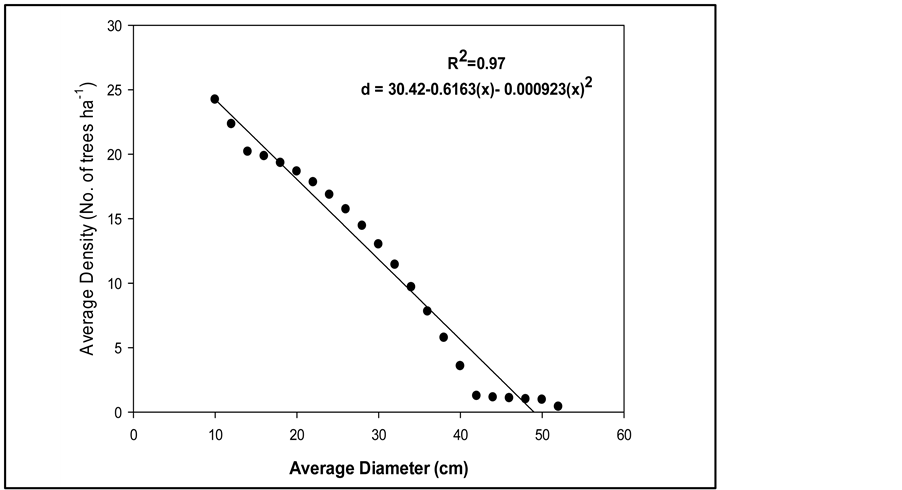
Figure 1. Relationship between tree density (No. of tree∙ha−1) and diameter (cm) of Pinus wallichiana (Kail).
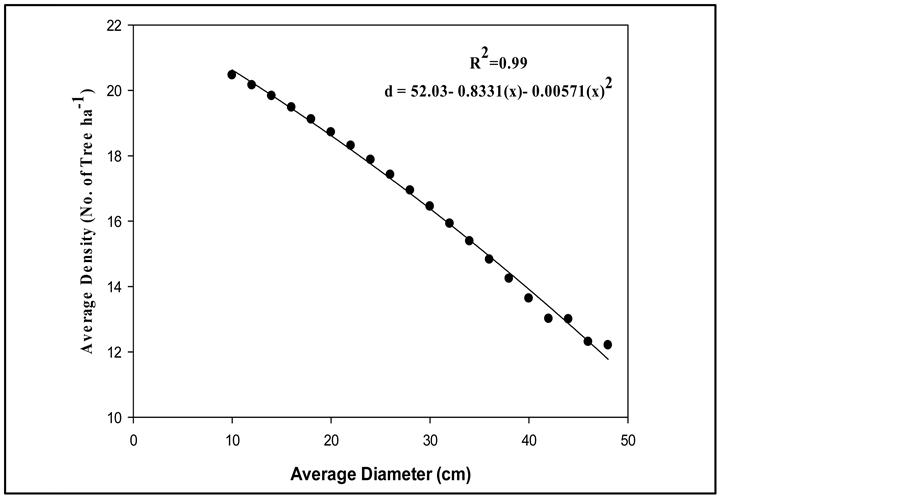
Figure 2. Relationship between tree density (No. of tree∙ha−1) and diameter (cm) of Cedrus deodara (Deodar).
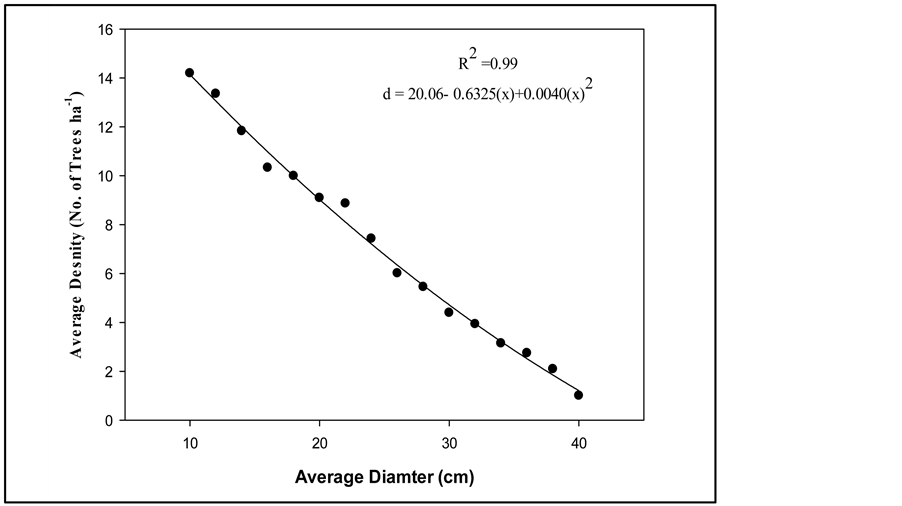
Figure 3. Relationship between tree density (No. of tree∙ha−1) and diameter (cm) of Abies pindrow (Fir).
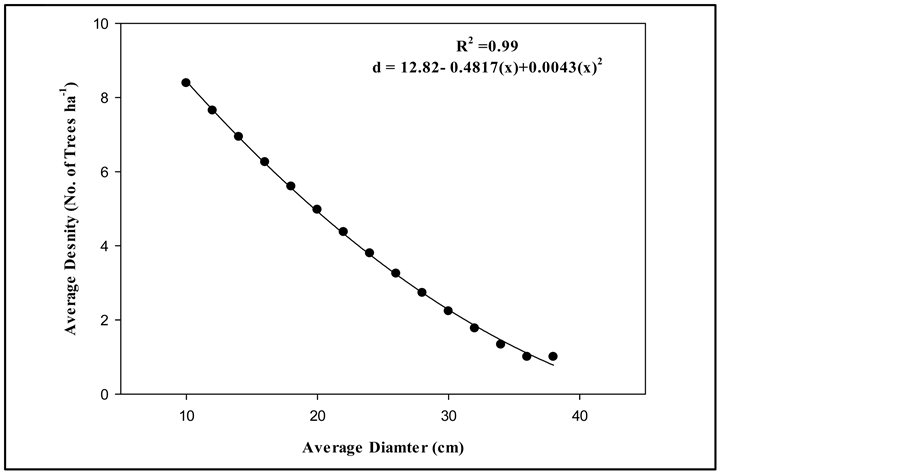
Figure 4. Relationship between tree density (No. of tree∙ha−1) and diameter (cm) of Pinus gerardiana (Chilgosa).
3.3. Tree Height
The study revealed that Fir, Kail, Deodar and Chalgoza trees showed maximum height of 20.40, 16.06, 12.24 and 12.12 m respectively and the average minimum height in all the species were 2.42, 2.58, 3.03 and 3.33 m respectively (Figure 5). When the regression analysis between diameter and height was carried out it was pointed out that all the species have linear relationship with diameter (cm) with different values of co-efficient of regression (R2) ( Table 2 ). Sheikh (1993) has reported that the average maximum height of the dominant species of these forests is 45 - 60 m for Abies pindrow and Cedrus deodara while 30 - 45 m for Pinus wallichiana Table 2. Regression models for avgeare height (m) of the dominant species with respect to diameter (cm) in the study area with Co-efficient of determination (R2) Value and type of relationship. Figure 5. Relationship between Avg. Height of dominant species with respect to diameter in the study area. in favourable conditions. Chilgosa (Pinus gerardiana) is growing under harsh conditions and slow growing tree so only attains a height of 12 - 18 m. 3.4. Tree Volume The study revealed that Kail, Fir, Deodar and Chalgoza trees showed maximum average volume (m3) of 1.92, 1.57, 0.46 and 0.291 Table 3 ). The total productivity of the timber was recorded by Sheikh (1993) as 4 - 6, 6 - 9 and 5 - 8 m3∙ha−1∙yr−1 in forest of similar ecology. 4. Conclusion After the seminal work presented in the working plan of district diamer (1 qbal, 2001), this study appears as the first attempt to evaluate the overall growing stock and characteristics of the forests in dry temperate northern territory of Chilas, Gilgit-Baltistan in Pakistan. The way we assess the diameter, height and volume growth characteristics of the dominant species in the dry temperate forests of the region is based on standard methods for estimation of the biomass for major implications of monitoring, reporting and verification (MRV) component of UN-REDD program. So the outcome of the studies is helpful for estimation of biomass and carbon stocks in future. Additionally, the characteristics of the forest type presented in the form of species composition are also an important determinant of biomass estimations. The information generated is up to date and can not only be Table 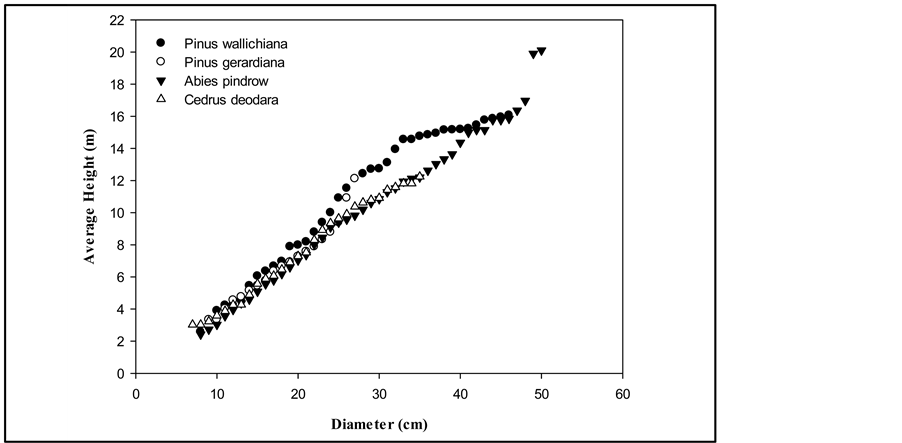
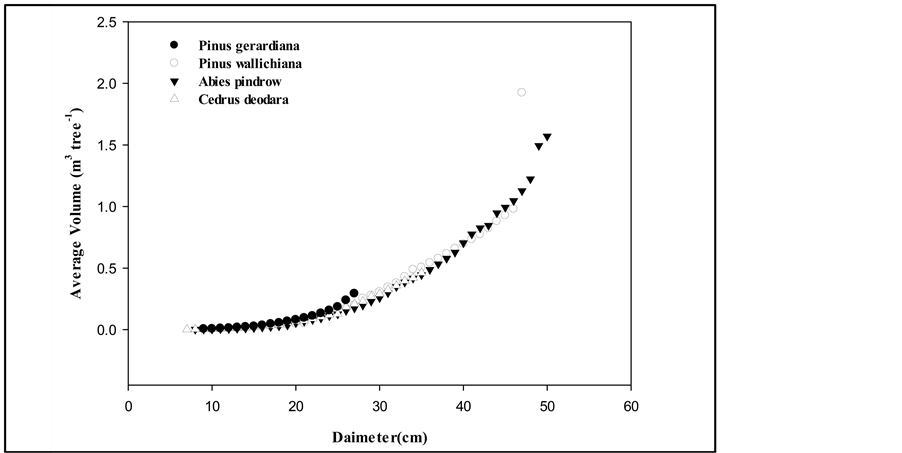
Figure 6. Relationship between Avg. Volume of dominant species with respect to diameter in the study area.
pooled in the future studies to be carried out in the context of the carbon budgeting, UN-REDD and climate change but also for sustainable forest management.
References
- Beer, C., Lucht, W., Schmullius, C., & Shvidenko, A. (2006). Small Net Carbon Dioxide Uptake by Russian Forests during 1981-1999. Geophysical Research Letters, 33, Article ID: L15403. http://dx.doi.org/10.1029/2006GL026919
- Carvalhais, N., Reichstein, M., Ciais, P., Collatz, G. J., Mahecha, M. D., & Montagnani, L. (2010). Identification of Vegetation and Soil Carbon Pools Out of Equilibrium in a Process Model via Eddy Covariance and Biometric Constraints. Global Change Biology, 16, 2813-2829. http://dx.doi.org/10.1111/j.1365-2486.2010.02173.x
- Chandra, M. S., Baduni, N. P., Gairola, S., Ghildiyal, S. K., & Suyal, S. (2010). Tree Diversity and Carbon Stocks of Some Major Forest Types of Garhwal Himalaya, India. Forest Ecology & Management, 260, 2170-2179. http://dx.doi.org/10.1016/j.foreco.2010.09.014
- FAO (2006). Global Forest Resource Assessment 2005. FAO Forestry Paper Series, Paper No: 147. Rome, Italy: FAO. http://www.fao.org/docrep/008/a0400e/a0400e00.htm
- Fatime, M. A., & Hussain, R. W. (1984). Estimation of Diameter at Breast Height from Stump Measurements for Deodar (Cedrus deodara) of Azad Kashmir. Pakistan Journal of Forestry, 34, 219-231.
- Häme, T., Salli, A., & Lahti, K. (1992). Estimation of Carbon Storage in Boreal Forests Using Remote Sensing Data. In M. Kanninen, & P. Anttila (Eds.), Pilot Study (pp. 250-255). The Finnish Research Program on Climate Change, Progress Report. Helsinki, Finland: Academy of Finland.
- Hussain, R. W. (1984). Estimation of Diameter at Breast Height from Stump Measurements for Deodar Cedrus Deodara of Azad Kashmir Pakistan. Pakistan Journal of Forestry, 31, 219-232.
- Iqbal, M. (2001). Working Plan of District Diamer. Forest Department Gilgit-Baltistan, 210 p.
- Jenkins, J. C., Chojnacky, D. C., Heath, L. S., & Birdsey, R. A. (2003). National-Scale Biomass Estimators for United States Tree Species. Forest Science, 49, 12-35.
- Kindermann, G. E., McCallum, I., Fritz, S., & Obersteiner, M. (2008). A Global Forest Growing Stock, Biomass and Carbon Map Based on FAO Statistics. Silva Fennica, 42, 387-396. http://dx.doi.org/10.14214/sf.244
- Nizami, S. M. (2010). Estimation of Carbon Stocks in Managed and Unmanaged Subtropical Forests of Pakistan. Ph.D. Thesis, Higher Education Commission of Pakistan, 165 p.
- Nizami, S. M. (2012). Assessment of the Carbon Stocks in Sub-Tropical Forests of Pakistan for Reporting under Kyoto Protocol. Journal of Forestry Research, 23, 377-384. http://dx.doi.org/10.1007/s11676-012-0273-1
- Rao, A. L, & Marwat, H. (2003). Nassd Background Paper: Forestry. IUCN Pakistan, NAS Program Gilgit.
- Sheikh, M. I. (1993). Trees of Pakistan. Peshawar: Pakistan Forest Institute, 142 p.
- Shujaul M. K., Page, S., Ahmad, H., & Harper, D. (2014). Ethno-Ecological Importance of Plant Biodiversity in Mountain Ecosystems with Special Emphasis on Indicator Species of a Himalayan Valley in the Northern Pakistan. Ecological Indicators, 37, in press.
- Somogyi, Z., Teobaldelli, M., Federici, S., Matteucci, G., Pagliar, V., & Grassi, G. (2008). Allometric Biomass and Carbon Factors Database. iForest, 1, 107-113.
- Williams, M., Schwarz, P. A., Law, B. E., Irvine, J., & Kurpius, M. R. (2005). An Improved Analysis of Forest Carbon Dynamics Using Data Assimilation. Global Change Biology, 11, 89-105. http://dx.doi.org/10.1111/j.1365-2486.2004.00891.x