Advances in Materials Physics and Chemistry
Vol.3 No.2(2013), Article ID:32660,8 pages DOI:10.4236/ampc.2013.32021
Effects of Gamma Irradiation on the Kinetics of the Adsorption and Desorption of Hydrogen in Carbon Microfibres
1Centro Nacional de Investigaciones Metalúrgicas (CSIC), Madrid, Spain
2Materials Science Institute, University of Valencia, Valencia, Spain
Email: cesarmotacarracedo@gmail.com, mario.culebras@uv.es, andres.cantarero@uv.es, inmac09@gmail.com, clara.gomez@uv.es, amoortega@cenim.csic.es, jrobla@cenim.csic.es
Copyright © 2013 Cesar Mota et al. This is an open access article distributed under the Creative Commons Attribution License, which permits unrestricted use, distribution, and reproduction in any medium, provided the original work is properly cited.
Received April 3, 2013; revised May 6, 2013; accepted May 22, 2013
Keywords: Carbon Fiber; Gamma Irradiation; Hydrogen Adsorption; Electrical Resistivity; Raman Spectroscopy
ABSTRACT
In this study, three types of carbon fibres were used, they were ex-polyacrylonitrile carbon fibres with high bulk modulus, ex-polyacrylonitrile fibres with high strength, and vapour grown carbon fibres. All the samples were subjected to a hydrogen adsorption process at room temperature in an over-pressured atmosphere of 25 bars. The adsorption process was monitored through electrical resistivity measurements. As conditioning of the fibres, a chemical activation by acid etching followed by γ-ray irradiation with 60Co radioisotopes was performed. The surface energy was determined by means of the sessile drop test. Both conditioning treatments are supplementary; the chemical activation works on the outer surface and the γ-irradiation works in the bulk material as well. Apparently, the most significant parameter for hydrogen storage is the crystallite size. From this point of view, the most convenient materials are those with small grain size because hydrogen is accumulated mainly in the grain boundaries.
1. Introduction
The increase of the pollution level at the atmosphere and the oceans produced by the residues of fossil fuels and atomic residues is disquieting. The change of fossil fuels first and atomic fission later by “green energy” represents a drastic change in the World Economy, since the cost of the energy will necessarily increase during the next decades. In particular, the progress towards the hydrogen economy [1] is a demand and that must be accepted and implemented.
From this perspective, energy alternatives shall partially replace conventional technologies for energy production from fossil fuels that are increasingly scarce.
But the great handicap of alternative technologies is the storage of hydrogen, especially for hydrogen that will be used in fuel cars.
Different possibilities in this field are difficult and expensive, hydrogen as over-pressurized gas, liquid hydrogen, hydrogen stored in compounds is able to be released by chemical reactions, etc. Therefore, one of the most attractive possibilities is the technique of hydrogen absorbed in porous solids [2].
Among the solids potentially usable for this purpose, carbon materials have received special attention, perhaps because there was a wide prior experience in gases separation by pressure swing absorption, and the use of activated carbons in problems of waste water recovery.
The activated carbon fibre capacity is up to 4.5% - 5.3% w/w. The same order or capacity shows carbon nanotubes with some exceptional cases with even better capacity. With Li and K doped carbon nanotubes the storage capacity reaches 10% w/w. Graphene stores about 1% H2 w/w at room temperature [3]. The minimal capacity for hydrogen storage should be at least 6% w/w according to the Department of Energy of USA Standards. In order to improve the storage capability, the usual practice should be the activation of surface carbon fibres with an etching; the mechanism is the increase of the surface porosity [4] because micro-pores work as active sites to promote hydrogen adsorption [5].
The present work deals with the possibility of improving the hydrogen storage capacity using an activation process consisting of γ rays irradiation [6]. The efficiency of the method is based upon the fact that irradiation produces defects in carbon materials [7].
The present study was done using two types of samples, micro-fibres obtained from hydrocarbon gas on behalf a chemical vapour process, and commercial ex-PAN fibres, commercial carbon fibres obtained from a polyacrylonitrile precursor.
The micro-fibres are similar to activated carbon fibres with a hydrogen capacity storage of about 5% w/w [8] and with proven improvement with activation process [9]. The ex-PAN carbon fibres were chosen because it is known that their good response to the activation with γ rays [10]. In order to monitor the variation of the adsorbed hydrogen, the electrical resistivity was monitored [11].
2. Materials
In the present work, three types of carbon fibres were studied, vapour grown carbon fibres (VGCF) and commercial ex-PAN fibres, in the high-strength and highmodulus versions.
The VGCF were obtained from hydrocarbon gases involving a chemical vapour process. They were prepared in our laboratory using a quartz tube placed horizontally. The dimensions of the tube were 80 millimetres of internal diameter and 1 metre length. The quartz tube was heated by electrical heaters embraced to the tube. The temperature inside the furnace was controlled and programmed by means of a temperature controller CN616 TC1 and a solid state relay SSR330DC25, both manufactured by Omega™.
Hydrogen Premier Plus X50S, 99.999% purity, and Methane X50S, 99.995% purity, both supplied by Carburos Metálicos™, were the hydrocarbon gases utilized as reactants. A mass flow controller AWS-Digital, supplied by Witt™, was employed in order to work with the proper mixture and flow rate of gases at any time. Neither preheating nor de-oxygenation pre-treatments were performed before the hydrocarbon gases entered the furnace.
A solid iron catalyst was used to carry out the chemical production process that led to the fibre production. This catalyst also acted as a solid support from which the fibre was produced and accumulated during the whole process. The basic solid support structure was made of Grafoil®, acquired from Le Carbone Lorraine™. A 0.025-molar solution of nonahydrated ferric nitrate Fe(NO3)3∙9H2O in ethanol was nebulised over this support. Then, the support was introduced in an oven at 373 K for 10 minutes for organic solvent evaporation. As a result, the substrate surface was covered by many ferric nitrate microscopic grains. Finally, the substrate was placed right in the centre of the mullite furnace.
In a normal furnace operation, the mixture of hydrocarbon gases enters the furnace and is heated up. At the operation temperature, the gas mixture contacts the catalyst and there they suffer a decomposition that results in a production of a solid carbon deposit with filament shape. A vapour-liquid-solid (VLS) process [12,13] describes the gemination and growth mechanisms. A liquid drop of coronene (C24H12) is formed and it absorbs hydrogen from the atmosphere of hydrocarbon gas and hydrogen. When the solidification of this drop takes place, a VGCF with a considerable amount of hydrogen is obtained [14].
Every operation batch was divided into three stages. In the first one, pure hydrogen circulated and the furnace was heated up from room temperature to 1173 K at a heating rate of 20 K/min. The operating temperature was then stabilised for 5 minutes. In the next stage, a mixture of 70% of hydrogen and 30% of methane with a total flow rate of 950 cm3/min was used. The heating rate in this stage was 15 K/min until 1425 K was achieved. This temperature was kept constant during 40 minutes. Finally, a flow of pure argon was employed to cool down the furnace and finish with the batch.
Commercial ex-PAN carbon fibres are polyacrylonitrile filaments after a carbonization treatment. In this study, we used ex-PAN fibre Fortafil 3, supplied by Great Lakes Carbon Corporation®, now SGL Carbon®, as a high strength carbon fibre. As high modulus carbon fibre, we used the ex-PAN fibre Fortafil 5, also supplied by Great Lakes Carbon®.
The properties of these ex-PAN fibres are known [15]. For Fortafil 3, the axial tensile strength is 3.8 GN/m2 and its axial modulus is 227 GN/m2. For Fortafil 5, its Young’s modulus is 345 GN/m2 and its axial tensile strength is 2.76 GN/m2.
All these three types of carbon fibres were tested in three states: pristine, with surface treatment and after γ-rays irradiation without previous chemical treatment. Surface treatment means that the carbon fibres were submitted to an acid etching in HNO3, 53% purity, supplied from Panreac®, as described in [16,17]. The etching time was 24 hours, with a finishing consisting of rinsing three times with distilled water. Finally, the humidity remaining in the sample was removed by means of a moderate stove heating at 373 K for 4 hours.
All the studied carbon fibres were also exposed to γ-rays produced by 60Co isotopes in a radiation facility until an irradiation dose of 504 kGy was reached. The irradiation treatment was performed in the Nayade Facility of the Centre of Energy, Environment and Technology Research (CIEMAT), in Madrid, Spain [18].
The fibres have been labelled as “X” to point out that they are in pristine state, without any treatment at all. They are labelled with the term “HNO3” if they are carbon fibres with chemical activation, and finally, they are labelled with “Z” when have been irradiated.
In the case of the ex-PAN fibres, the label “PANhs” points out that it is a Fortafil 3 fibre (high strength) and the label “PANhm” means that the fibre is Fortafil 5 (high bulk modulus).Therefore, the complete list of the used samples is: PANhs-X, PANhs-HNO3, PANhs-Z, PANhm-X, PANhm-HNO3, PANhm-Z, VGCF-X, VGCFHNO3 and VGCF-Z.
3. Methods
To characterise the physical parameters of our samples, three different techniques have been used: electrical resistivity measurements, Raman spectroscopy and sessile drop test for the evaluation of the surface energy. The choice of the electrical resistivity for tracking the hydrogen adsorption is because the resistivity and the thermoelectric power have been used in the past to study the nature of the adsorption of hydrogen in single-walled carbon nanotubes. Both parameters show a linear behaviour as a function of gas coverage, consistent with a physisorption process [19].
The samples studied in the present work were cleaned with trichloroethylene for one hour and afterwards washed in ethanol. Finally, they were dried at 90˚C. After that, the samples were mounted in a frame and placed within an autoclave with a hydrogen atmosphere, over pressurised at 25 bar up to 40 hours. For the hydrogen desorption, the previously hydrogenated samples were located in an atmosphere of 1 bar of hydrogen.
In order to get representative data, each measurement was repeated with five different fibre samples; the measured data were averaged and plotted. The electrical resistivity of the fibre samples was measured using the four probe method [20]. A single fibre was place on an electrically insulating substrate, where four contacts were fixed to the fibre by means of the conductive epoxy CW2400®, supplied by Chemtronics®. In the four probe methods, there are two inner contacts and two outer contacts. Through the outer contacts, the electrical current is supplied, and the voltage measurements are taken from the inner contacts. The electrical resistance was measured with an Ethernet® multimetre and data acquisition system Keithley 2701®. The electrical resistivity has been obtained through the expression:
 (1)
(1)
where R is the electrical resistance of the specimen, measured in ohms (Ω), L is the length of the material in meters and A is its cross-sectional area in square meters, so the electrical resistivity ρ is expressed in Ω·m. The length L corresponds to the distance between the two inner contacts, having in this study the constant value of 5.0 ´ 10−4 meters.
For the measurement of the cross-sectional area A, a precise determination of the diameter of the fibres was needed. The diameters of the fibre samples were determined using the Fraunhofer diffraction phenomenon, as described in [21]. For this purpose, a red monochromatic laser, particularly a helium-neon gas laser with a wavelength value of 632.8 nm and a power of 0.95 mW, supplied by Uniphase®, was used. The fibre was placed on a support, which had a hole in the middle in order to permit the laser to go through after the interaction with the fibre. This support was attached to a simple structure that can be moved smoothly in both horizontal and vertical directions so that the fibre could be properly located in the laser beam trajectory.
The surface energy of the fibres was determined with the sessile drop method. It involves the measurement of the contact angle between the fibre and a liquid drop of any of the available standard components widely used. With the value of these contact angles, the Young’s equation [22] can be applied:
 (2)
(2)
The liquid-vapour surface energy is denoted as γlv, the solid-vapour surface energy as γsv and the term related to solid-liquid interfaces as γsl. Surface energy values are given in joules per square metre units. The term πe is the equilibrium pressure of the adsorbed vapour on the solid surface, being the most of the times a very small value, so it is usually considered negligible.
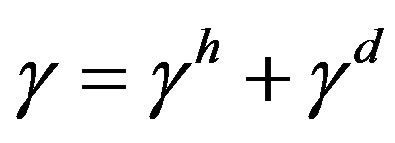
As it is established in [23], the solid-liquid term can be separated into polar (ionic forces and hydrogen bonds) and non-polar interactions (Keesom, Debye and London forces):
 (3)
(3)
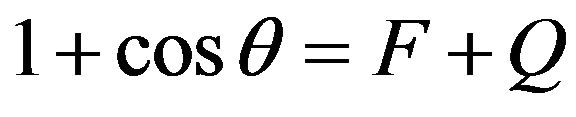
where the superscript h represents the polar forces and d the non-polar forces. Notice that these superscripts are not exponents. Given the separation of polar and non-polar forces, the solution of the Equation (2) can be found in literature as [23]:
 (4)
(4)
where 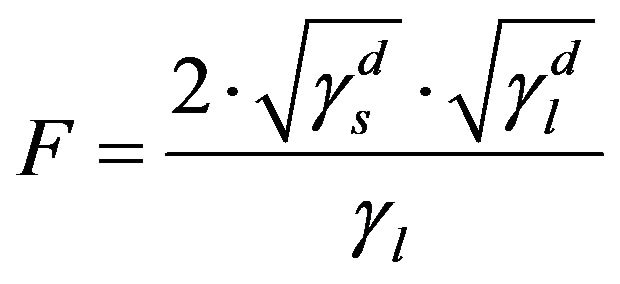 (5)
(5)
and 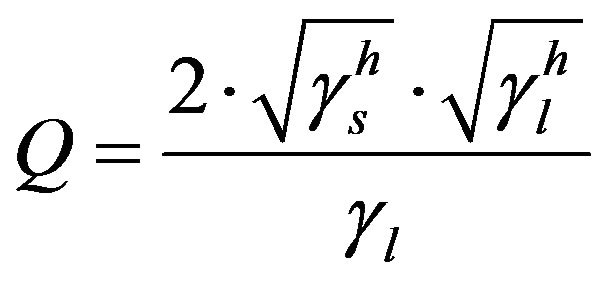 (6)
(6)
Thus, in the case of a polar liquid, it would have two components, according to Equation (3). However, if the liquid is non-polar, it would have only the non-polar component , whereas the polar component
 , resulting in
 . Given this, the energy surface of the solid γs, and therefore of the fibre, can be calculated by measuring the contact angle θ of two liquids, one polar and one non-polar. Then, the Equations (4) to (6) can be applied to both liquids and the resulting system of equations can be solved easily thanks to the simplification for the non-polar liquid. Firstly, with these three equations for the non-polar liquid, the non-polar component of the energy surface of the solid
  is obtained. In the following step, the same three equations for the polar liquid are used in order to obtain the polar component
 . Finally, γs is calculated as the sum of the non-polar and polar components, as in Equation (3).
In order to be able to perform these calculations, the data of the surface energy of the liquids should be known. For this study, coconut oil as non-polar compound and bidistilled glycerol as polar compound, both supplied by CUVE®, were used.
The data found in literature for the coconut oil is [24]:
 (7)
(7)
The values for the bidistilled glycerol are [23]:
 (8)
(8)
 (9)
(9)
The measurement of the contact angles was carried out by placing one fibre of each sample in horizontal position. The fibre could be fixed to the frame in the two fibre tips, keeping the fibre horizontally. The drops of coconut oil and bidistilled glycerol were spread using a nebuliser. In this way, some drops remain attached to the fibre. For this reason, it is possible to do the calculation of the three equations for several drops of different sizes set up in the same fibre.
To get the outline of each drop, a high magnification optical microscope Nikon® SMZ1500 that includes digital recording was used. In this way, the boundaries of both drop and fibre were registered. Thus, it was possible to adjust these outlines to a curve equation using the data analysis software Origin 8.0. Therefore, in the drop-fibre contact point, a value of the contact angle could be measured. A description of the method performed in this work for determining contact angles on fibres was found in literature [25] and it was also used in a previous research [26].
On other side, the determinations of the crystallite size and the H2 content of the fibre samples were carried out by means of Raman spectrometry analysis. In previous works, the ratio of the intensities of the Raman bands D and G has been proven to be an appropriate tool for the evaluation of the crystallite size, La [27]. Similarly, the ratio between the areas of the peaks D and G are a valid parameter to evaluate the hydrogen content [28].
The Raman spectroscopy analysis was carried out in a Jobin Yvon T64000 spectrometer with a micro entrance. The excitation source was a laser Spectrum 70 with several excitation lines along the visible. The excitation wavelength was 647.1 nanometres (red) and the signal was recorded in a range of 1000 cm−1 to 3000 cm−1 with acquisition time of 100 seconds for two scans to remove the peaks produced by cosmic rays.
4. Results and Discussion
The comparison between the evolution of the electrical resistivity of high strength and high modulus ex-PAN carbon fibres in a 25-bar hydrogen atmosphere is very interesting. Figure 1 shows the kinetics of the process of hydrogen intake in high strength carbon fibres, in the three presentations: as pristine (X), treated with acid etching (HNO3) and γ-irradiated (Z). In Figure 2 we also show the kinetics of the process, but for high modulus ex-PAN carbon fibres. Finally, Figure 3 shows the results for VGCFs.
If we compare the data of all these pictures, we can see that in pristine state, the high strength fibres are two times more resistive than that of high modulus. The effect of irradiation is more remarkable in the high strength fibres (at the beginning of the adsorption time there is a
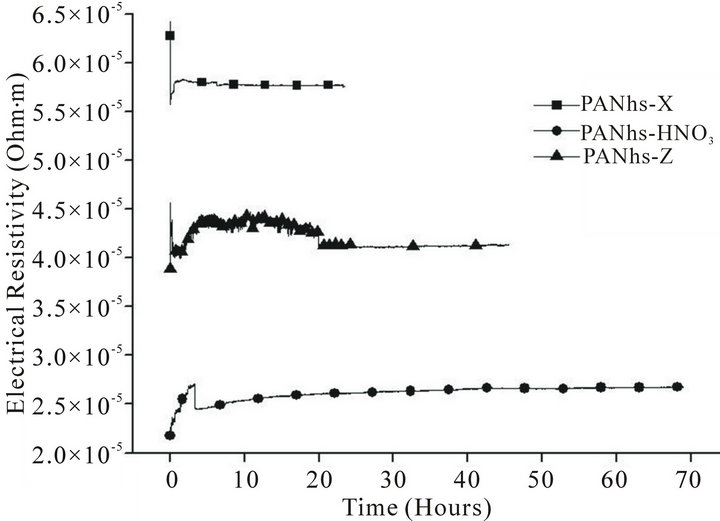
Figure 1. Adsorption of hydrogen in high strength ex-PAN fibres.
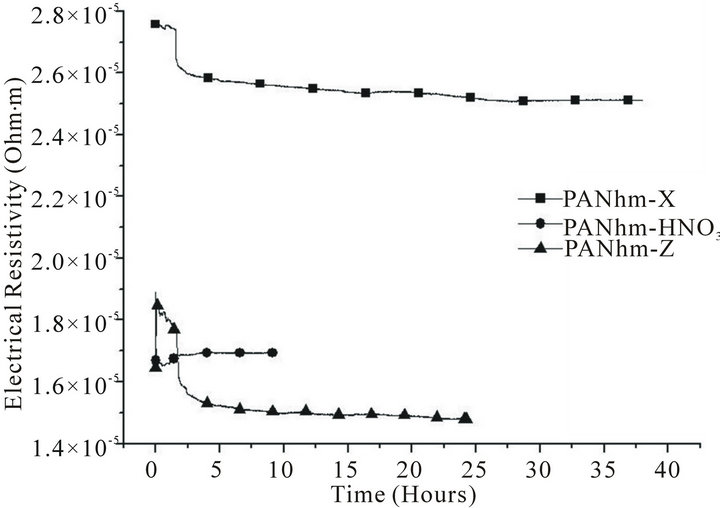
Figure 2. Adsorption of hydrogen in high modulus ex-PAN fibres.
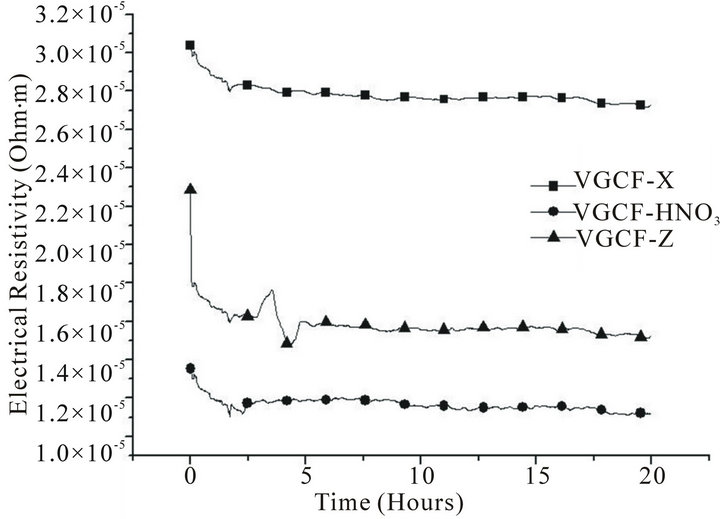
Figure 3. Adsorption of hydrogen in vapour grown carbon fibres.
transient regime) than in the high modulus fibres.
On the other side, there is a similar ratio between the stabilised resistivity of the irradiated and pristine samples for both high strength and high modulus fibres (70% and 60%, respectively).
This means that the γ-irradiation effect in the crystallinity of ex-PAN fibres is very relevant. This is due to Compton scattering, which is mostly responsible for the interaction of γ-rays with carbon fibres and causes ionization and atomic displacements, as described in [29].
In the case of the VGCF, the irradiated sample also shows a transient regime before to reach the steady state.
The most remarkable fact is that irradiation decreases the electrical resistivity (see Figures 1-3), according with previous results that shows as the γ-irradiation increases the electrical conductivity [30].
It is also possible to see in the same three figures that beside of the decrease in the electrical resistivity, the irradiated samples show an evolution towards a minor resistivity, as suggested in previous studies that described the healing of the generated defects during γ-irradiation [31].
The process of desorption of hydrogen is studied by comparing the Figures 4-6, corresponding to the outgassing process of the fibres in a 1-bar hydrogen atmosphere. The results for the high strength ex-PAN fibres, shown in Figure 4, point out that pristine and irradiated samples reach the steady state very soon. In contrast, the high modulus ex-PAN carbon fibres show a clear difference between pristine and irradiated samples. The irradiated sample reaches very soon the steady state, but the pristine fibre increases its resistivity very slowly, suggesting a slow outgassing of hydrogen.
In the case of VGCF, in Figure 6, it is observed the opposite. This means that the pristine sample reach steady state very fast, but the irradiated samples need almost 30 hours to reach stabilisation.
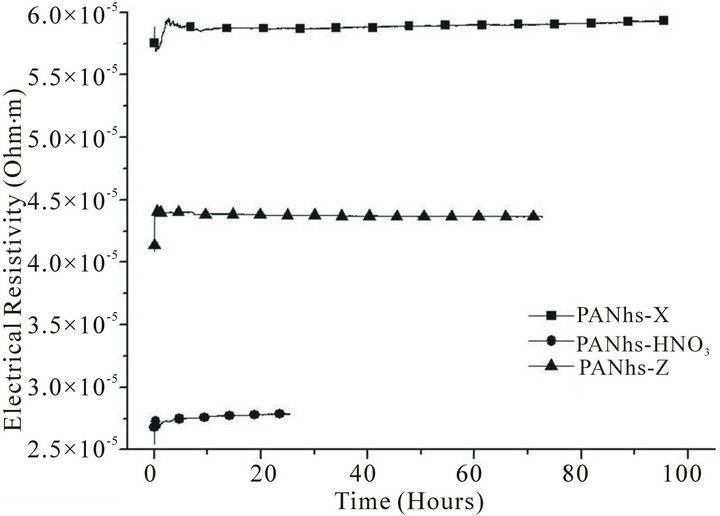
Figure 4. Desorption of hydrogen in high strength ex-PAN fibres.
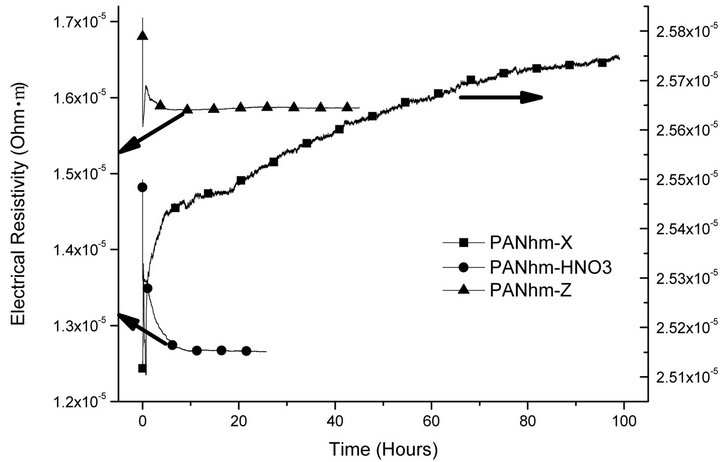
Figure 5. Desorption of hydrogen in high modulus ex-PAN fibres.
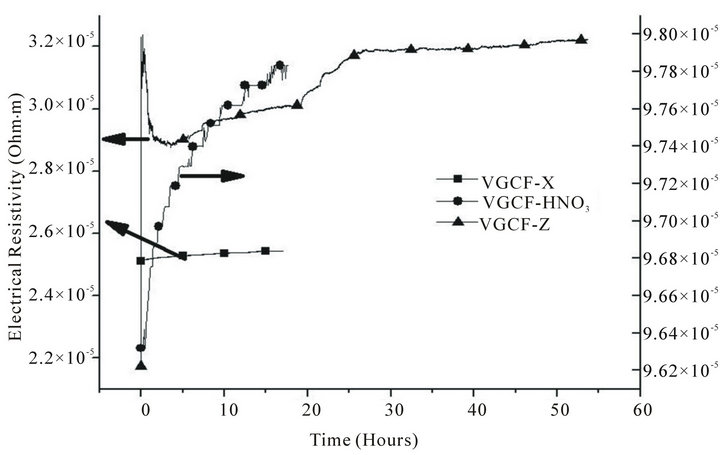
Figure 6. Desorption of hydrogen in vapour grown carbon fibres.
The behaviour of activated fibres is rather different. Comparing Figures 1-3, it can be seen that after 5 hours, the adsorption is stabilised. In all cases, the resistivity is much lower than pristine and irradiated samples.
In the results of the desorption of activated VGCF shown in Figure 6 the evolution of the activated fibre is to reach an electrical resistivity value higher than for ex-PAN fibres. That means that the fibre emitted a large amount of hydrogen, because high electrical resistivity means scarcity of hydrogen [32].
The measurement of the surface energy gives interesting information, shown in Table 1, where it is possible to see similar changes in high strength ex-PAN fibres and VGCF, but different in high modulus ex-PAN fibres. In the first case, the action of irradiation is to decrease the surface energy of the pristine samples, but in the second one the irradiation increases the surface energy.
Just the opposite happens if we compare the influence of the acid etching on the energy surface. In the high modulus ex-PAN fibres and VGCF, the action of the activation is to decrease the surface energy, but in the case of high strength ex-PAN fibres, the effect of the activation is an increase of the surface energy.
Apparently, there is no parallelism between the γ-irradiation process and the acid etching effects in the surface of these fibres. This is due to the huge difference in the mechanism of the interaction. The Compton Effect

Table 1. Energy surface of the fibres by means of contact angle measurement.
of the irradiation mainly changes crystalline structures, whereas acid attack to a carbon is more pronounced if the carbon is amorphous. As an example, it is possible to say that when nanotubes are fabricated, the current practice to eliminate the amorphous soot is a treatment with acid, which totally annihilates the amorphous carbon, but the crystalline nanotubes remain intact [33].
Finally, we used Raman spectroscopy because it is known that γ-irradiation effect affects bands D and G of the carbons [34].
In the particular case of this study, for the samples used, it is observed the influence of the irradiation in the D and G peaks morphology. As an example, in Figure 7 it is shown the Raman spectra of the two samples of VGCF presented as pristine and irradiated.
Besides, we have used Raman spectroscopy to determine the crystallite size, La [27] and the hydrogen content [28], as it is shown in Figure 8.
As it can be seen, the values of La for the high modulus ex-PAN fibre are much higher than the ones for

Figure 7. Raman spectra showing changes in crystallinity due to the irradiation.
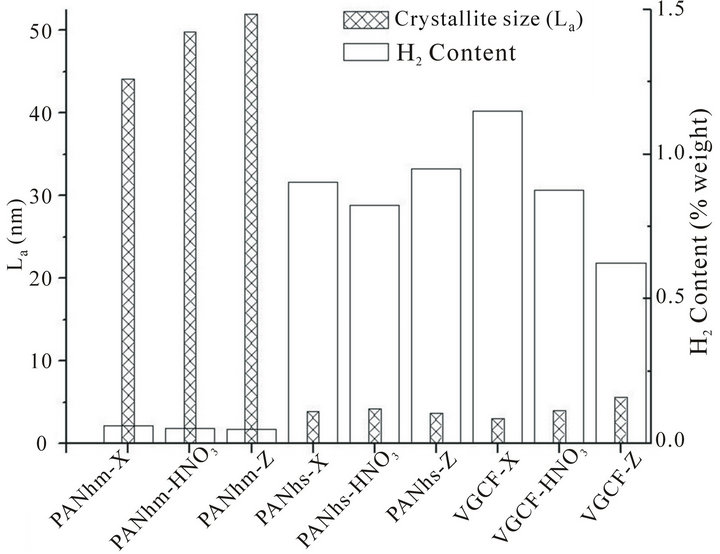
Figure 8. Hydrogen content and crystallite size obtained by means of Raman spectroscopy.
the high strength ex-PAN fibre and the VGCF. Also, it is observed that the more La is, the bigger the effect of the acid etching and irradiation treatments. Thus, both treatments would have more influence in a sample with a bigger value of La.
In addition to this, for the high strength ex-PAN fibre and VGCF there is an increase of La when the sample is irradiated. In the case of the high strength ex-PAN fibre, La does not change so remarkably.
Also, in Figure 8, it is interesting to highlight that the values of the hydrogen content for the high strength ex-PAN fibres and VGCFs are much higher than those for the high modulus ex-PAN fibres. This is equivalent to say that crystallite size is inversely proportional to hydrogen content. This is in agreement with published results [35] that explain that the hydrogen is mainly stored in the grain boundaries. The hydrogen retention increases with decreasing grain size.
5. Conclusions
As a summary of these results, we can conclude:
1) It is possible to track the adsorption and desorption of hydrogen in the carbon fibres studied in this work by measuring the electrical resistivity.
2) The numbers of surface energy are not directly related to the hydrogen content, what means that hydrogen is not only stored on the surface, but also in the bulk material.
3) The irradiation treatment has influenced over the adsorption and desorption processes of hydrogen. In general, it decreases the electrical resistivity due to the changes produced in the crystalline quality.
4) For hydrogen storage purposes, it is better to use materials with a small crystallite size, because hydrogen tends to anchor into the grain boundaries.
5) The two treatments used in this study, the chemical activation and the γ-irradiation, are supplementary. The chemical treatment works on the outer surface of the material, whereas the irradiation works also within the bulk material.
6. Acknowledgements
We would like to acknowledge support from the Spanish Ministry of Finances and Competitiveness for support via the Programme ConsoliderIngenio 2010 (project CSD 2010-00044).
REFERENCES
- W. McDowall and M. Eames, “Towards a Sustainable Hydrogen Economy: A Multi-Criteria Sustainability Appraisal of Competing Hydrogen Futures,” International Journal of Hydrogen Energy, Vol. 32, No. 18, 2007, pp. 4611-4626. doi:10.1016/j.ijhydene.2007.06.020
- K. L. Lim, H. Kazemian, Z. Yaakob and W. R. W. Daud, “Solid-State Materials and Methods for Hydrogen Storage: A Critical Review,” Chemical Engineering and Technology, Vol. 33, No. 2, 2010, pp. 213-226. doi:10.1002/ceat.200900376
- R. Ströbel, J. Garche, P. T. Moseley, L. Jörissen and G. Wolf, “Hydrogen Storage by Carbon Materials,” Journal of Power Sources, Vol. 159, No. 2, 2006, pp. 781-801. doi:10.1016/j.jpowsour.2006.03.047
- E. Raymundo-Piñero, D. Cazorla-Amorós, A. LinaresSolano, S. Delpeux, E. Frackowiak, K. Szostak and F. Béguin, “High Surface Area Carbon Nanotubes Prepared by Chemical Activation,” Carbon, Vol. 40, No. 9, 2002, pp. 1597-1617. doi:10.1016/S0008-6223(02)00134-3
- D. Qu, “Investigation of Hydrogen Physisorption Active Sites on the Surface of Porous Carbonaceous Materials,” Chemistry—A European Journal, Vol. 14, No. 3, 2008, pp. 1040-1046. doi:10.1002/chem.200701042
- M. A.Obolensky, A. V. Basteev and L. A. Bazyma, “Hydrogen Storage in Irradiated Low-Dimensional Structures,” Fullerenes, Nanotubes and Carbon Nanostructures, Vol. 19, No. 1-2, 2011, pp. 133-136. doi:10.1080/1536383X.2010.490134
- S. Gupta, B. L. Weiss, B. R. Weiner, L. Pilione, A. Badzian and G. Morell, “Electron Field Emission Properties of Gamma Irradiated Microcrystalline Diamond and Nanocrystalline Carbon Thin Films,” Journal of Applied Physics, Vol. 92, No. 6, 2002, pp. 3311-3317. doi:10.1063/1.1499996
- K. Hanada, H. Shiono and K. Matsuzaki, “Hydrogen Uptake of Carbon Nanofiber under Moderate Temperature and Low Pressure,” Diamond and Related Materials, Vol. 12, No. 3-7, 2003, pp. 874-877. doi:10.1016/S0925-9635(02)00360-6
- F. Suárez-García, J. Nauroy, A. Martínez-Alonso and J. M. D. Tascón, “Thermogravimetric Studies on the Activation of Nanometric Carbon Fibers,” Journal of Thermal Analysis and Calorimetry, Vol. 79, No. 3, 2005, pp. 525- 528. doi:10.1007/s10973-005-0573-1
- J. Q. Li , Y. D. Huang, S. Y. Fu, L. H. Yang, H. Qua and G. Wu, “Study on the Surface Performance of Carbon Fibres Irradiated by G-ray under Different Irradiation Dose,” Applied Surface Science, Vol. 256, No. 7, 2010, pp. 2000- 2004. doi:10.1016/j.apsusc.2009.09.035
- A. P. Voit, E. A. Evard and I. E. Gabis, “Effect of Sorbed Hydrogen on the Conductivity of Nanoporous Carbon,” Materials Science, Vol. 38, No. 4, 2002, pp. 570-575. doi:10.1023/A:1022970818229
- A. Madroñero, “Possibilities for the Vapour-Liquid-Solid Model in the Vapour-Grown Carbon Fibre Growth Process,” Journal of Materials Science, Vol. 30, No. 8, 1995, pp. 2061-2066. doi:10.1007/BF00353034
- Ph. Serp, A. Madroñero and J. L. Figueiredo, “Production of Vapour-Grown Carbon Fibres: Influence of the Catalyst Precursor and Operating Conditions,” Fuel, Vol. 78, No. 7, 1999, pp. 837-844. doi:10.1016/S0016-2361(98)00216-6
- A. Madroñero and M. Verdú, “Hydrogen Content Evaluation in Vapour-Grown Carbon Fibres by SIMS,” Carbon, Vol. 33, No. 3, 1995, pp. 247-251. doi:10.1016/0008-6223(94)00139-Q
- L. H. Peebles Jr., “Carbon Fibres: Structure and Mechanical Properties,” International Materials Reviews, Vol. 39, No. 2, 1994, pp. 75-92. doi:10.1179/095066094790326248
- P. Vinke, M. van der Eijk, M. Verbree, A. F. Voskamp and H. van Bekkum, “Modification of the Surfaces of a Gas-Activated Carbon and a Chemically Activated Carbon with Nitric Acid, Hypochlorite, and Ammonia,” Carbon, Vol. 32, No. 4, 1994, pp. 675-686. doi:10.1016/0008-6223(94)90089-2
- H. Takagi, Y. Soneda, H. Hatori, Z. H. Zhu and G. Q. Lu, “Effects of Nitric Acid and Heat Treatment onHydrogen Adsorption of Single-Walled Carbon Nanotubes,” Australian Journal of Chemistry, Vol. 60, No. 7, 2007, pp. 519-523. doi:10.1071/CH06409
- http://www.csn.es/images/stories/actualidad_datos/ofin_11/ccnn_11/ain_cie_191_11.pdf
- G. U. Sumanasekera, C. K. V. Adu, G. Chen, H. E. Romero and P. C. Elkund, “Thermoelectric Study of Hydrogen Storage in Carbon Nanotubes,” Physical Review B, Vol. 65, No. 3, 2001, Article ID: 035408. doi:10.1103/PhysRevB.65.035408
- M. Hájek, J. Veselýa and M. Cieslara, “Precision of Electrical Resistivity Measurements,” Materials Science and Engineering A, Vol. 462, No. 1-2, 2007, pp. 339-342. doi:10.1016/j.msea.2006.01.175
- A. Madroñero and C. Merino, “Some Geometrical Singularities in the Characterization of Vapor Grown Carbon Fibers Using Laser Diffraction Technique,” Materials Research Bulletin, Vol. 33, No. 10, 1998, pp. 1503-1515. doi:10.1016/S0025-5408(98)00144-5
- K. Holmberg, D. O. Shah and M. J. Schwuger, “Handbook of Applied Surface and Colloid Chemistry,” Wiley, New York, 2002.
- F. M. Fowkes, “Attractive Forces at Interfaces,” Industrial and Engineering Chemistry, Vol. 56, No. 12, 1964, pp. 40-52. doi:10.1021/ie50660a008
- Q. Shu, J. F. Wang, B. X. Peng, D. Z. Wang and G. R. Wang, “Predicting the Surface Tension of Biodiesel Fuels by a Mixture Topological Index Method, at 313 K,” Fuel, Vol. 87, No. 17-18, 2008, pp. 3586-3590. doi:10.1016/j.fuel.2008.07.007
- W. C. Jones and M. C. Porter, “A Method for Measuring Contact Angle on Fibres,” Journal of Colloid and Interface Science, Vol. 24, No. 1, 1967, pp. 1-3. doi:10.1016/0021-9797(67)90269-X
- A. Madroñero, A. Asenjo, C. Gil, M. Jaafar and A. López, “Reconnaissance of the Specific Surface of Vapour Grown Carbon Micro and Nanofibres as a Main Controller of the Sorption of Hydrogen,” Applied Surface Science, Vol. 256, No. 20, 2010, pp. 5797-5802. doi:10.1016/j.apsusc.2010.02.056
- L. G. Cançado, K. Takai, T. Enoki, M. Endo, Y. A. Kim, H. Mizusaki, A. Jorio, L. N. Coelho and R. MagalhãesPaniago, “General Equation for the Determination of the Crystallite Size La of Nanographite by Raman Spectroscopy,” Applied Physics Letters, Vol. 88, No. 16, 2006, Article ID: 163106. doi:10.1063/1.2196057
- M. Culebras, A. Madroñero, A. Cantarero, J. M. Amo, C. Domingo and A. Lopez, “Confident Methods for the Evaluation of the Hydrogen Content in Nanoporous Carbon Microfibers,” Nanoscale Research Letters, Vol. 7, 2012, pp. 588-592. doi:10.1186/1556-276X-7-588
- Z. W. Xu, Y. D. Huang, C. Y. Min, L. Chen and L. Chen, “Effect of Gamma-Ray Radiation on the Polyacrylonitrile Based Carbon Fibers,” Radiation Physics and Chemistry, Vol. 79, No. 8, 2010, pp. 839-843. doi:10.1016/j.radphyschem.2010.03.002
- V. Skakalova, U. Dettlaff-Weglikowska and S. Roth, “Gamma-Irradiated and Functionalized Single Wall Nanotubes,” Diamond and Related Materials, Vol. 13, No. 2, 2004, pp. 296-298. doi:10.1016/j.diamond.2003.11.003
- S. Suzuki and Y. Kobayashi, “Healing of Low-Energy Irradiation-Induced Defects in Single-Walled Carbon Nanotubes at Room Temperature,” Journal of Physical Chemistry C, Vol. 111, No. 12, 2007, pp. 4524-4528. doi:10.1021/jp067398r
- A. P. Voit, E. A. Evard and I. E. Gabis, “Effect of Sorbed Hydrogen on the Conductivity of Nanoporous Carbon,” Materials Science, Vol. 38, No. 4, 2002, pp. 570-575. doi:10.1023/A:1022970818229
- S. Lyu, D. Jung, K. Ahn, H. Lee, N. Lee, Y. Park and J. Sok, “Purification of Single-Walled Carbon Nanotubes by HCl Treatment and Analysis of the Field Emission Property,” Journal of Korean Institute of Metals and Materials, Vol. 48, No. 4, 2010, pp. 335-341. doi:10.3365/KJMM.2010.48.04.335
- M. Hulmana, V. Skákalová, S. Roth and H. Kuzmany, “Raman Spectroscopy of Single-Wall Carbon Nanotubes and Graphite Irradiated by γ Rays,” Journal of Applied Physics, Vol. 98, No. 2, 2005, Article ID: 024311. doi:10.1063/1.1984080
- Sh. Michaelson, O. Ternyak and A. Hoffman, “Correlation between Diamond Grain Size and Hydrogen Retention in Diamond Films Studied by Scanning Electron Microscopy and Secondary Ion Mass Spectroscopy,” Applied Physics Letters, Vol. 90, No. 3, 2007, Article ID: 031914. doi:10.1063/1.2432996