Theoretical Economics Letters
Vol.4 No.1(2014), Article ID:42800,11 pages DOI:10.4236/tel.2014.41008
A Prototype Master Code of Accounting Structure to Facilitate Accurate Measures of Construction Labor Productivity across Multiple Projects
1Department of Civil Engineering, University of Kentucky, Lexington, USA
2Construction Engineering and Management, Department of Civil, Environmental, and Architectural Engineering, University of Colorado at Boulder, Boulder, USA
3Department of Civil, Environmental, and Architectural Engineering, University of Colorado at Boulder, Boulder, USA
Email: gabe.dadi@uky.edu
Copyright © 2014 Gabriel B. Dadi et al. This is an open access article distributed under the Creative Commons Attribution License, which permits unrestricted use, distribution, and reproduction in any medium, provided the original work is properly cited. In accordance of the Creative Commons Attribution License all Copyrights © 2014 are reserved for SCIRP and the owner of the intellectual property Gabriel B. Dadi et al. All Copyright © 2014 are guarded by law and by SCIRP as a guardian.
Received November 25, 2013; revised December 25, 2013; accepted December 31, 2013
KEYWORDS
Construction Industry; Material Tracking; Productivity
ABSTRACT
The United States National Academies identified several recommendations for the construction industry in 2009 to improve industry performance. One of the key recommendations was the development of reliable productivity measures to improve the efficiency and support of developing new construction innovations. Difficulty in measuring real output in the industry is a challenge that has prevented reliable productivity metrics. An alternative approach would be to consistently measure activity productivity across multiple construction projects throughout the United States and develop an aggregate measure accordingly. However, activity measures are inconsistent across both construction projects and even projects within the same company. Identifying an industry standard code of accounting would be a critical first step towards improving industry performance. The authors collected code of accounts from six large construction firms to identify the impact that code structure has on the ability to accurately measure labor productivity on a current along with the ability to estimate it on future projects as well. This paper focuses on mechanical piping code structure and productivity comparisons to the widely used industry estimating manuals produced by RSMeans Building Construction Cost Data and Richardson’s Process Plan Construction Cost Estimating Standards (PPCES). The paper’s contribution to the overall body knowledge illustrates the significance and degree of the impact that piping and conduit code structures related to diameter size, material type, and installation location have on accurately measuring productivity rates. The methods can be applied to other trade activities to develop an industry-wide standard code structure.
1. Introduction
A reliable productivity metric for the US construction industry has remained elusive for decades. The goal of developing a productivity index for construction was described as a significant industry need by governmental agencies, industry practitioners, and academics in 1983 through a Business Roundtable industry report [1]. The need was further echoed as a high industry priority by the US National Academies’ 2009 report on Advancing Competitiveness and Efficiency of the US Construction Industry [2]. Reliable measures would yield several benefits to multiple industry stakeholders, including: improved reliable benchmarking efforts, improved predictability of future project costs and schedule requirements for both contractors and owners, and a better understanding of the impact that regulations and policy have on the performance of the construction industry.
Absence of a reliable industry productivity measure creates uncertainty in the actual construction productivity trends. A number of previous efforts that attempted to measure the industry’s productivity using macro-scale data indicated that the industry has experienced longterm declines in productivity [3-6]. Is it then fair to say that productivity in the US construction industry has been declining for several decades? Despite what appears to be overwhelming evidence, the answer is unexpectedly not obvious. Contradictory results that productivity among selected construction tasks has improved over the past several decades have been found by others [7]. Unfortunately, the culmination of previous research findings do not accurately provide clear measures about whether productivity is improving or declining at any specific point in time, since the US Bureau of Labor Statistics does not maintain an official productivity index for construction out of concerns that have been well published regarding the accuracy of existing measures of the construction industry’s output [8-12]. While these issues have been addressed in part by the development of new Producer Price Indexes by the US Bureau of Labor Statistics for non-residential construction, the development of an official construction productivity index by the US government has yet to be developed.
Many companies track the productivity of individual construction commodities on their projects using unit measures, such as the ratio of the work hours required to install a unit of output. While unit rates of individual commodities provide sufficient detailed data for a construction site management team to control the performance on their project, aggregating unit rate data to compare productivity performance across multiple projects can be challenging for a couple of reasons. First, different projects are composed of different commodities with varying units of output, therefore a comparison of project performances based only on unit rate data requires normalization techniques, which can be done [13], but the transformation obscures actual productivity performances. Second, there is no standard basket of “goods” that readily ensure that project unit rates can be compared on the same basis. Third, codes of accounts used to track unit rates can not only differ by company, but they can also differ by project within a company. For example, one project may track the unit rates of underground ductile iron piping between 6 to 8” while another project may track the unit rates between 6 to 12”.
Outside of project specific control reports, unit rate data does exist elsewhere in the industry. One common source of unit rate data is commercial estimation manuals, such as R.S. Means Estimation manuals, which are often used by construction industry professionals to estimate the cost of a project. While estimation manuals have been used to examine long-term trends in construction productivity [7,14-16], there are significant concerns that caution their use as a data source for benchmarking industry performance, including: 1) lack of documentation in the public domain on the manuals’ methodology on the data collection, survey forms used, and frequency at which both output and cost data is updated for every commodity; and 2) potential bias by construction firms who submit information for the estimation manuals, since they know that they are not required to construct a project using their estimations, which tends to create inflated estimates of construction costs [17]. Outside of commercial estimation manuals, there are relatively few sources of other micro productivity measures in the construction industry. One source is the Construction Industry Institute through its Benchmarking and Metrics (BM & M) program, but the data is not open to the public domain, and it is primarily focused on the industrial construction sector. The BM & M dataset is intended to allow participating companies to compare performance on their projects with similar projects in order to help companies identify practices that may improve their respective project performance.
One path towards developing reliable industry productivity measures is through the development of an industry standard code of accounting. A standard code of accounts would provide the potential for construction firms to collect productivity data on the same basis to enable better comparison of productivity performance across multiple projects. Consistency in how productivity data is collected on construction jobsites could also create a path towards aggregating activity productivity data into an industry measure. A challenge of developing a master code of accounts involves identifying a code of accounts that is both implementable and yet provides a classification that is accurate to predict future performance. For example, a master code of accounts that tracks the labor productivity of pipe installation for every one inch interval would provide a very detailed database of labor productivity, but it would require significant effort on behalf of field supervisors (e.g. foremen) to accurately code timesheets and quantity installed reports. In contrast, a very general coding scheme which tracked the hours and quantity of pipe installed in a single code maybe easy for field supervision to record, but it would provide an inaccurate record of productivity measure. In collaboration with industry partners, the previous research described herein identified a prototype that adhered to the guidelines of being both accurate and implementable, and which was also compatible with existing master code of accounts among six sampled construction firms.
Standard classification systems do exist in the US engineering and construction industry, including the Construction Specification Institute’s (CSI) Masterformat, ASTM Uniformat II, and the OmniClass Classification System, but these existing classifications do not go to the level of detail necessary to accurately track productivity across different projects. For example, the CSI Masterformat contains over 1000 different codes, but the codes were not designed to be implemented in a project controls system. Instead, the CSI Masterformat was designed to standardize the organization of design data and information related to contract administration. Furthermore, a number of the codes do not go into the level of detail to allow accurate tracking and comparison of productivity data across multiple projects. For example, CSI 2004 Masterformat code for electrical conduit is 26.05.33.13, but no other codes are provided for different sizes of electrical conduit. While this added detail is admittedly not needed for the organization of design data, it would be needed to accurately track the unit rates of installing a 1 inch versus a 6 inch diameter conduit system.
The work described herein examines how the organization of standard code of accounts can influence the ability to both accurately report existing labor productivity performance as well as predict labor productivity performance on future construction projects as well. The manuscript results are divided into two phases. Phase I introduces existing accounting code structures from six large construction firms, the authors examine the significant differences and similarities that exist among the sample of standard codes. Utilizing the existing code structures, Phase II examines the sample of the existing accounting codes to accurately report labor productivity performance utilizing productivity data from both RS Means Building Construction Cost Data and Richardson’s Process Plant Construction Cost Estimating Standards. Phase II presents several regression models to analyze the impact how different coding policies within mechanical piping and electrical conduit (e.g. size, material type, and installation location) influence the accuracy of predicting labor productivity. A focus was made on analyzing mechanical piping and electrical conduit codes, since these two activities typically lie on a project’s critical path and can be found across a wide variety of project types. Further work can incorporate other significant trades using a similar methodology such as steel and concrete. The labor unit rates from RSMeans and Richardson’s Process Plant Construction Cost Estimating Standards (PPCES) were used as the dependent productivity figures, which eliminates the reliance on confidential company data and differences in construction sector and business practices.
2. Phase I
The authors obtained the master code of accounts from six construction firms described in Table 1. Most of the firms posted annual revenues in excess of $1 Billion. Four of the construction firms primarily worked in the United States, while the two remaining firms worked not only in the United States but in international locations as well. All of the firms did extensive direct work in electrical and mechanical systems, although a couple of the firms perform work in other trades as well, e.g. concrete and steel. Demographics of the six firms regarding their primary geographic region of work, construction sector and business revenues are also shown in Table 1.
The authors analyzed the master code of accounts for piping and conduit work, which are primary activities in mechanical and electrical systems. Table 2 is a synopsis of the level of detail contained within the piping and conduit codes. The table shows not only the number of different codes that each construction firm utilizes to track piping and conduit installation, but it also details the number of different classifications each firm uses for material type and sizes. As shown in Table 2, there is significant variability in the number of codes and their detail.
The greatest variances were found in the number of different piping and conduit codes themselves. For example among the piping codes, Company F maintained 363 different mechanical piping codes while Company B maintained 31. Interestingly, Company F and B are typically competitors when bidding on new projects, so a logical question is whether the added codes in Company F can offer a competitive advantage in potentially greater accuracy in their bids. This aspect is examined in further detail in phase II.
In order to examine the source of the variability in the number of codes for each company, Table 3 details the specifics of each company’s code structure. As shown, the areas of greatest variation occur in the different size distributions, for both piping and conduit, and in the different material classifications as well. In term of pipe sizes, Company C collapsed the codes into just two codes: small bore piping smaller than 2.5” diameter and large bore piping greater than 2.5” diameter. No other pipe sizing classifications were reported by Company C. In contrast, Company F maintained 12 different size classifications.
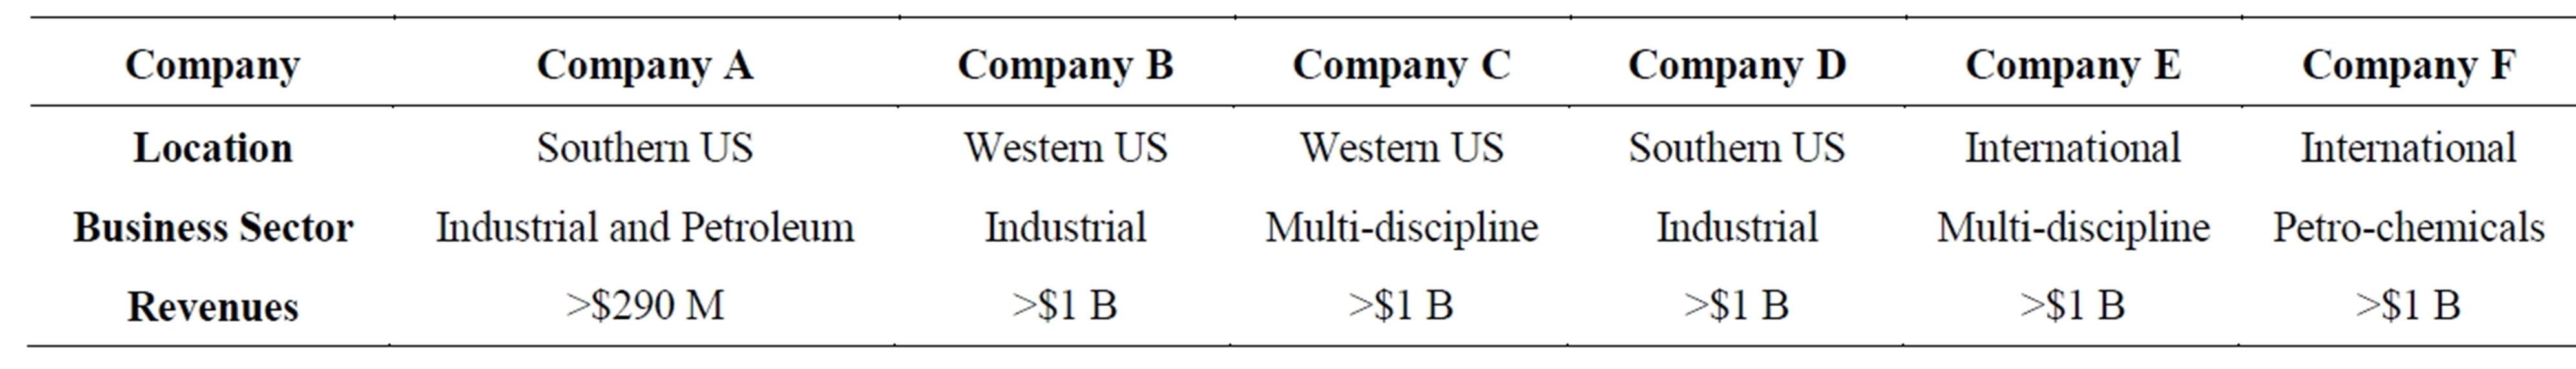
Table 1. Company profile of construction firms providing master code of accounts.
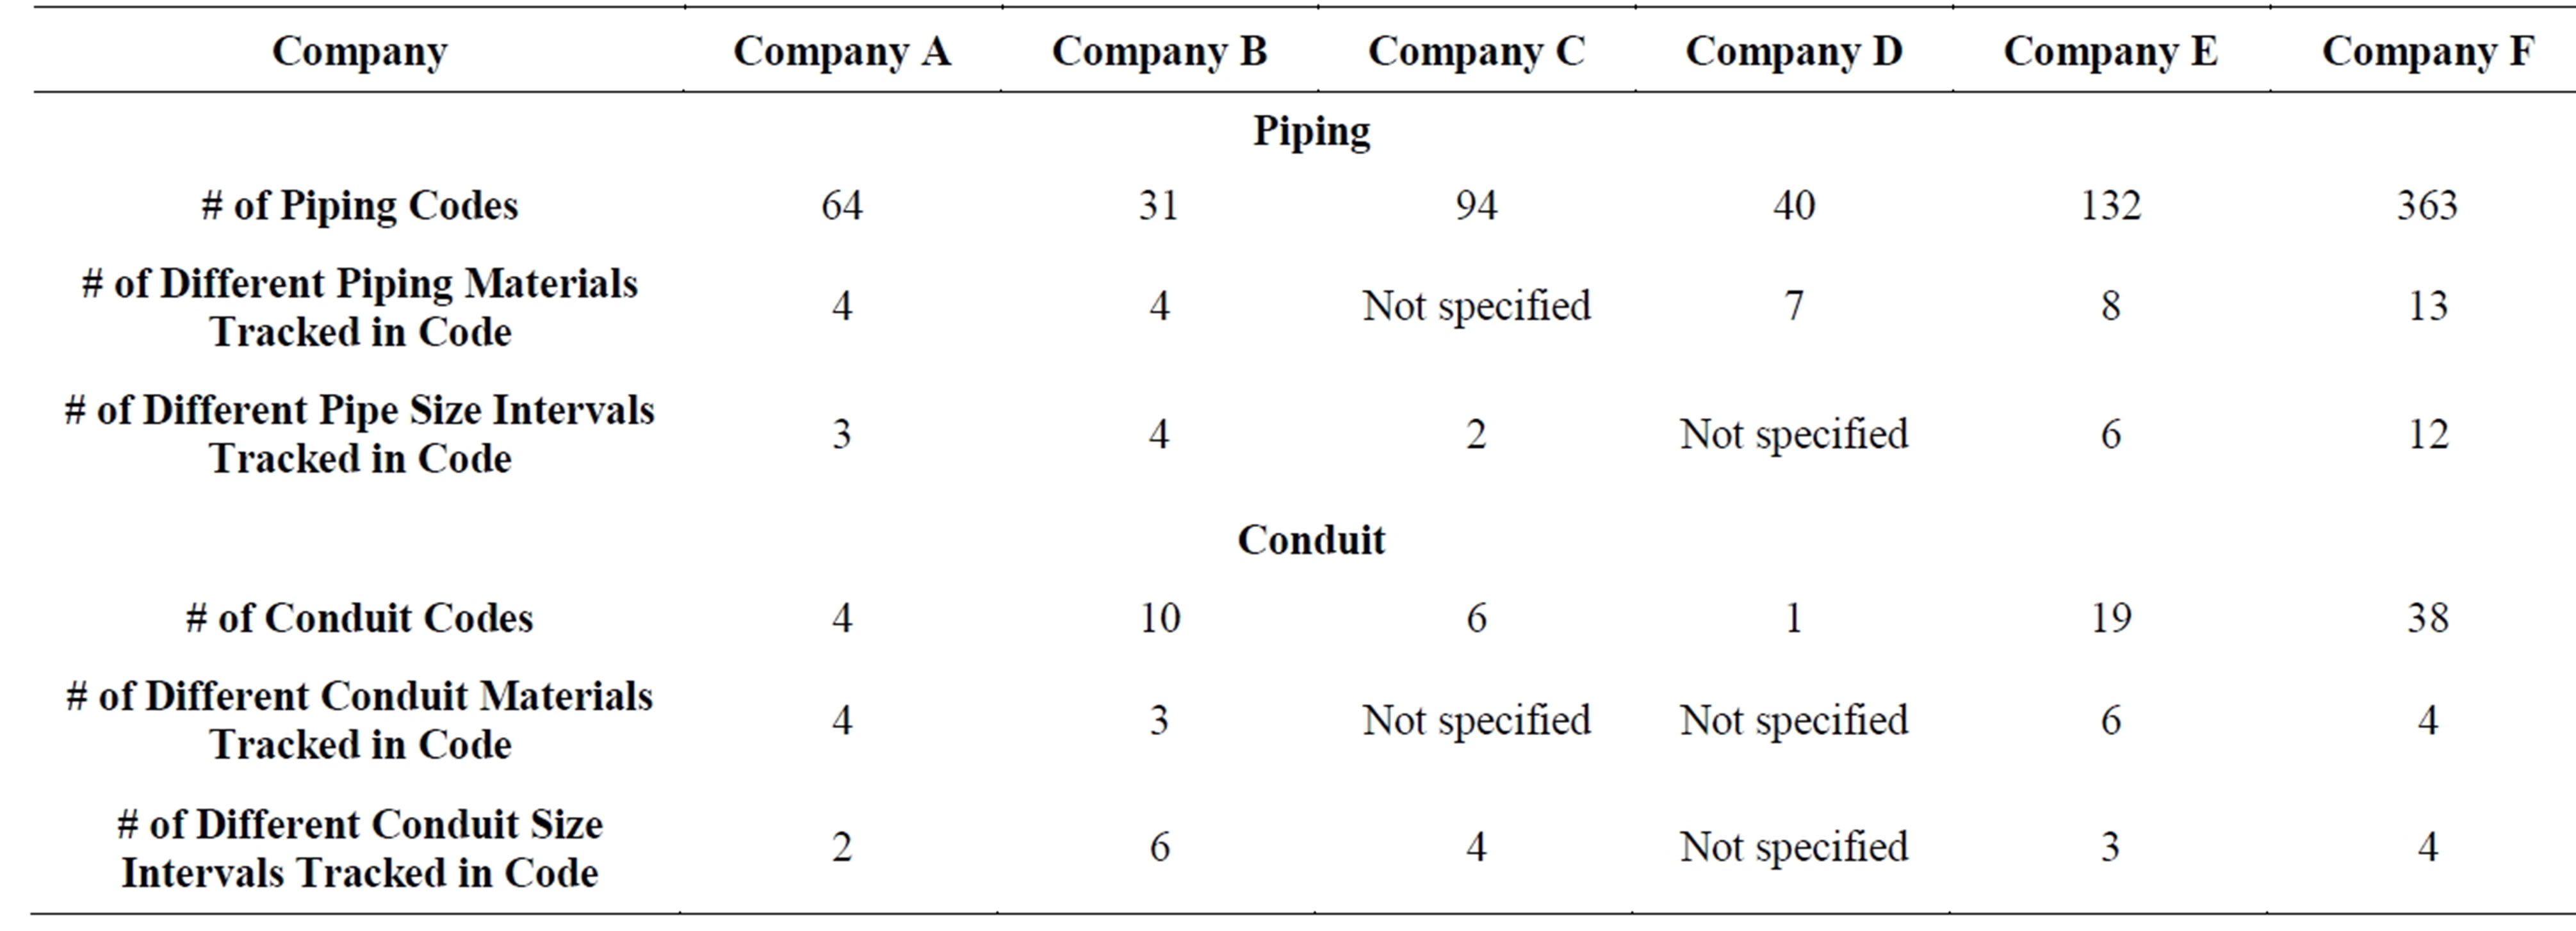
Table 2. Summary of existing piping and conduit code of accounts.
Phase I Results
Diameter, material type, and installation location are significant criteria coding piping and conduit accounts, but there is no uniformity in how the sampled companies’ codes are structured. How do the differences in the code structures influence the ability to record actual labor productivity performance? Phase I did not include the actual productivity data associated with each master code of account structure; only the code structure itself was provided by the construction firm due to the proprietary nature of their actual productivity data. To examine this in more detail, Phase II utilized productivity data from the RSMeans Building Construction Cost Data and Richardson’s Process Plant Construction Cost Estimating Standards (PPCES).
3. Phase II
Means and Richardson utilize a code structure that is typically significantly more detailed than the code structures utilize by the sampled construction firms. Table 4 is a synopsis of the standard codes utilized by the manuals.
Across all categories, Means’ and Richardson’s Estimation Manuals utilize a more detailed code structure than any of the sampled construction firms. While it may be logical to propose utilizing the master codes from either estimating manual as a standard master code, the level of effort required to accurately code labor and cost data from a field supervisor’s perspective would be significantly greater than what is currently utilized among the sampled construction firms. Instead, what level of granular detail can be sacrificed while still maintaining a level of sufficient accuracy? Phase II examines this in detail.
3.1. Phase II Methodology
Utilizing multiple regression models, Phase II examines the optimal level of detail required in piping and conduit codes that is both accurate and yet not overly burdensome. As mentioned, the company codes did not incorporate unit rates, however, the estimating manuals do. Regression models using RSMeans and Richardson’s PPCES code structure and unit rates allowed for examining an optimal code structure based on their reported labor productivity data.
Multiple linear regression models allow for the description of a linear relationship of the formy = b0 + b1x1 + b2x2 +…+ bnxn
where y is the dependent variable (e.g. piping and conduit unit rates per the estimation manuals), x1 and x2 are explanatory variables (e.g. piping diameter and piping material), and b1 and b2 are estimates of the population regression coefficients (e.g. increase in unit rate per unit increase in pipe diameter) [18].
Model Selection
The dependent variable can be measured from this relationship based on all levels of the explanatory variables. A proposed master code of account is seeking to effectively identify productivity metrics from its code structure. Regression analysis outputs expected unit rates from various key descriptors (size, material, and installation location) of the materials. Diameter of the piping or conduit was chosen as a key descriptor due to the potential added effort of dealing with larger sized materials, thus impacting the unit rate. Material type was also used based on the fact that installation of metallic piping often involves welding or other method of connection that can increase the amount of time to complete the operation. Finally, whether workers are installing the material from an elevated work platform or at grade can greatly determine how fast the process can occur. Subsequently, installation location provides the final key descriptor studied.
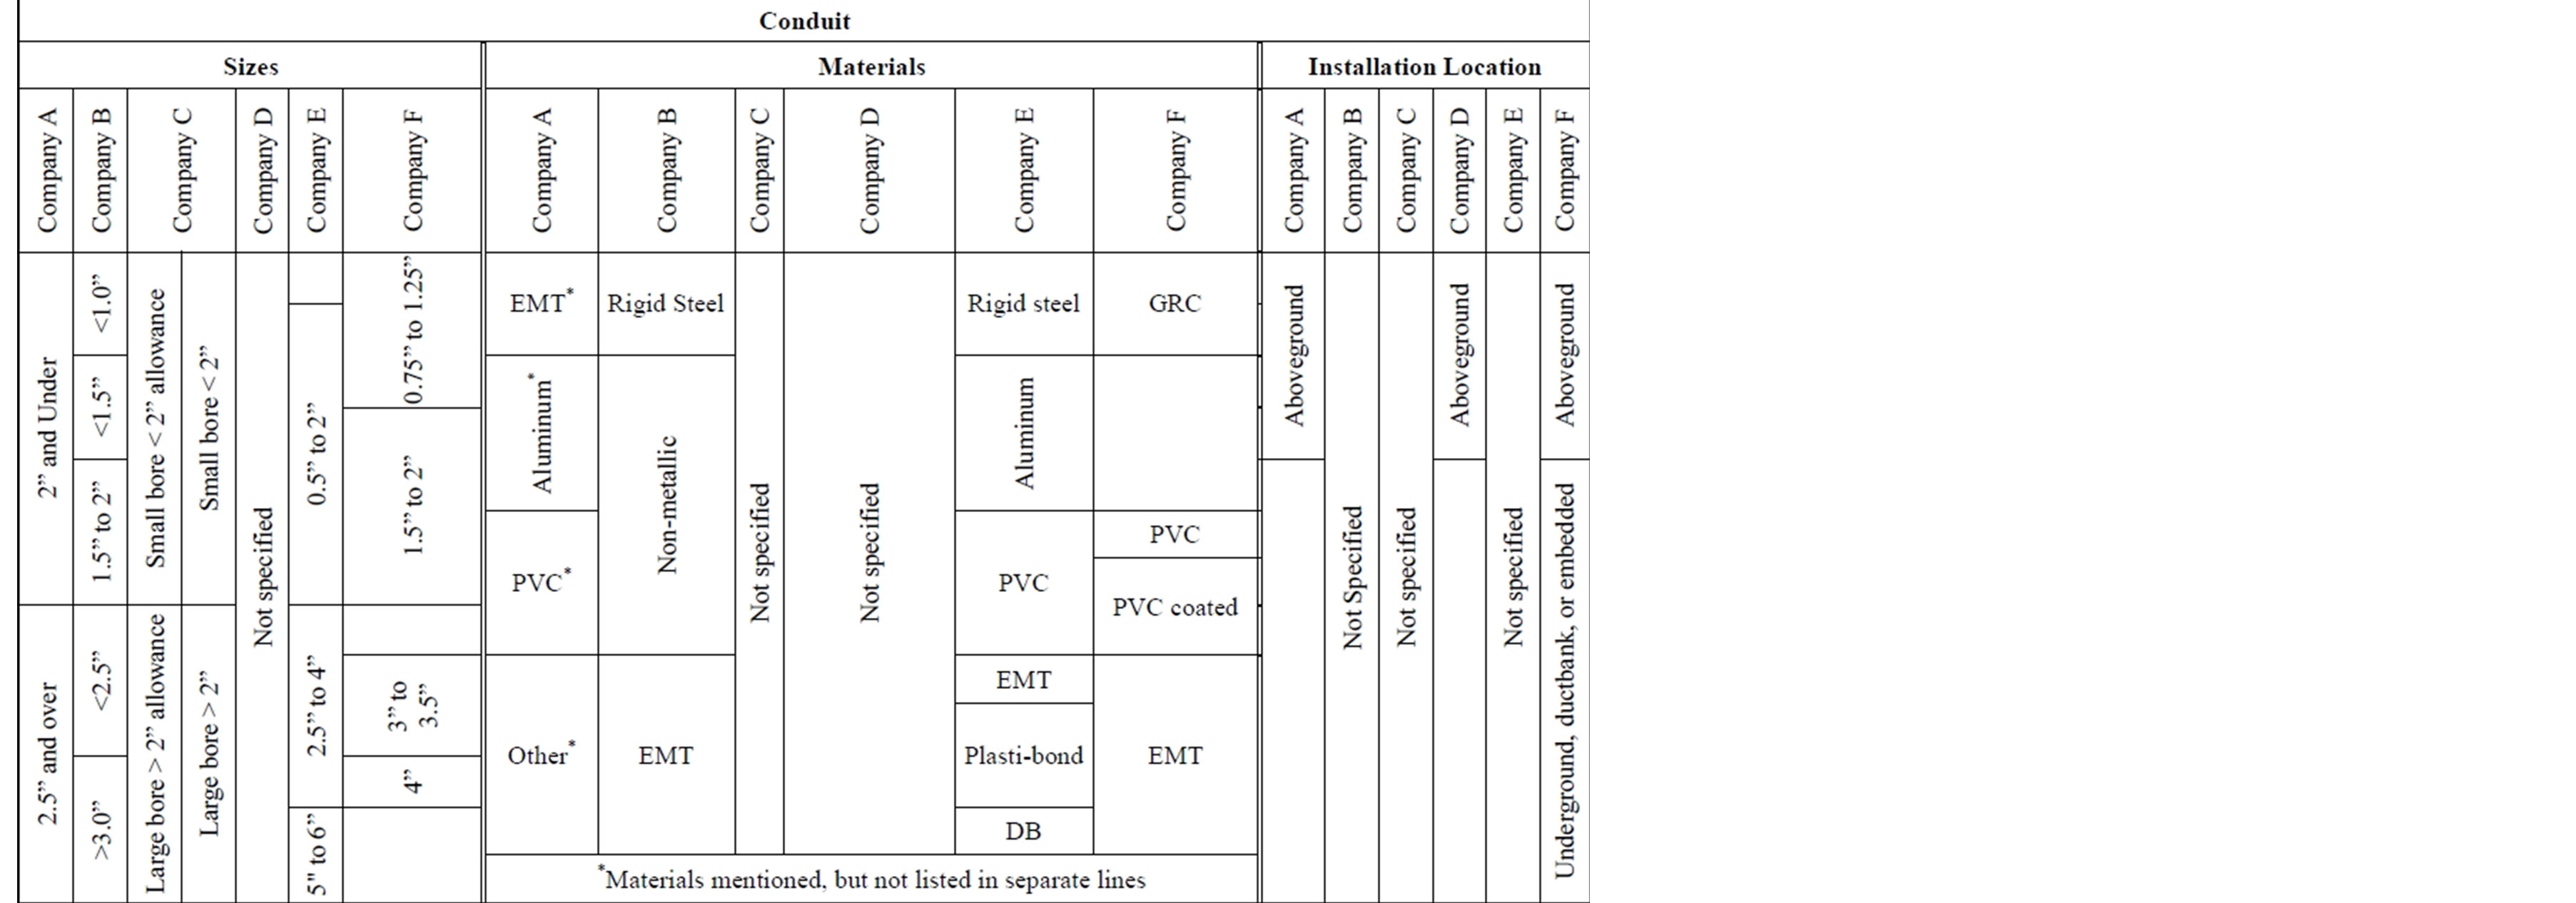
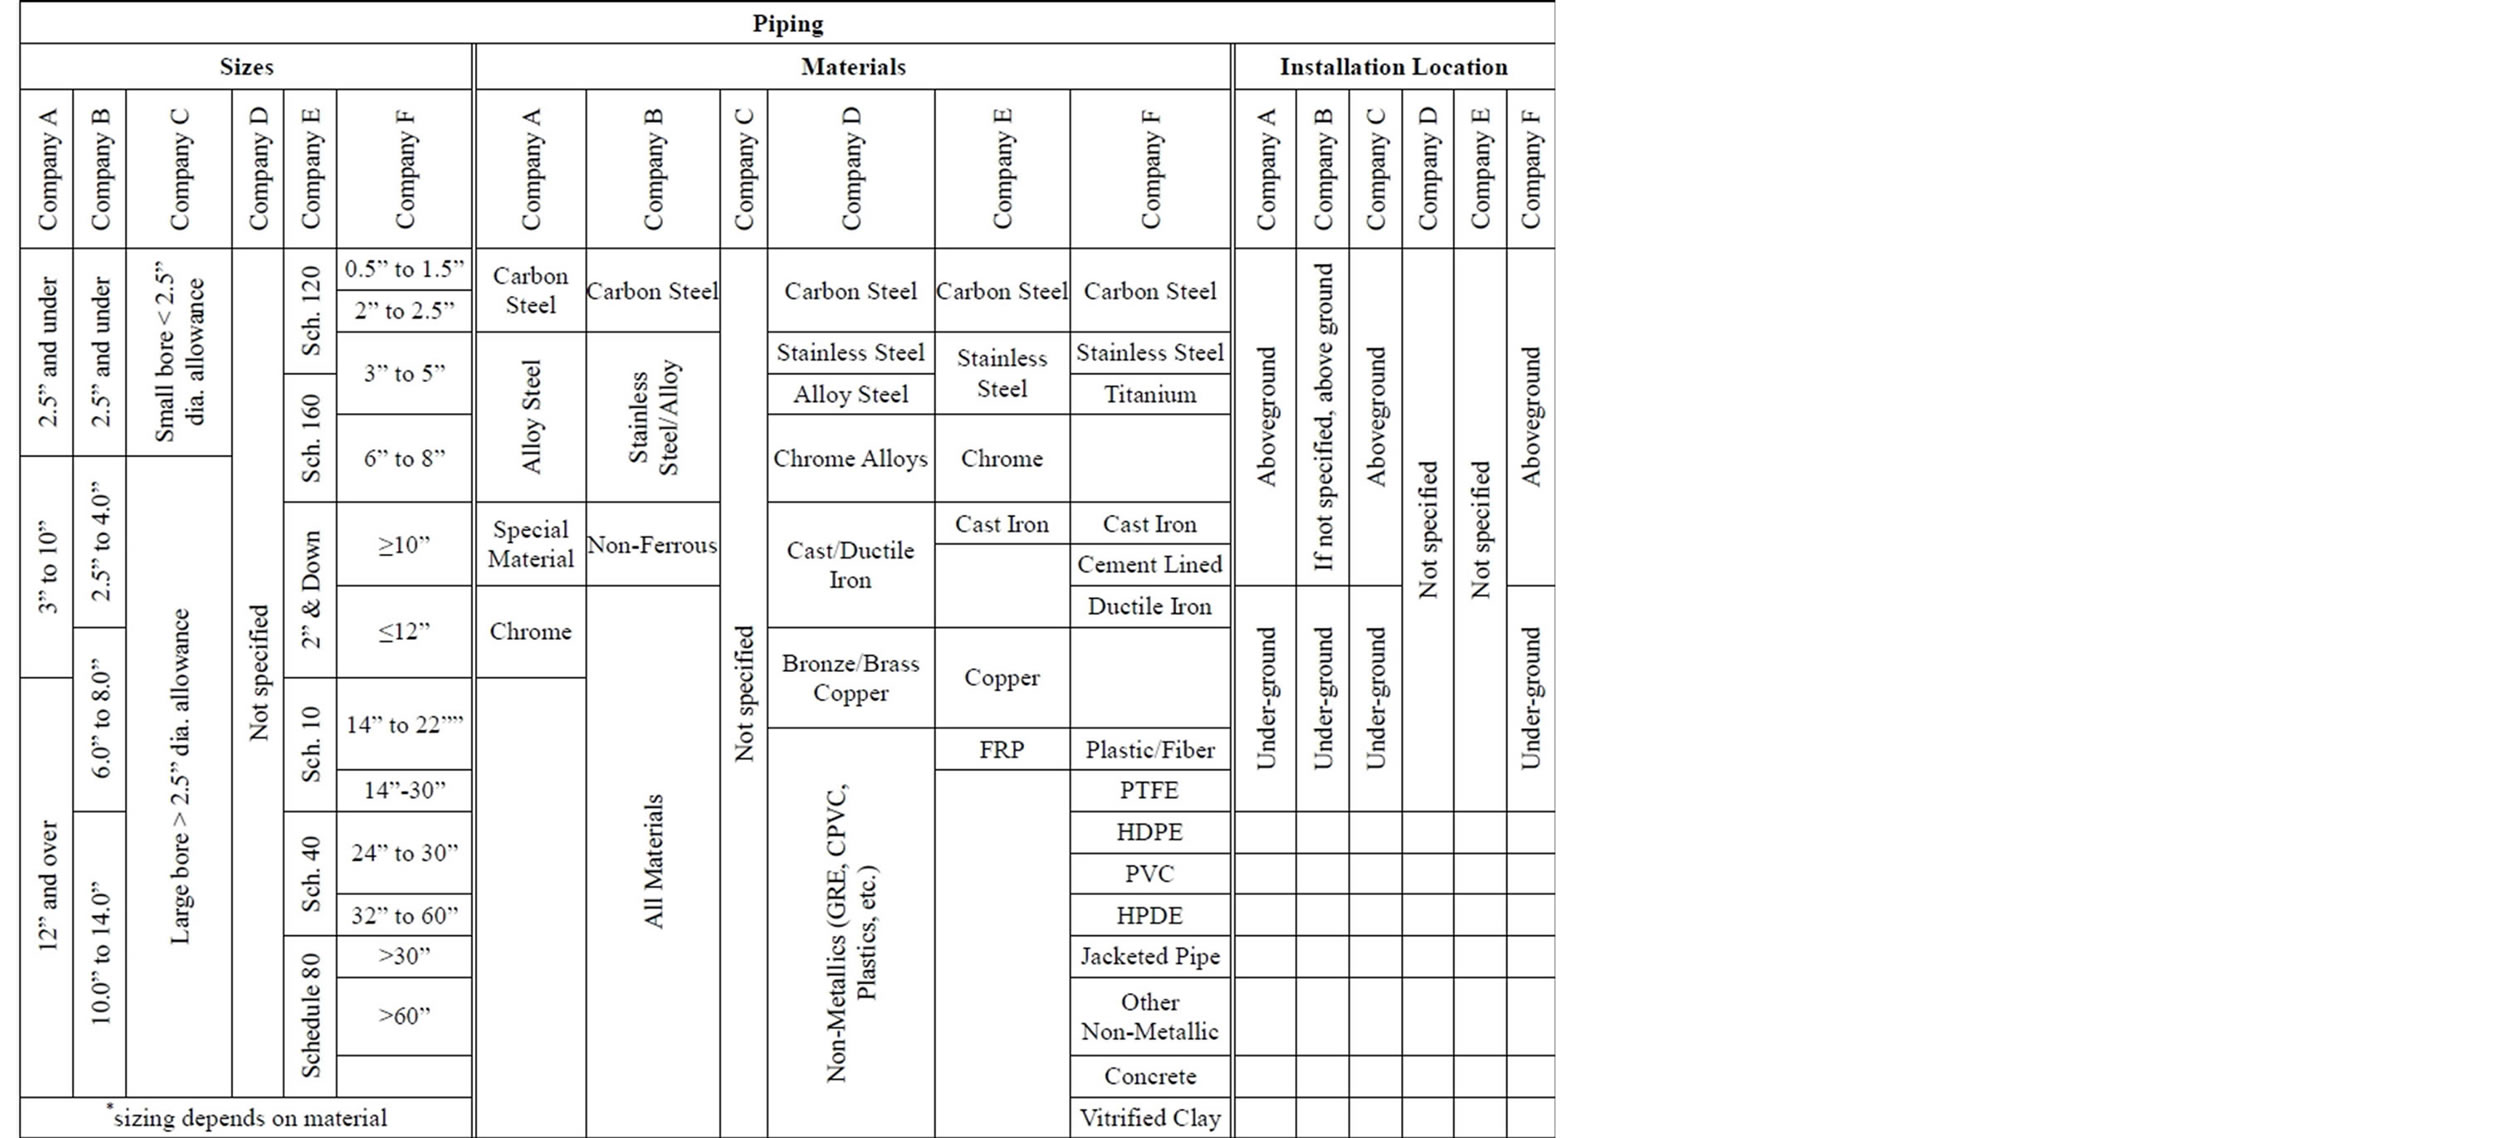
Table 3. Sampled master code of accounts.
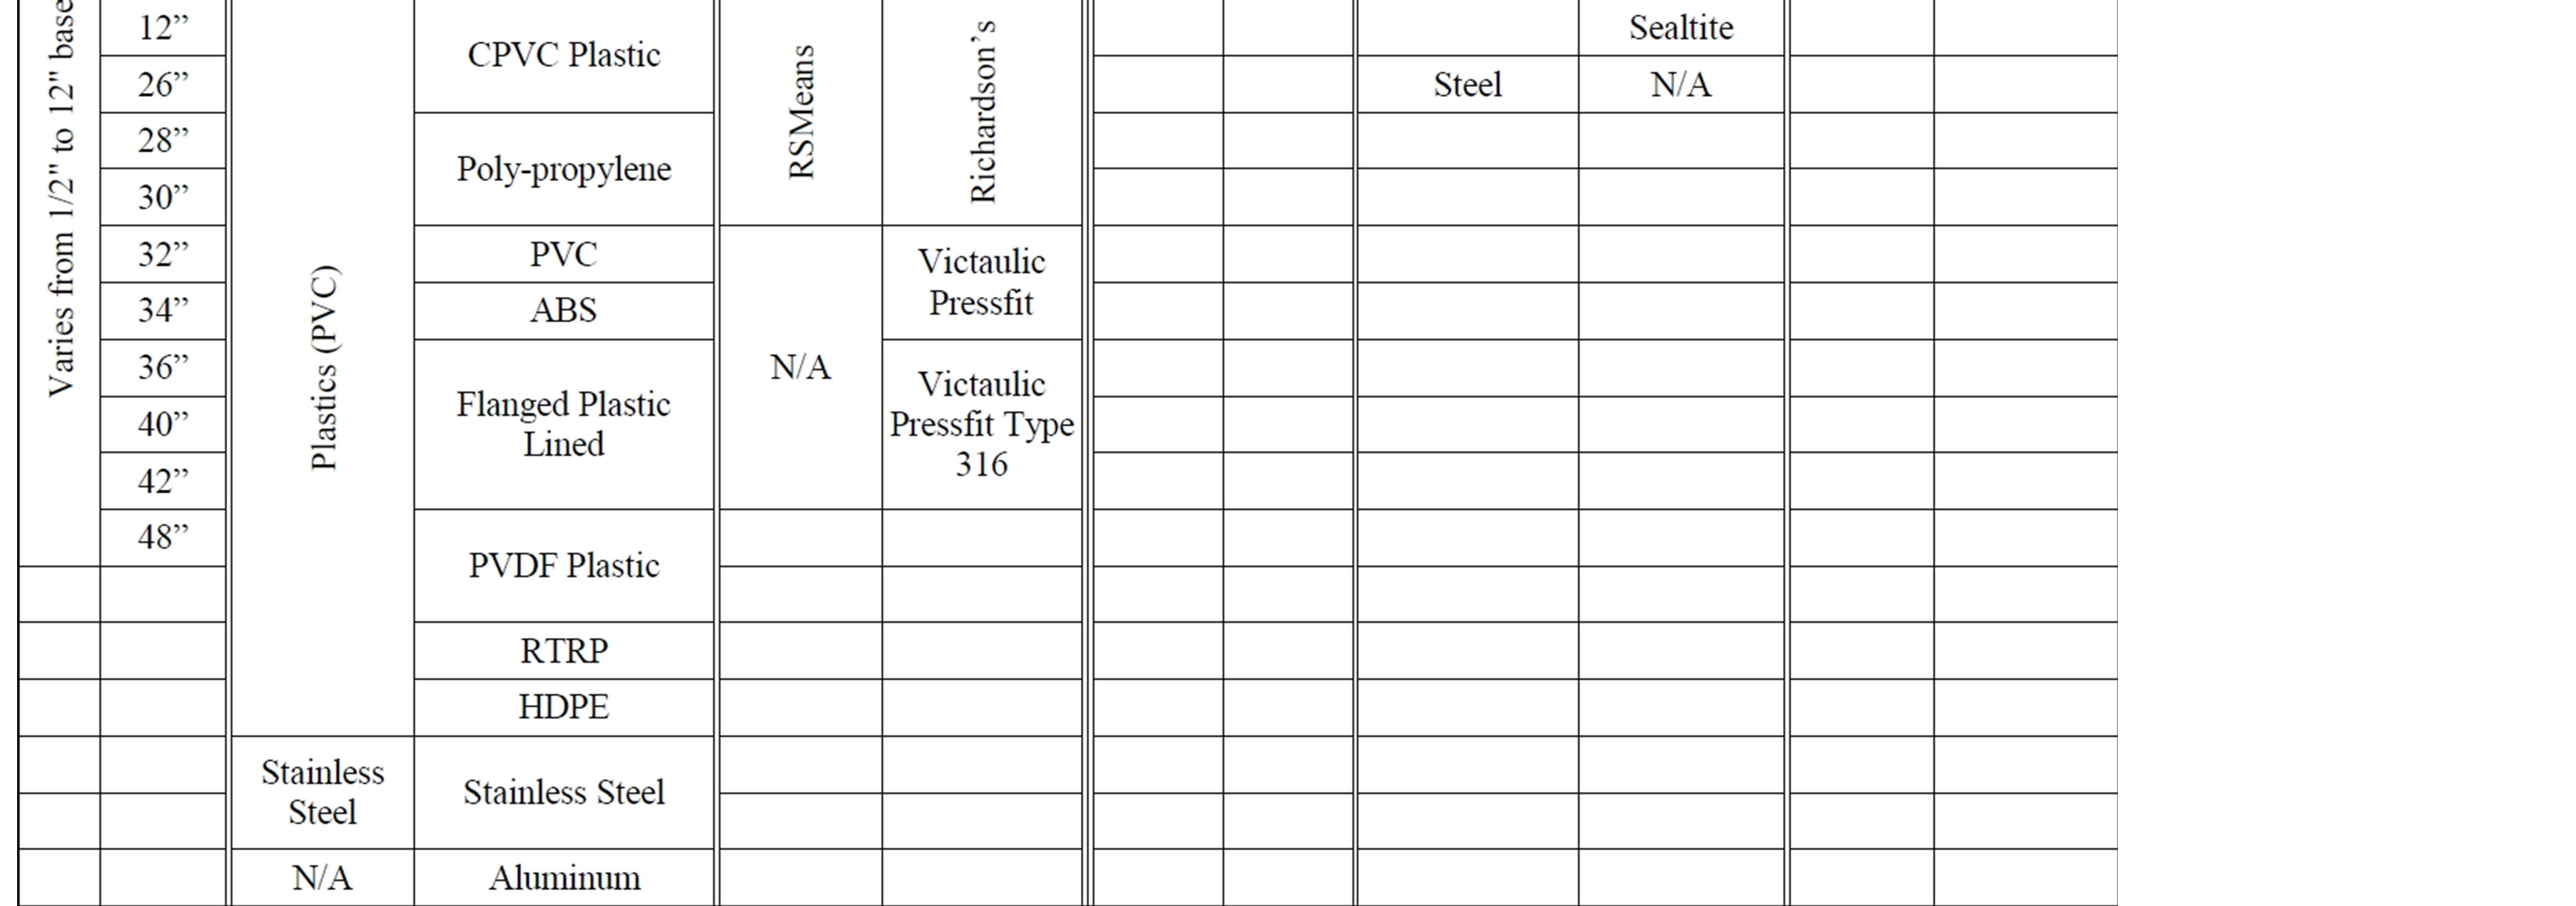
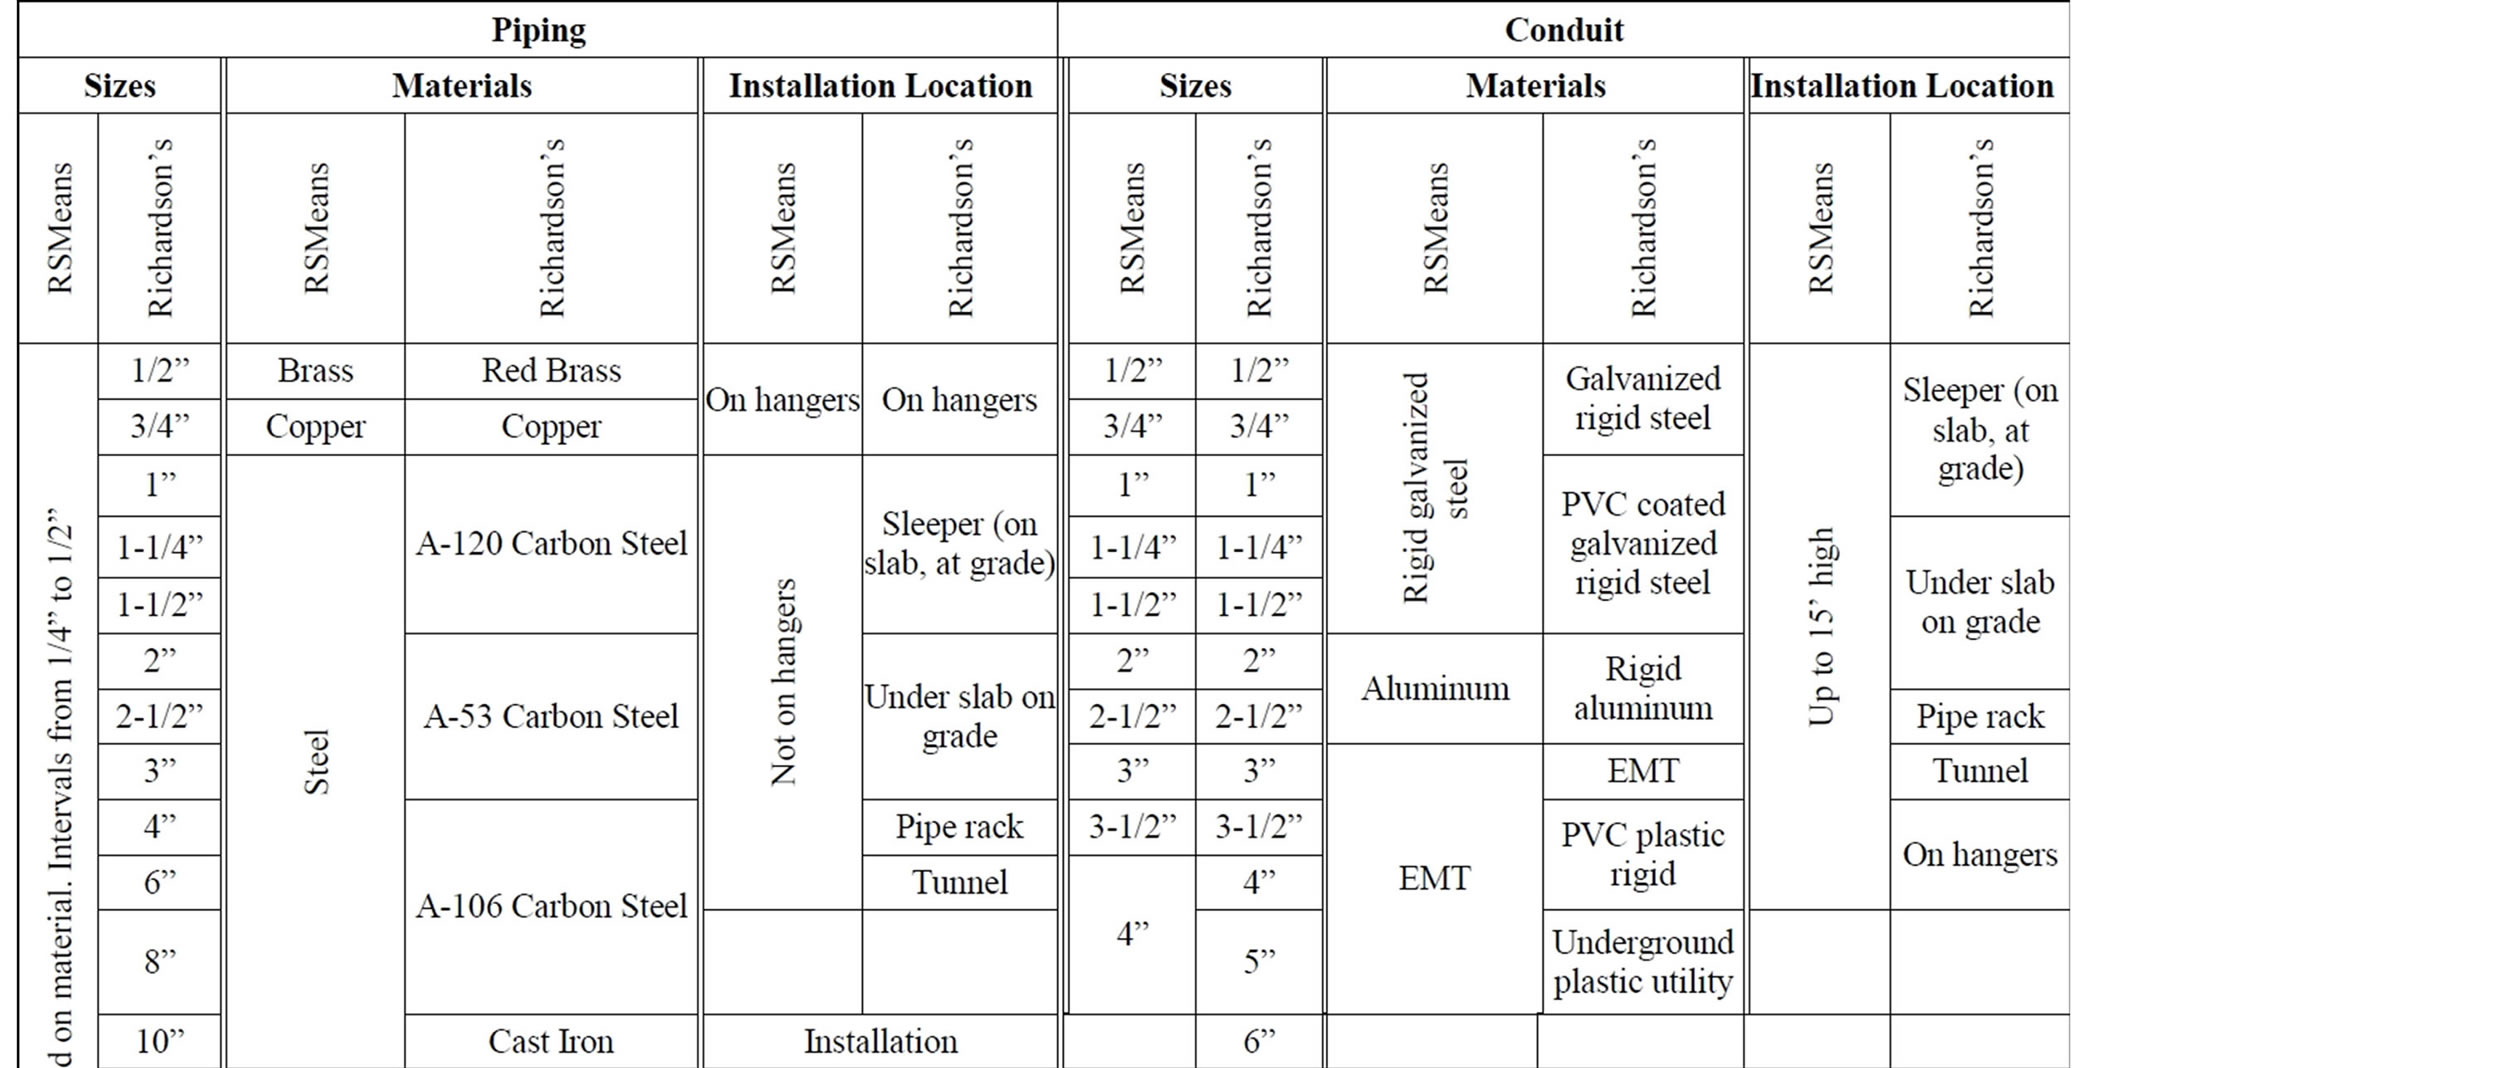
Table 4. Means and richardson codes of accounts.
Further, the regression models for piping and conduit were split into two models, one for RSMeans’ data and one for Richardson’s PPCES data. This was necessary as there were differences in unit rates for the same specified material. One potential cause of the difference between unit rates is in the sources used for the estimation manuals. RSMeans’s unit rates are established from supplied productivity data on general building construction from various contractors across the country. The data is compiled from surveys completed in large, regional construction markets across the United States. Richardson’s PPCES data is established from data on chemical plants, manufacturing facilities, solids processing, water treatment plants, and general construction projects, which are more piping intensive projects. Richardson’s data sources are subscribers to their estimation services, therefore, the data presented is representative among the manual’s participating companies.
3.2. Phase II Results
3.2.1. Sizing Regression Models
To identify the proper sizing interval, several models were tested for their significance. Based on the quantity of RSMeans and Richardson PPCES data, five models could be created based on diameter size interval. These models were:
1) All sizes;
2) 1” intervals (0” - 1”, 1” - 2”, 2” - 3”, and 3” - 4” for Means and Richardson data);
3) 2” intervals (0” - 2”, 2” - 4”, and 4” - 6” for Means, and 0” - 2”, 2” - 4”, …, up to 18” - 20” for Richardson data);
4) 4” intervals (0” - 4” and 4” - 8” for Means data and 0” - 4”, 4” - 8”…, up to 20” - 24” for Richardson data); and 5) 6” intervals (0” - 6” and 6” - 12” for Means data and 0” - 6”, 6” - 12”, 12” - 18”, and 18” - 24” for Richardson data).
Model B could not extend beyond the 3” to 4” diameter size, as both data sets skip to 2” intervals beyond the 4” diameter size. These models are referenced in the subsequent regression tables by their letter. Table 5 highlights the results for the RSMean’s mechanical piping size models, while Table 6 details the outcomes from the Richardson’s PPCES data.
The RSMeans’ results show that diameter size is significant in explaining unit rates up to a 2” interval. However, Richardson’s PPCES data is significant at all intervals tested, likely due to the larger sample size.
The R2 value describes the amount of variability in the unit rate that is described by the data from various diameter sizes. It represents the goodness of fit of the regression model. The R2 values for both RSMeans’ and Richardson’s PPCES data tend to decrease as the sizing intervals increase. This is to be expected as bundling of material decreases the amount of data available, which
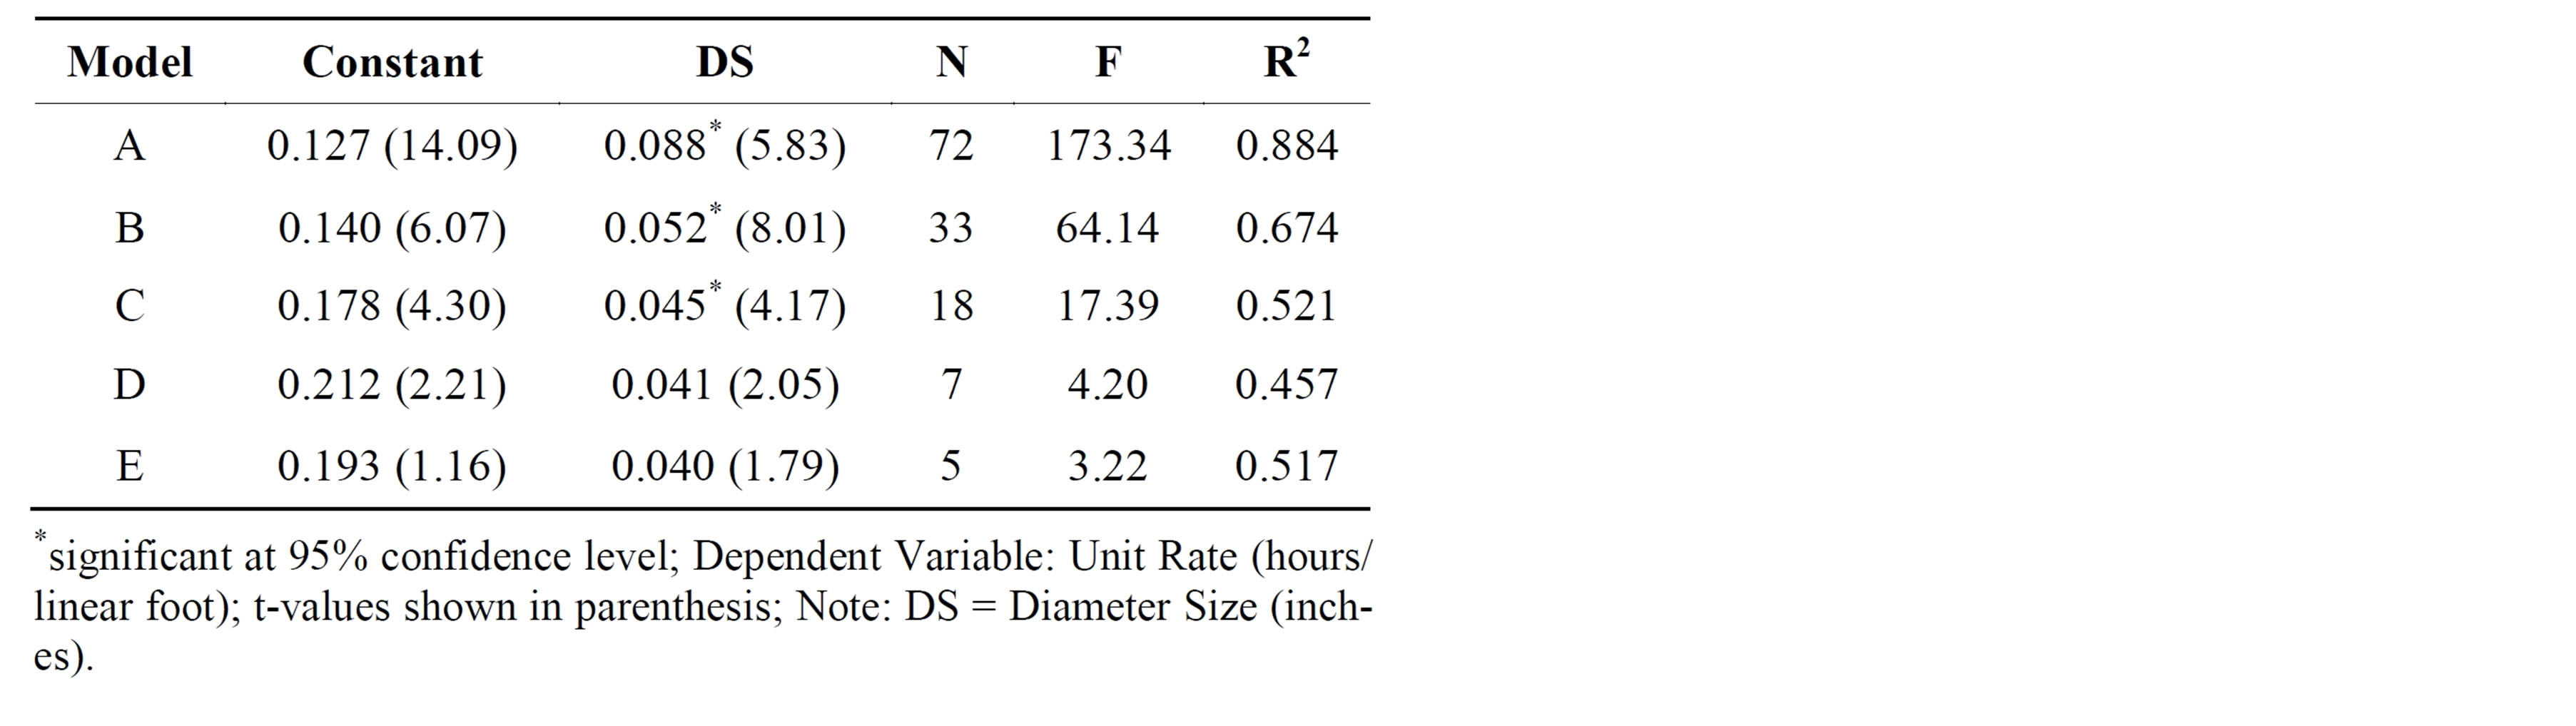
Table 5. RSMean’s mechanical piping size regression findings.
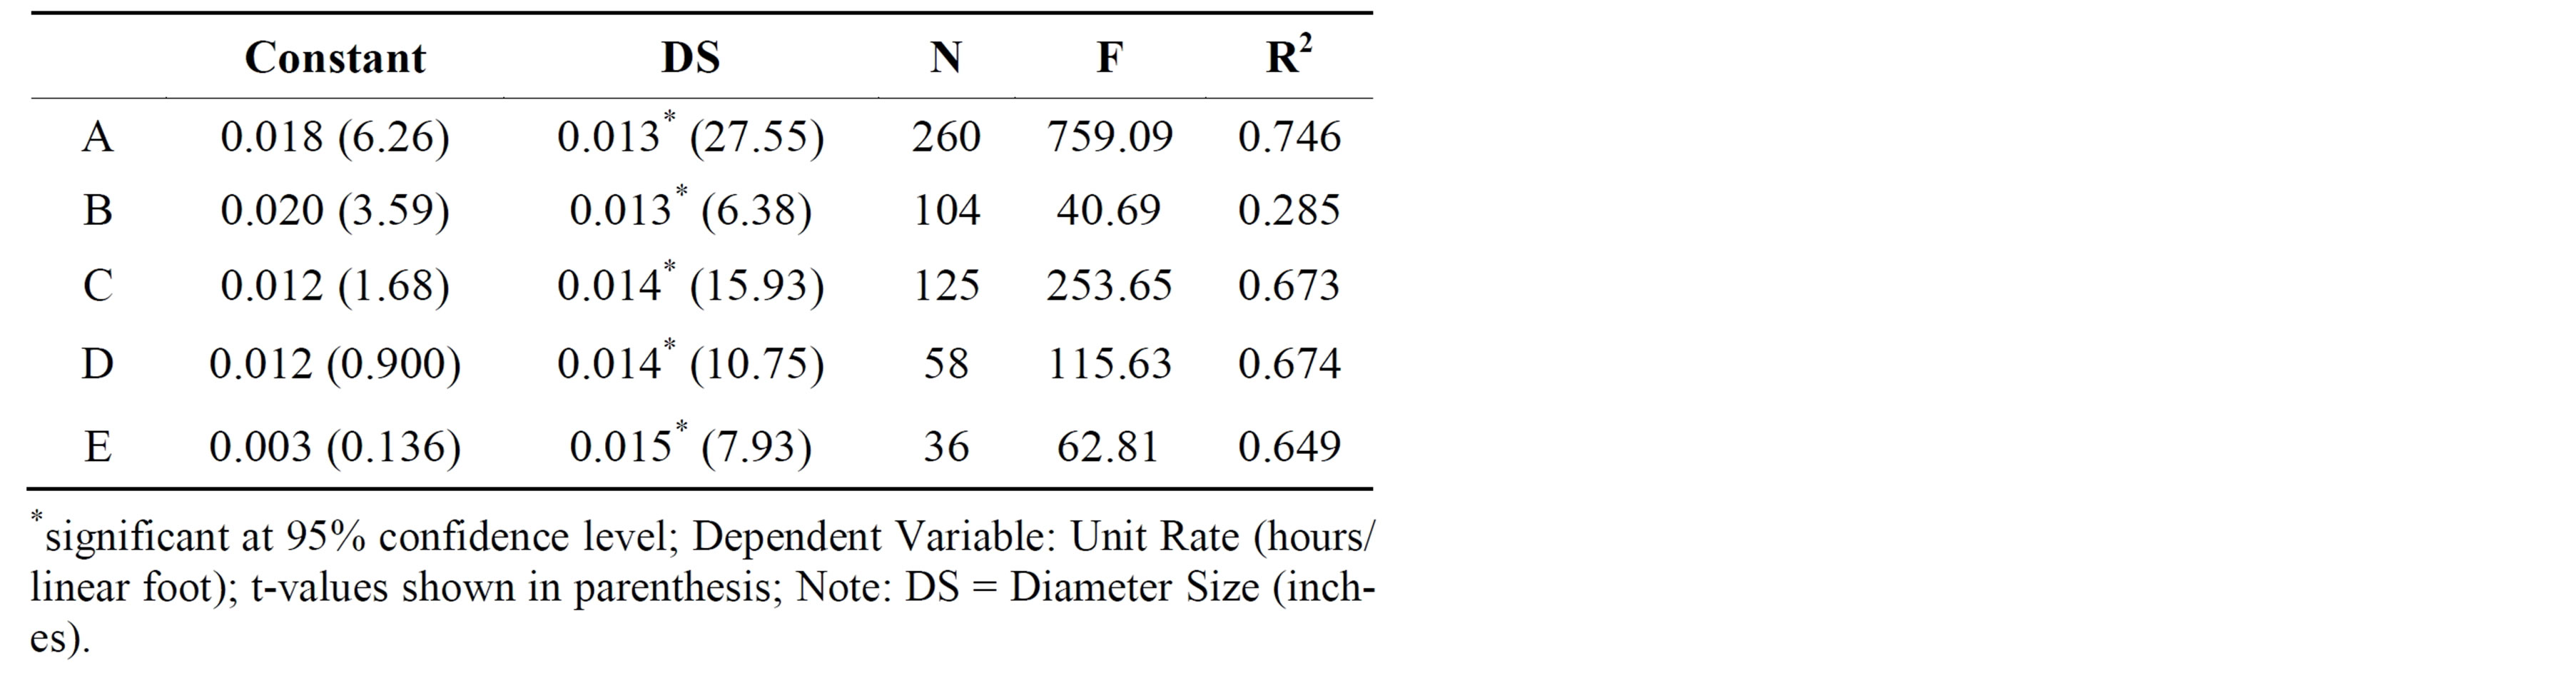
Table 6. Richardson’s PPCES mechanical piping size regression findings.
has more difficulty explaining the resulting variances.
Data on electric conduit diameter size was fewer in both number and diameter. There was no data to report on 4” or 6” intervals, therefore only three regression models could be created. Model A contains all sizes, Model B has 1” interval spacing, and Model C has 2” interval spacing. Tables 7 and 8 show the results of the regressions for RSMeans and Richardson’s PPCES data, respectively.
Both data sources have significance in their independent variable through all conduit interval sizes. In all cases, utilizing larger intervals did not better explain the variance in unit rates as shown by the diminishing R2 values. Interestingly, conduit size had less influence on conduit unit rates versus pipe size on piping unit rates as shown by the relatively smaller R2 values.
3.2.2. Material Type Regression Models
Similar methods were used to determine the best coding structure for material type. Previously discussed Table 4 shows all of the material types that are detailed within the Means and Richardson data sources. Unfortunately, the Means data sources yielded regression models with too few sample sizes to present reliable results. As a result, only Richardson data sources were used. Regression models were created using each individual material type for both piping and conduit. However, it was found that few individual material types were significantly impacted unit rates. In addition, the R2 values were very low. As a result, the material types were categorized as either metallic or non-metallic and added to the existing diameter size models detailed previously. Significance in the independent material type variable improved, as well as the R2 values for all models. Dummy variables (0 for non-
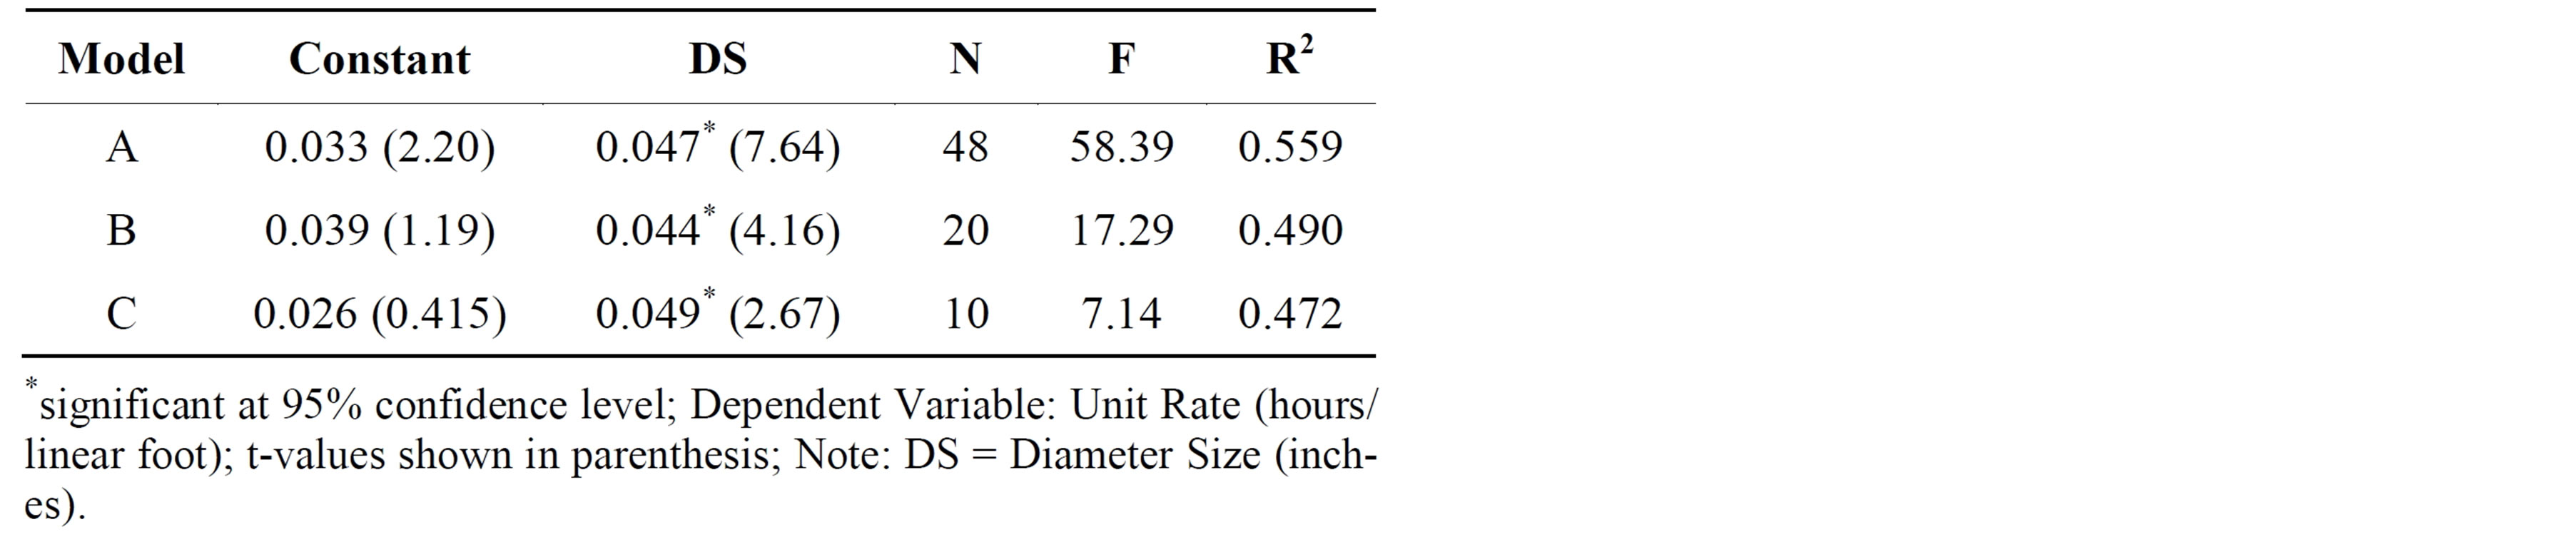
Table 7. RSMeans electrical conduit size regression findings.
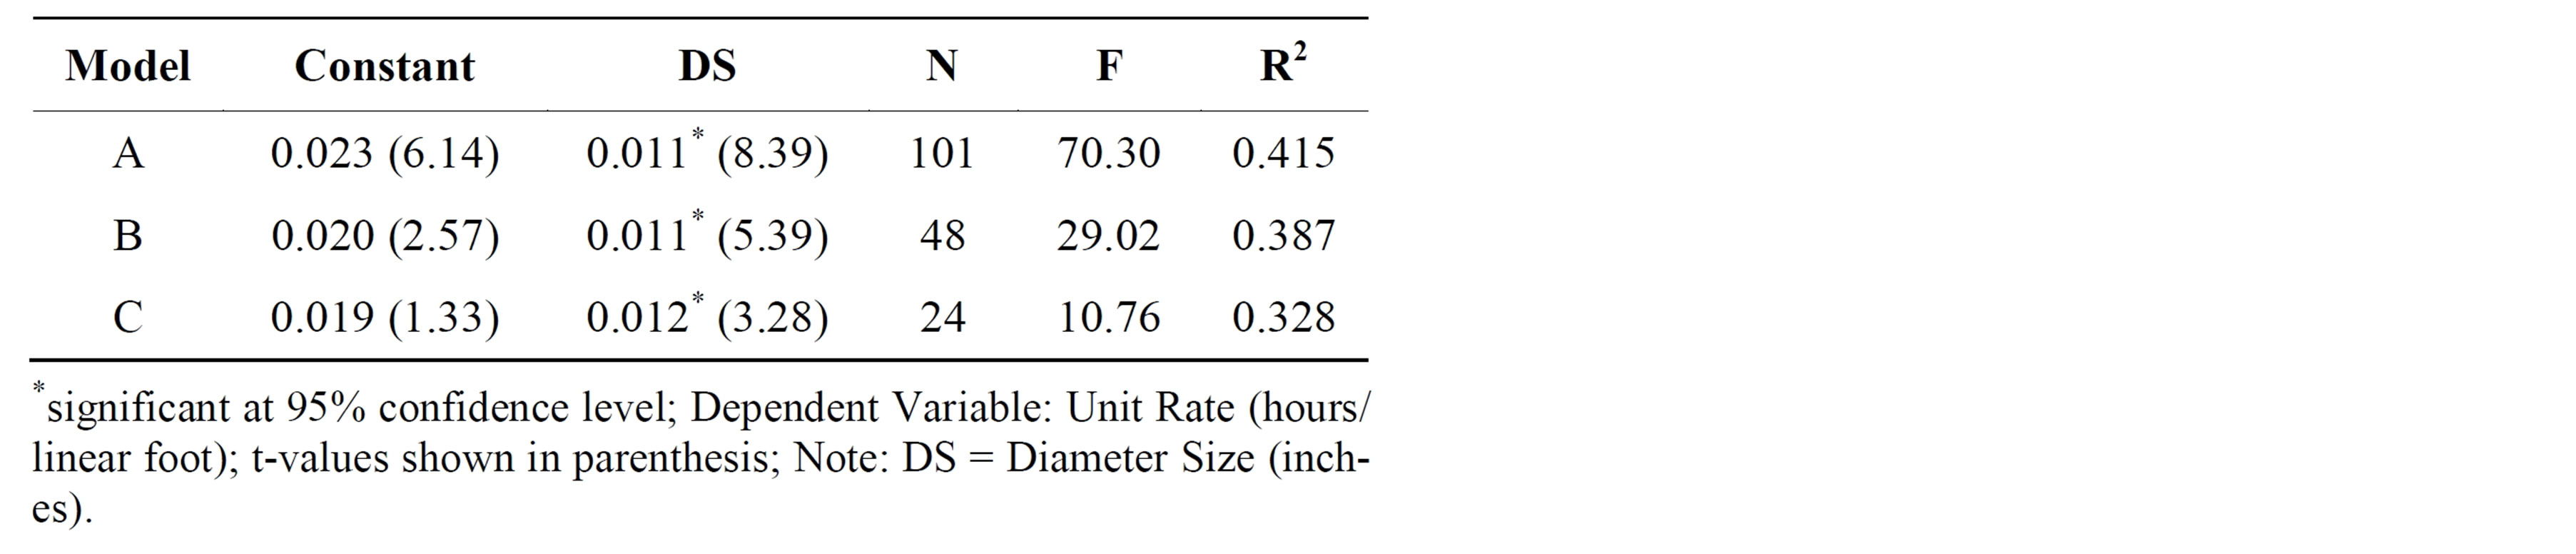
Table 8. Richardson’s PPCES electrical conduit size regression findings.
metallic and 1 for metallic) were used to replace the nominal variables. Tables 9 and 10 highlight the output from the regressions.
The material type variable is significant in the Richardson’s PPCES dataset in all models for piping and in model A for conduit. By adding material type to the regression models, the R2 values all marginally increase for both mechanical piping and electrical conduit. Material type (nonmetallic or metallic) helps explain more of the variance within the unit rate productivity. Therefore, tracking material type would be a beneficial practice in a master code of accounts.
3.2.3. Installation Location Regression Models
The last key descriptor is the location of installation for mechanical piping and electrical conduit. Unfortunately, only Richardson’s PPCES publishes unit rate data based on whether the mechanical piping or electrical conduit is installed above or at/below grade. Therefore, there is no data to report from RSMeans. As previously noted, models are reported based on the following information:
1) All sizes;
2) 1” intervals (0” - 1”, 1” - 2”, 2” - 3”, and 3” - 4”);
3) 2” intervals (0” - 2”, 2”-4”, …, up to 18” - 20”);
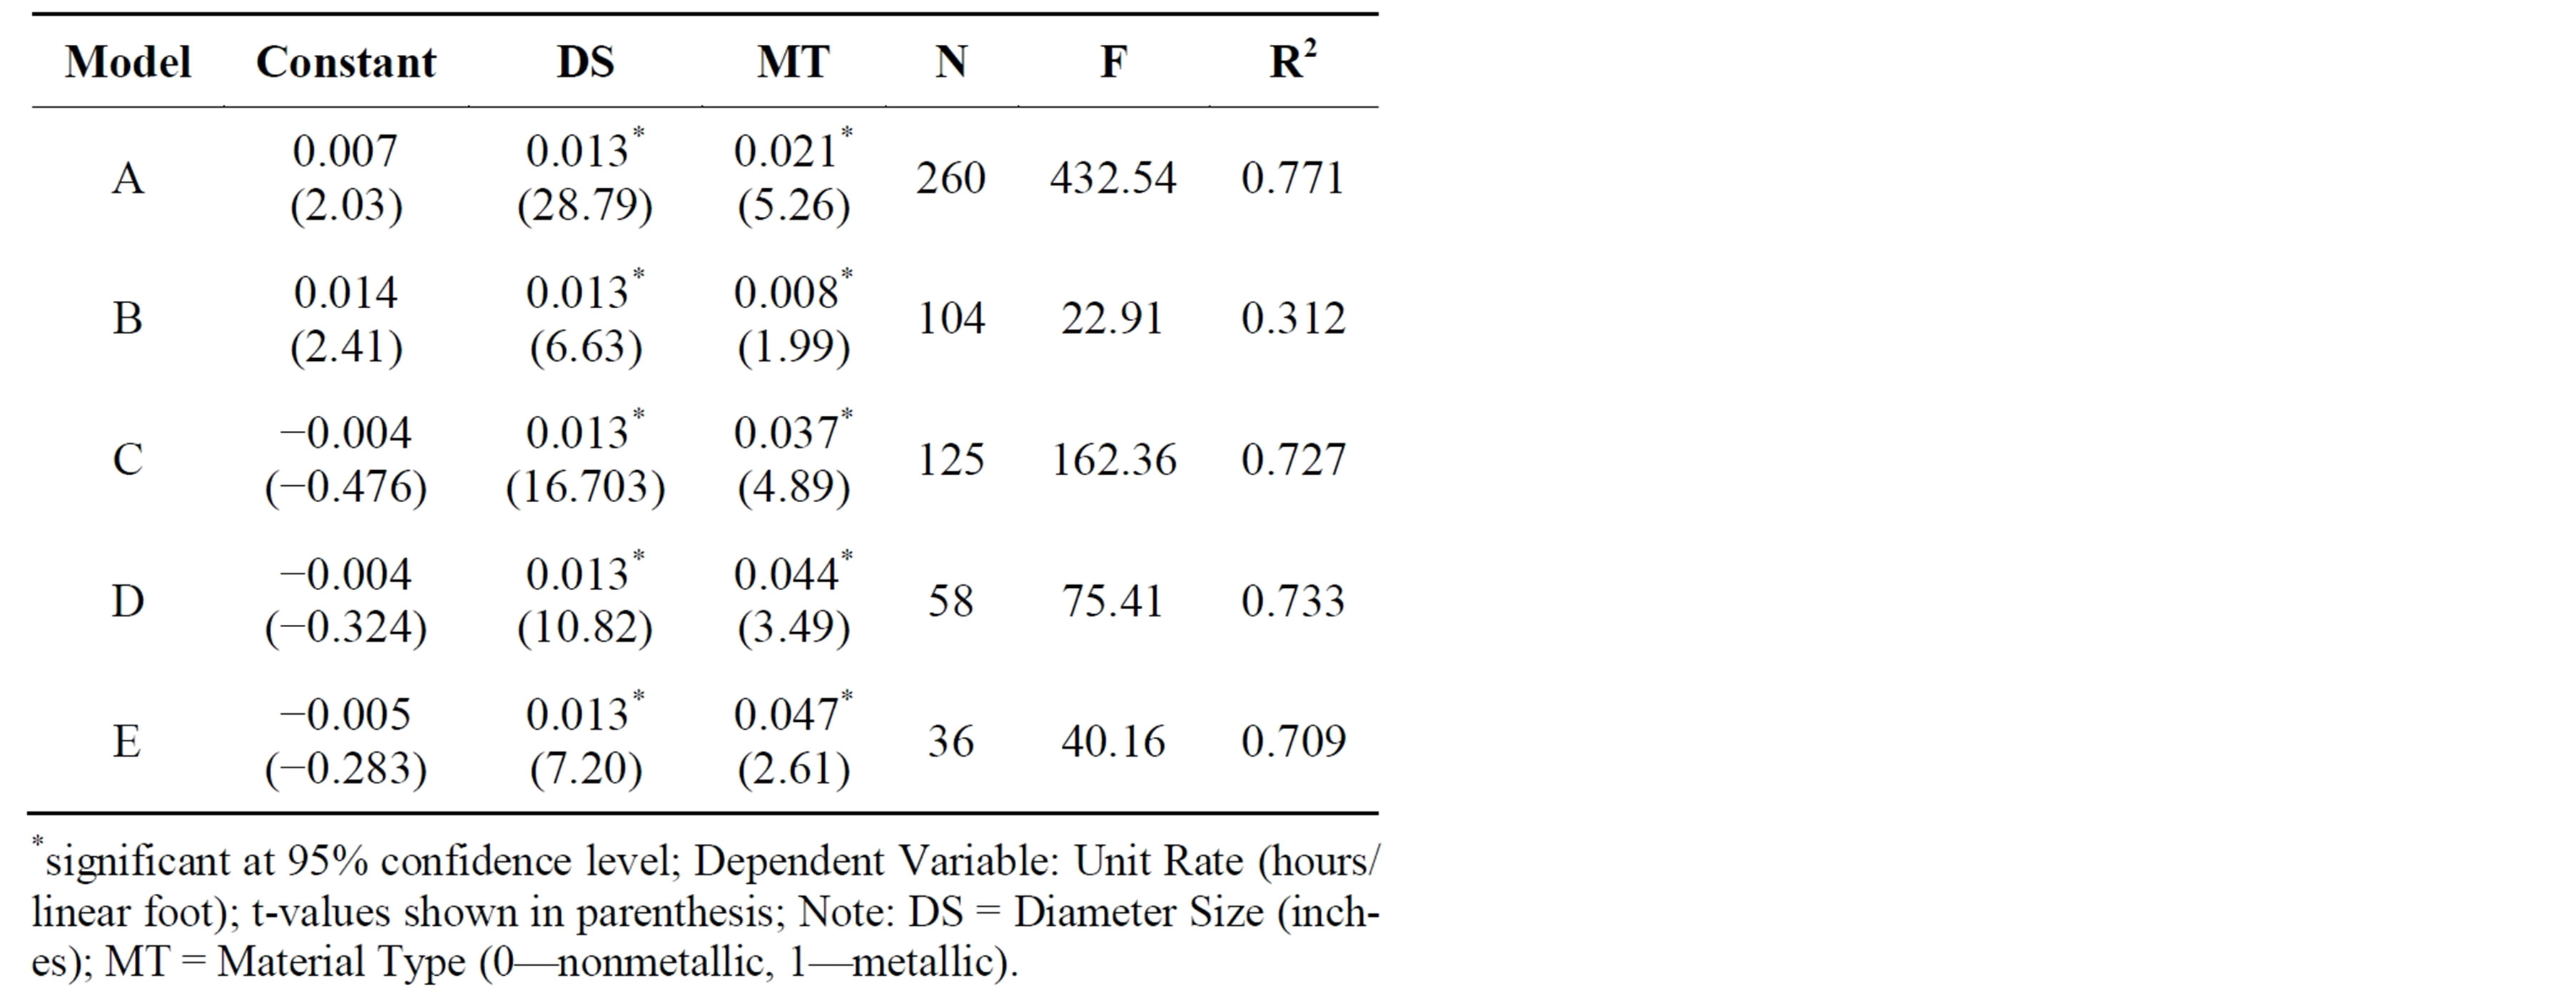
Table 9. Richardson’s PPCES mechanical piping material regression findings.
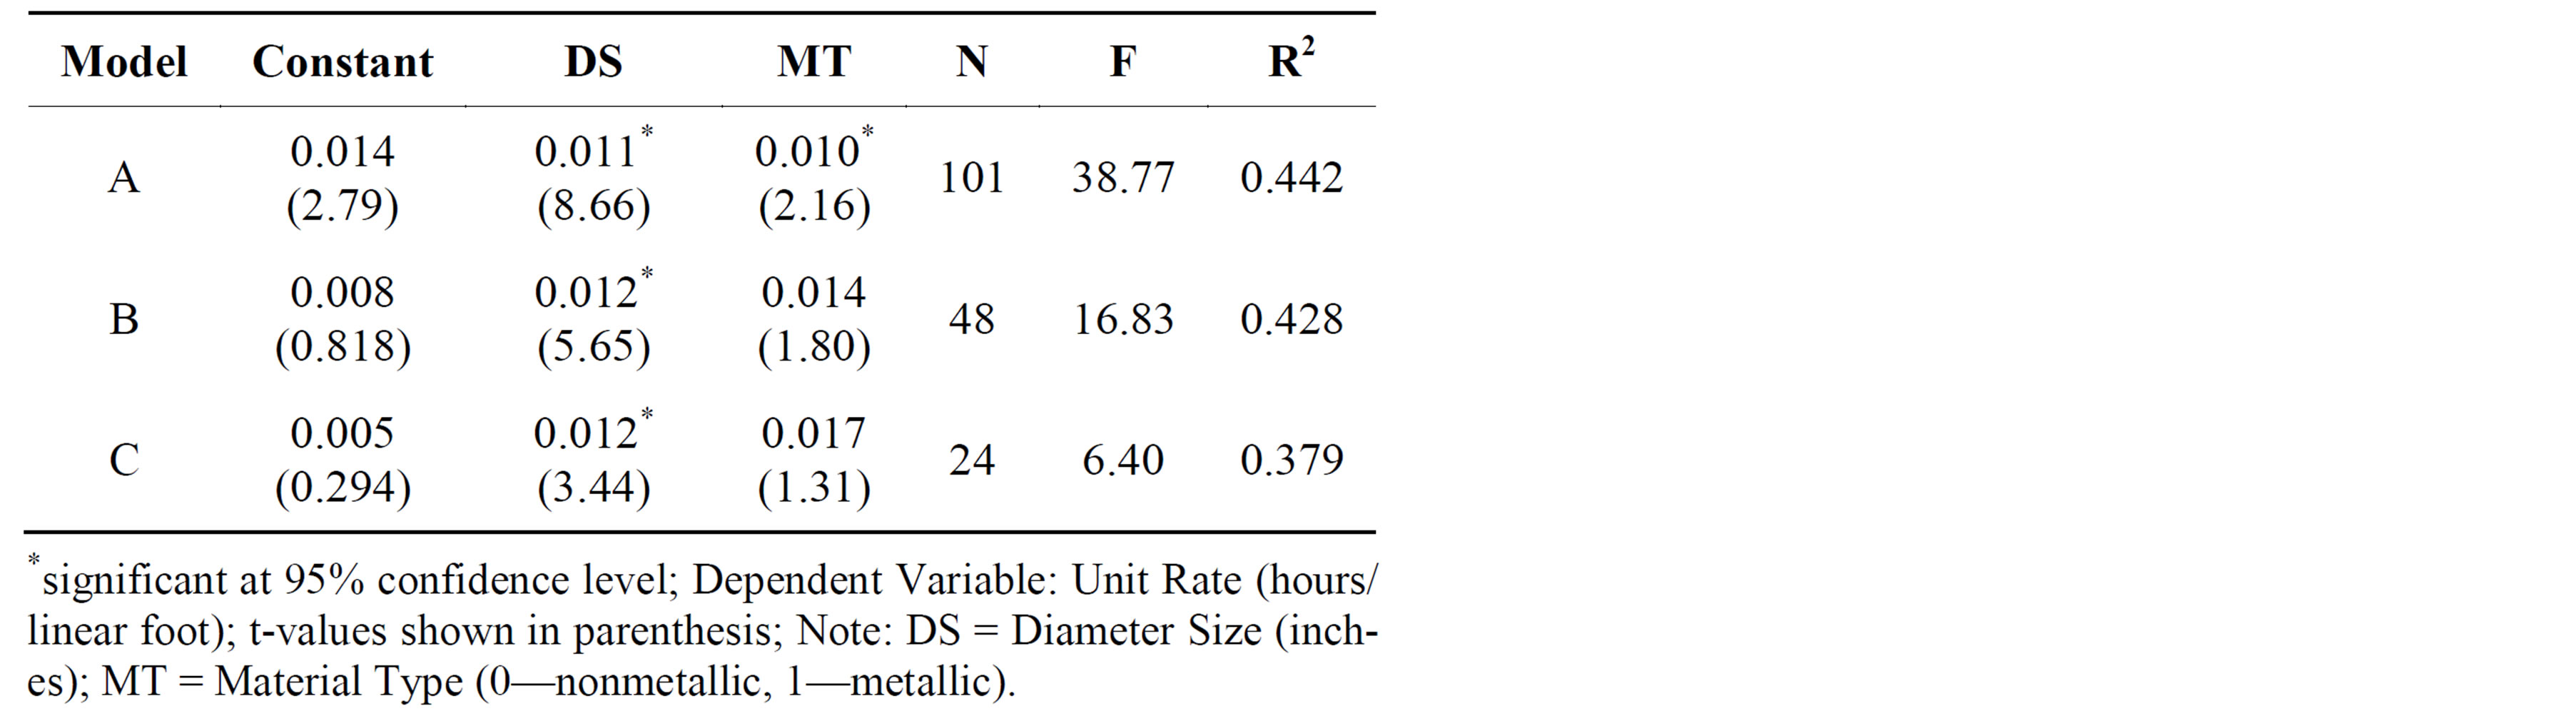
Table 10. Richardson’s PPCES electrical conduit material regression findings.
4) 4” intervals (0” - 4”, 4” - 8”, …, up to 20” - 24”);
5) 6” intervals (0” - 6”, 6” - 12”, 12” - 18”, and 18” - 24”).
The results are reported in Tables 11 and 12.
In the previous material type iteration, few of the variables were significant at the 95% confidence level. However by adding diameter size, material type, and installation location, all variables in every model become significant. This validates the selection of the three key properties used in a master code of accounts.
In addition, R2 values are significantly improved by adding the installation location variable. By including only the diameter size or material type, the R2 is low in certain models. In particular, the 1” interval piping model for Richardson’s PPCES is 0.285, but increases to 0.847 in the model including all three variables. In all models studied, the R2 values are greater than 0.84.
4. Proposed Master Accounting Code
With the above analysis, a proposed master accounting code can be determined by comparing the accuracy of the existing company codes (Tables 3 and 4) to the proposed codes as described above. Since diameter size intervals were significant up to 4” in all the regression models, a smaller interval would be desirable. In investigating the reporting of the individual companies from Phase I, many company codes use 2.5” as a cut off for their intervals, which is typically used to distinguish between small-bore and large-bore piping. This well aligns with the results from Phase II, therefore, the authors examined the possibility of tracking diameter sizes in two main categories as done by Company C (Tables 3 and 4); less than or equal to 2.5” and greater than 2.5”, while keeping the coding for material and location the same (Tables 13 and 14).
While both full models from Tables 13 and 14 result in statistically significant findings explaining over 50% total variability in the their respective unit rates, neither model explained as much variability in comparison to similar models in Tables 11 and 12. Recognizing that not every company grouped all piping and conduit sizes over 2.5” together, the next regression equations grouped the sizes over 2.5” in the same manner as done by companies A and B seen in Tables 15-18.
Once again, the coding structures utilized by both Companies A and B produced significant results, but neither model explained as much variability in the unit rates compared to similar equations in Tables 11 and 12, although Company B’s code structure did very well, which is explained by the fact that their code structure is the most detailed among all of the sampled companies. A point to be considered among the code structures is the balance between accuracy, which in this case is measured by the regression results, and ease of use, which is meas-
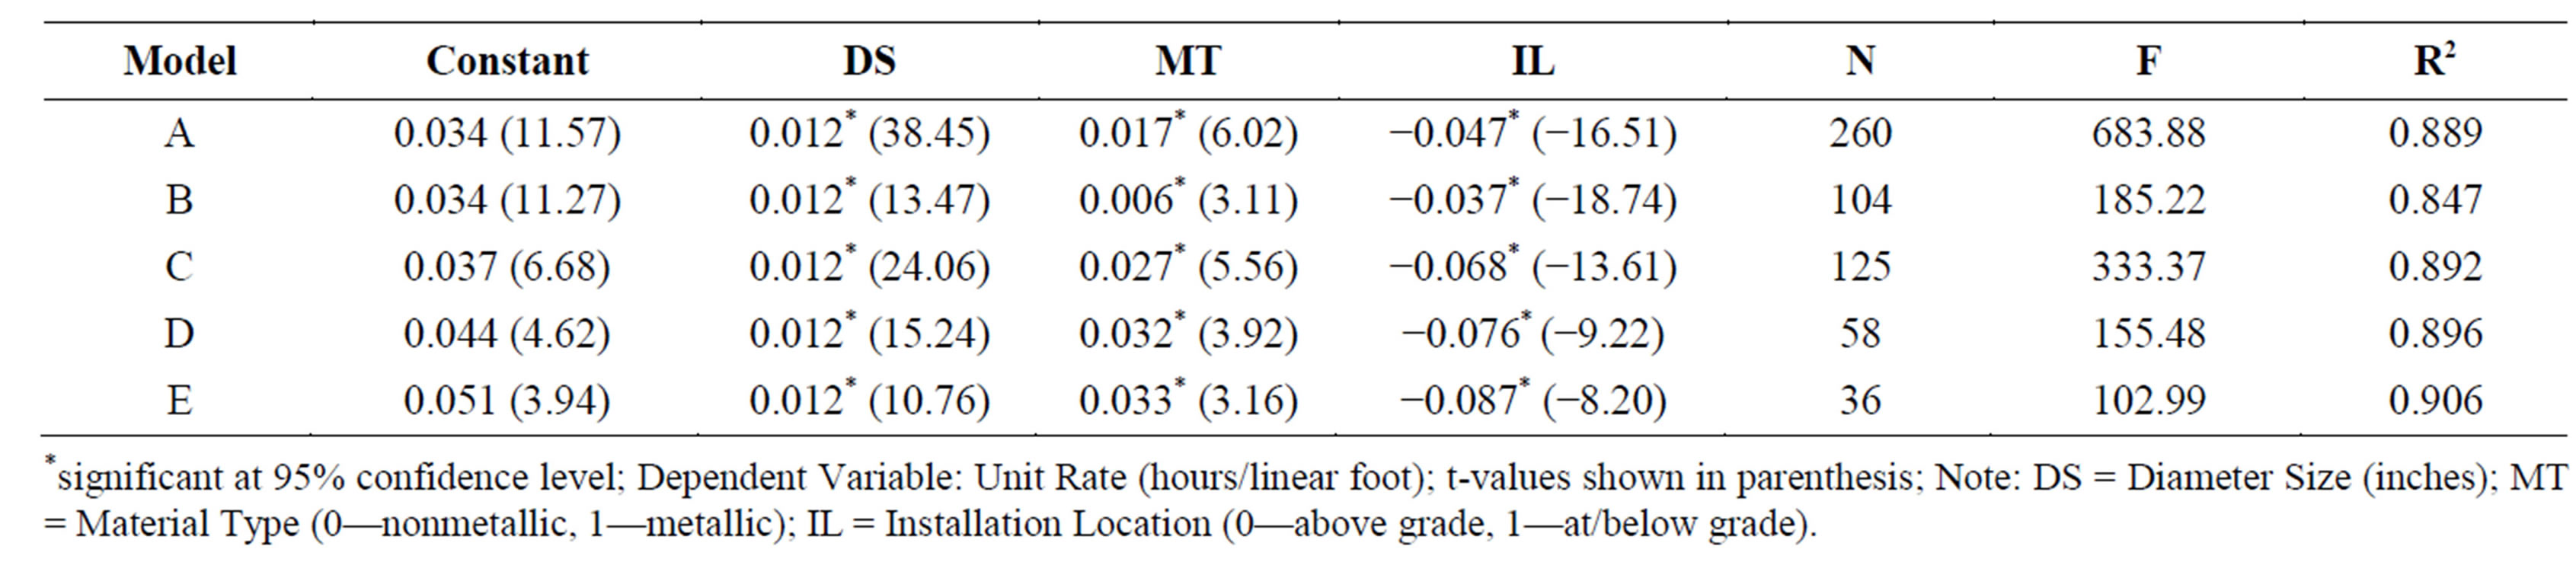
Table 11. Richardson’s PPCES mechanical piping location regression findings.
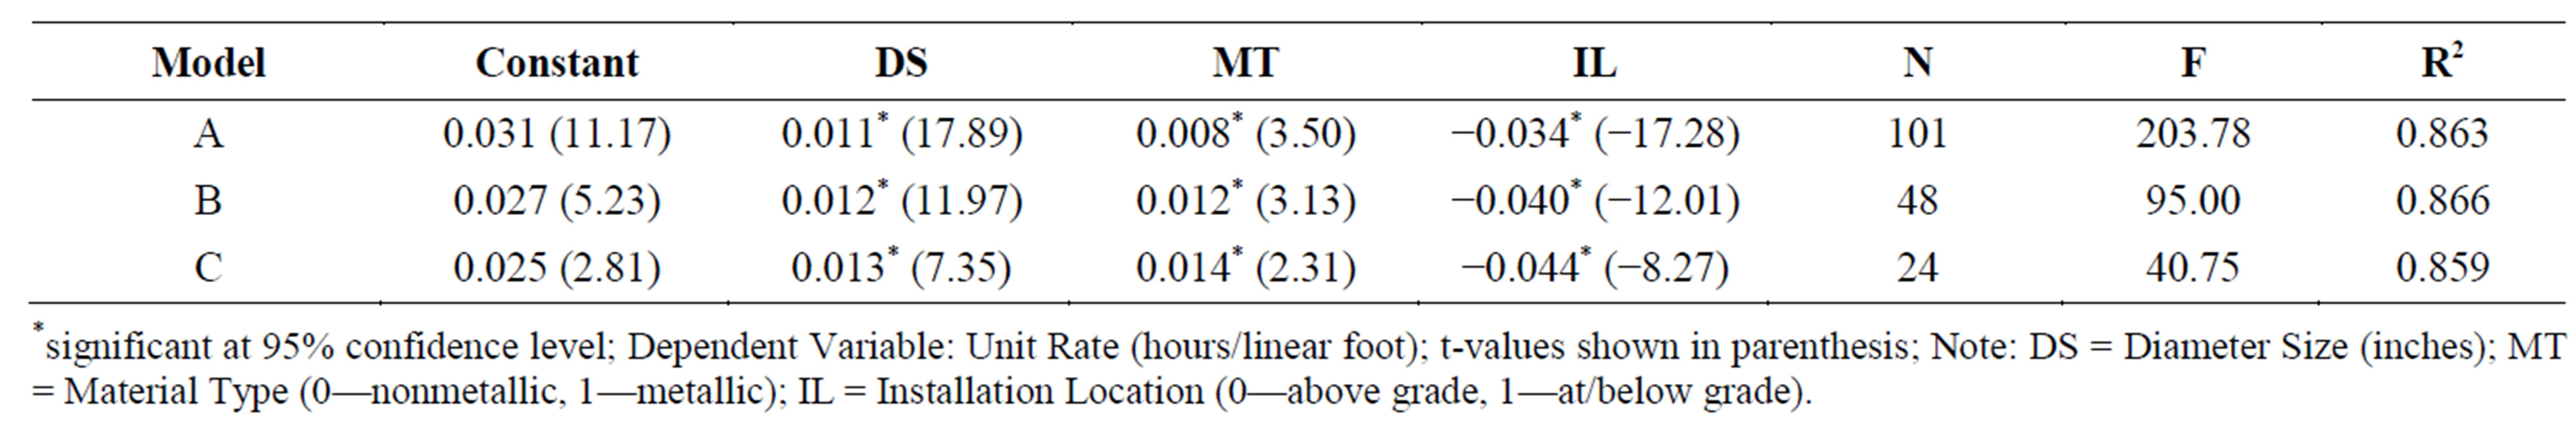
Table 12. Richardson’s PPCES electrical conduit location regression findings.
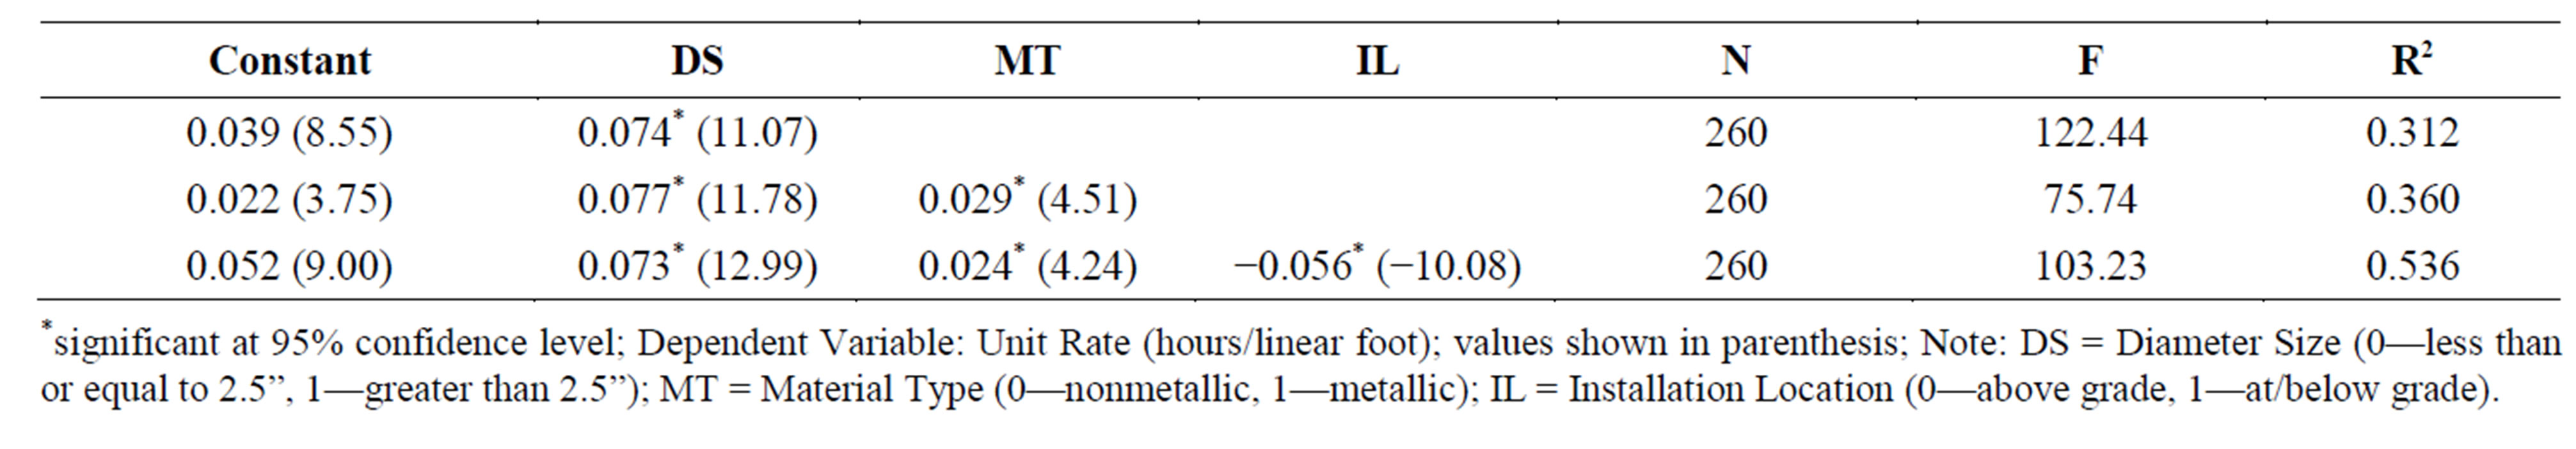
Table 13. Company C piping code regression findings.
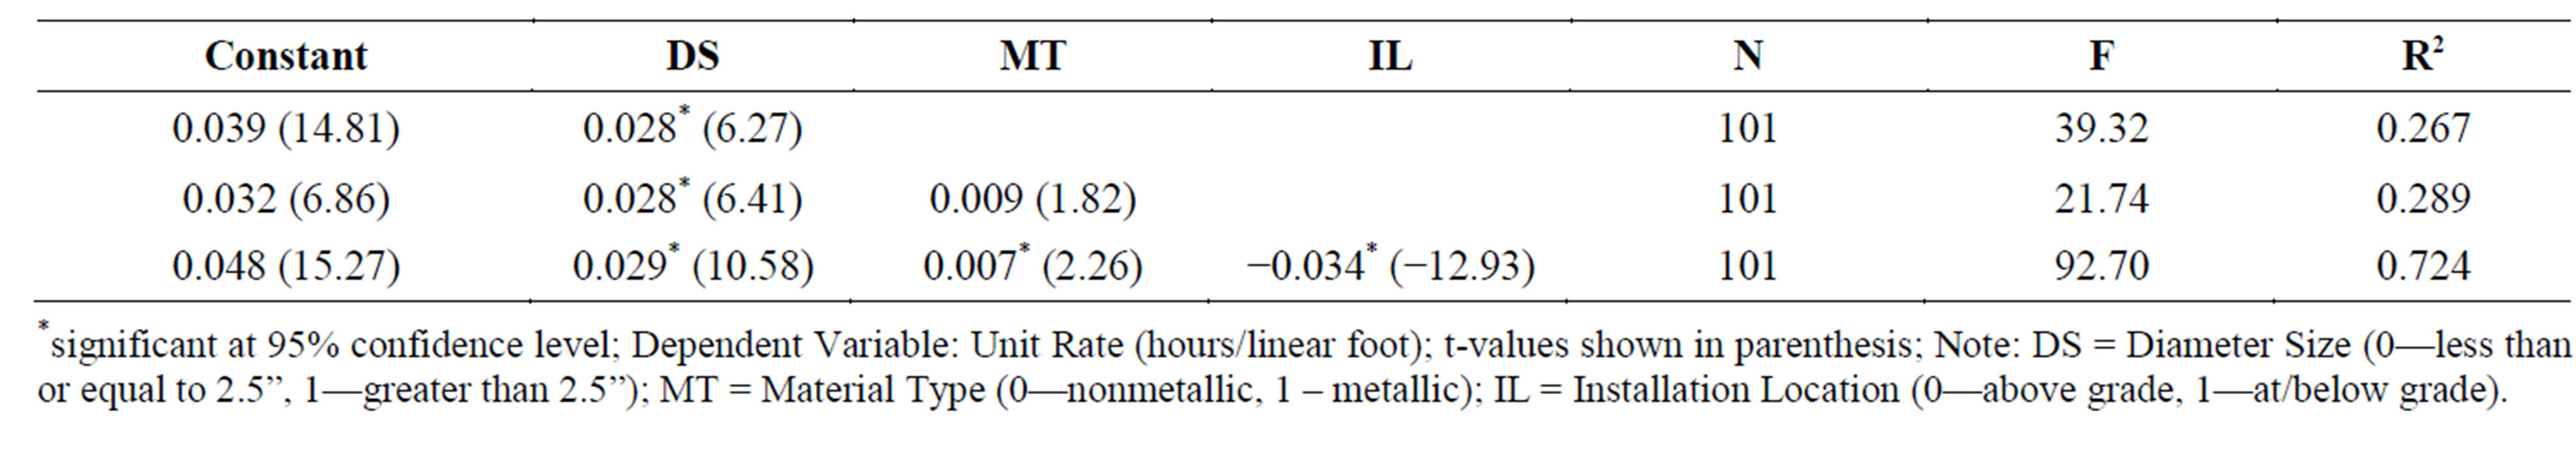
Table 14. Company C conduit code regression findings.
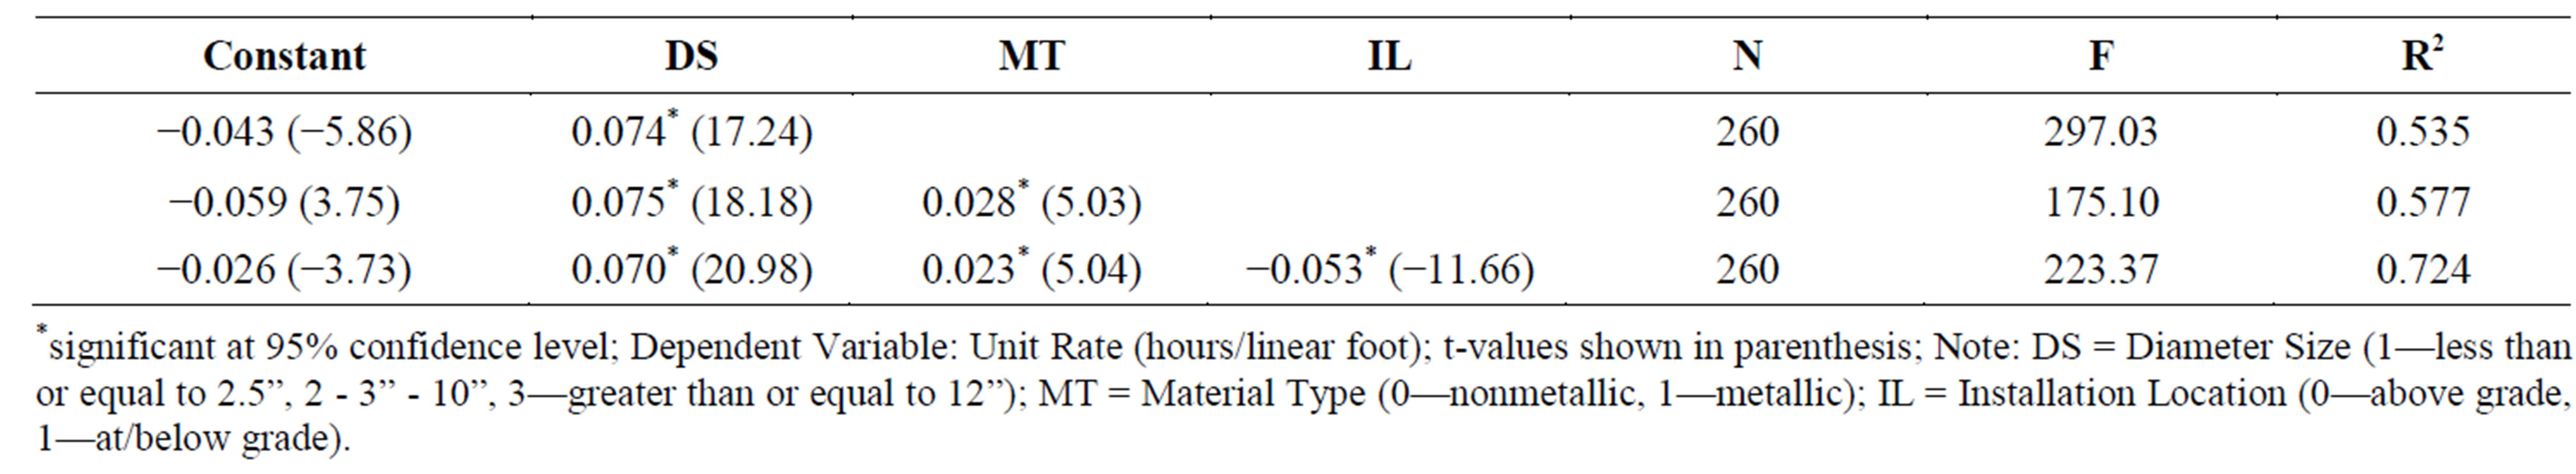
Table 15. Company A piping code regression findings.
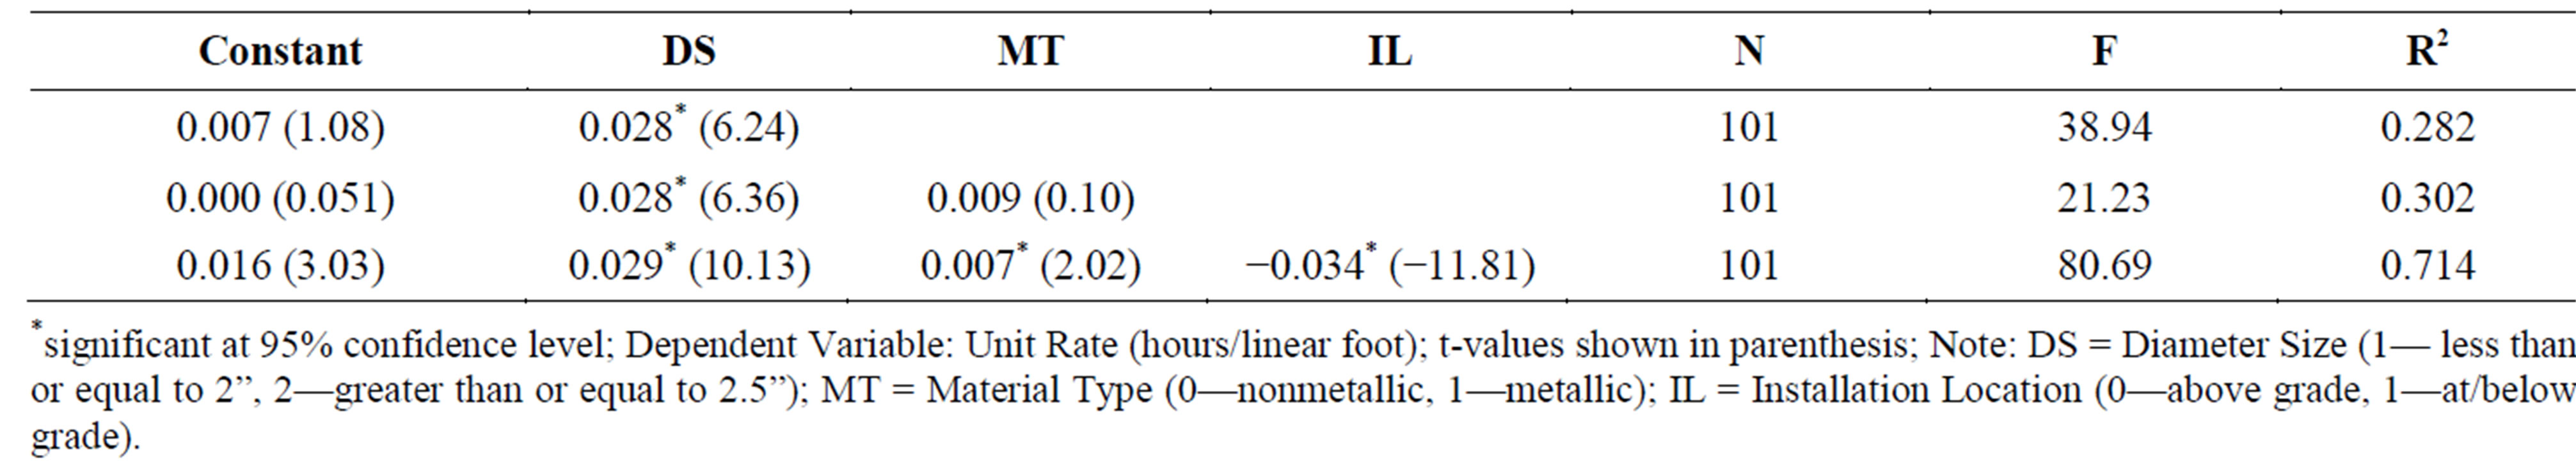
Table 16. Company A conduit code regression findings.
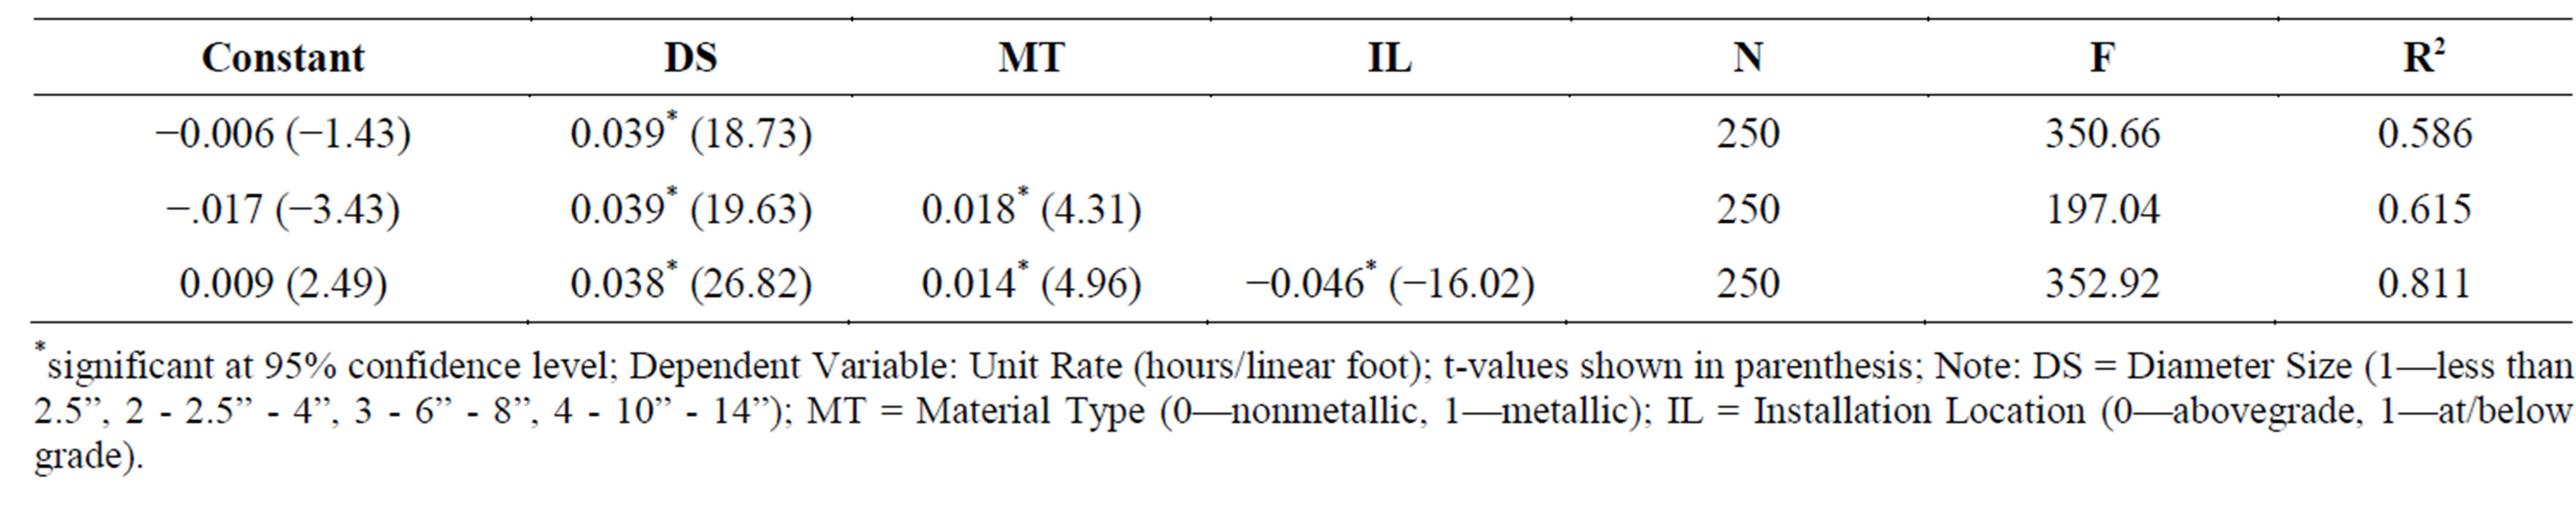
Table 17. Company B piping code regression findings.
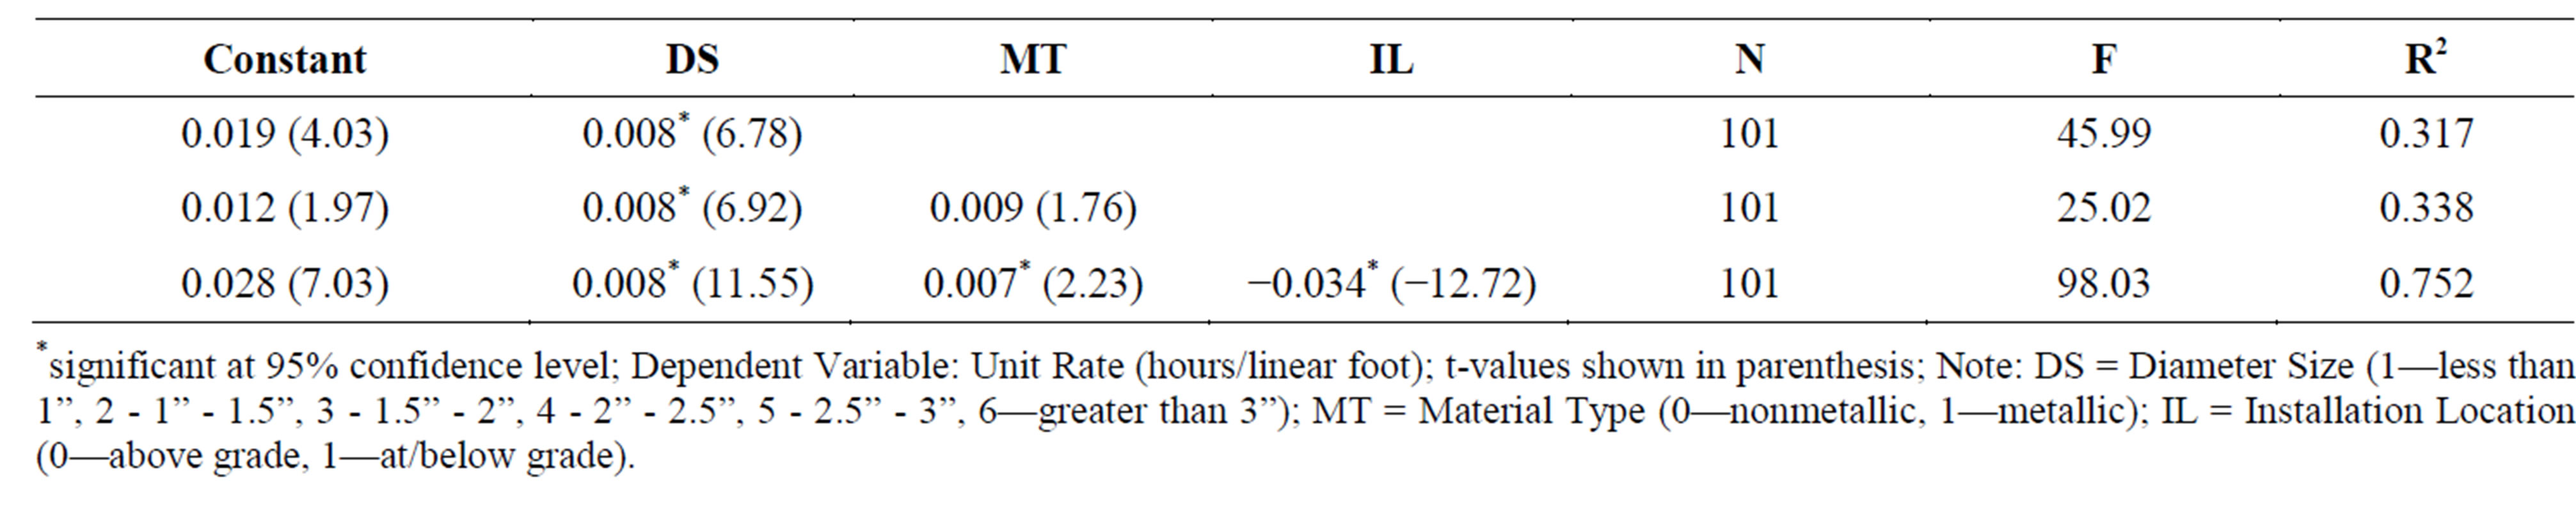
Table 18. Company B conduit code regression findings.
ured by the complexity of the code structure.
5. Discussion and Conclusions
The regression analyses clearly show that differences in the code structure have a significant impact on the ability to accurately measure labor productivity unit rates with respect to piping and conduit construction activities. It is highly likely that the same theorem holds for other types of construction activities. In almost every analysis, a more detailed code structure more significantly affected the corresponding unit rate productivity. Clearly, there are code structures utilized in industry which do not accurately measure productivity. An example of these instances are the code structures utilized by companies C and D, which either did not specify significant attributes (e.g. Company D did not record sizing of piping or conduit) or used too large an aggregate to measure a significant attribute (e.g. Company C grouped its piping and conduit sizing into only two classifications).
A primary objective of this paper is to examine whether a master code of account can be developed that accurately and consistently measures construction productivity (e.g. unit rates) across multiple projects, companies, and industry sectors. A master code of account improves company performance by not only improving the measurement of current productivity, but also improving the predictability of future performance. A standardized code would also serve as a first step towards developing reliable industry productivity measures with the idea that measured unit rates on construction projects would be rolled up into an industry measure. Obviously, details of how to adequately aggregate project measures to an industry measure needs to be addressed in future research.
The paper’s primary contribution to the overall body of knowledge is that it identifies the critical elements necessary to adequately devise a master code of account for piping and conduit installation. Specifically, the attributes that need to be recorded include pipe/conduit diameter, material type, and installation location. The analyses show that aggregating diameter sizes for piping for up to 4” and 6” intervals would suffice for piping while also holding true for up to 2” intervals for conduit. In terms of material type, the analyses show that consolidating material types into either metallic or non-metallic is sufficient for the purpose of tracking unit productivity. Finally, tracking the location of installation for both piping and conduit is extremely important as well.
The paper addresses a set of statistical analyses to frame the organization of a code of accounts. These analyses are admittedly shielded from the reality of implementing a master code of accounts in industry. What is not addressed is the potential resistance that some companies may pose to adopting an industry master code of accounts. Some construction firms view their existing master code of accounts as providing a competitive edge to accurately control and estimate construction work. Furthermore if a master code of account was adopted in industry, owners would have the improved ability to compare construction performance across multiple contractors, which could likely impose increased pressure for greater performance on behalf of construction firms from project owners. These potential deterrents should be offset by the on-going fact that the US construction industry is continually perceived as being inconsistent and ineffective in terms of construction productivity. Without a robust industry productivity measure, the question of whether construction productivity has been improving or declining will remain somewhat of an enigma. Developing a system that ensures consistent productivity measures are obtained at a basic level of construction is a first step towards answering the larger question.
Acknowledgements
The authors thank the National Institute of Standards and Technology for funding this research (Contract ID 60- NANB12H005) along with numerous affiliated industry partners who provided their master code of accounts and provided invaluable input during the course of the project.
REFERENCES
- Business Roundtable (BRT), “More Construction for the Money,” The Business Roundtable, New York, 1983.
- National Research Council (NRC), “Advancing the Competitiveness and Efficiency of the US Construction Industry,” The National Academies Press, Washington DC, 2009.
- H. Stokes, “An Examination of the Productivity Decline in the Construction Industry,” The Review of Economics and Statistics, Vol. 63, No. 4, 1981, pp. 495-502. http://dx.doi.org/10.2307/1935844
- S. G. Allen, “Why Construction Industry Productivity Is Declining,” The Review of Economics and Statistics, Vol. 117, No. 4, 1985, pp. 661-665. http://dx.doi.org/10.2307/1924811
- P. Teicholz, “Discussion on US Construction Labor Productivity Trends, 1970-1998,” Journal of Construction Engineering and Management, Vol. 127, No. 5, 2001, 427-429.
- J. Triplett and B. Bosworth, “Productivity in the US Services Sector: New Sources of Economic Growth,” Brookings Institution Press, Washington DC, 2004.
- P. Goodrum and C. Haas, “Partial Factor Productivity and Equipment Technology Change at the Activity Level in the US Construction Industry,” Journal of Construction Engineering and Management, Vol. 128, No. 6, 2002, pp. 463-472. http://dx.doi.org/10.1061/(ASCE)0733-9364(2002)128:6(463)
- D. Dacy, “Productivity and Price Trends in Construction since 1947,” Review of Economics and Statistics, Vol. 47, No. 4, 1965, pp. 406-411. http://dx.doi.org/10.2307/1927769
- R. Gordon, “A New View of Real Investment in Structures, 1919-1966,” Review of Economics and Statistics, Vol. 50, No. 4, 1968, pp. 417-428. http://dx.doi.org/10.2307/1926807
- S. Rosefielde and M. D. Quinn, “Is Construction Technologically Stagnant?” In: J. Lange and D. Mills, The Construction Industry: Balance Wheel of the Economy, Lexington Books, Lexington, Massachusetts, 1979, pp. 83-114.
- P. Pieper, “The Measurement of Construction Prices: Retrospect and Prospect,” In: E. Berndt and J. Triplet, Fifty Years of Economic Measurement: The Jubilee of the Conference on Research in Income and Wealth, The University of Chicago Press, Chicago, 1990, pp. 239-272.
- W. Gullickson and M. Harper, “Bias in Aggregate Productivity Trends Revisited,” Monthly Labor Review, 2002, pp. 32-40.
- D. Zhai, P. Goodrum, C. Haas and C. Caldas, “Relationship between the Automation an Integration of Construction Information Systems and Productivity,” ASCE Journal of Construction Engineering and Management, Vol. 135, No. 8, 2009, pp 746-753. http://dx.doi.org/10.1061/(ASCE)CO.1943-7862.0000024
- P. Goodrum, C. Haas and R. Glover, “The Divergence in Aggregate and Activity Estimates of US Construction Productivity,” Journal of Construction Management and Economics, Vol. 20, No. 5, 2002, pp. 415-423. http://dx.doi.org/10.1080/01446190210145868
- P. Goodrum and C. Haas, “The Long-Term Impact of Equipment Technology on Labor Productivity in the US Construction Industry at the Activity Level,” Journal of Construction Engineering and Management, Vol. 131, No. 1, 2004, pp. 124-133. http://dx.doi.org/10.1061/(ASCE)0733-9364(2004)130:1(124)
- P. Goodrum, D. Zhai and M. Yasin, “The Relationship between Changes in Material Technology and Construction Productivity,” Journal of Construction Engineering and Management, Vol. 135, No. 4, 2009, pp. 278-287. http://dx.doi.org/10.1061/(ASCE)0733-9364(2009)135:4(278)
- P. Pieper, “Construction Price Statistics Revisited,” In: D. Jorgenson and R. Landau, Technology and Capital Formation, The MIT Press, Cambridge, 1989, pp. 293-330.
- T. E. Dielman, “Applied Regression Analysis: A Second Course in Business and Economics Statistics,” 4th Edition, South-Western Cengage Learning, Mason, 2005.