Open Journal of Safety Science and Technology
Vol.4 No.1(2014), Article ID:44042,14 pages DOI:10.4236/ojsst.2014.41008
Quantitative Risk Assessment in Iran’s Natural Gas Distribution Network
Payam Amir-Heidari1, Mehrzad Ebrahemzadih2,3*, Hadi Farahani4, Jamshid Khoubi2,3
1Department of Civil and Environment Engineering, Amirkabir University of Technology, Tehran, Iran
2Kurdistan Environmental Health Research Center, Kurdistan University of Medical Sciences, Sanandaj, Iran
3Department of Occupational Health, Faculty of Health, Kurdistan University of Medical Sciences, Sanandaj, Iran
4Research Institute of Petroleum Industry (RIPI), Tehran, Iran
Email: *emhrzad@yahoo.com
Copyright © 2014 by authors and Scientific Research Publishing Inc.
This work is licensed under the Creative Commons Attribution International License (CC BY).
http://creativecommons.org/licenses/by/4.0/


Received 30 September 2013; revised 30 October 2013; accepted 7 November 2013
ABSTRACT
Natural gas (NG) is one of the widely used domestic fuels in most of the countries, and because of economical and environmental advantages, its consumption is continuously increasing. As a result, complex piping systems are being installed to transport and distribute the gas for end users. Pipelines carrying NG are a significant source of hazard for their adjacent society. The risk of this hazard could be high especially in distribution network and urban areas where the population density is high. The common causes of accident in NG distribution network are: third party interference, corrosion, fatigue, stress corrosion cracking (SCC), etc. Accident in network leads to leakage and release of NG and consequent injuries and losses. To prevent these adverse outcomes, the risks should be identified and assessed carefully, so that they can be controlled and managed properly. In this work, risk assessment of NG distribution pipelines was surveyed and quantitative methods were recommended for assessing the individual and societal risks of distribution network.
Keywords:Distribution Network; Natural Gas; Pipeline; Risk Assessment

1. Introduction
Natural gas (NG) is one of the most widely used domestic fuels in most of the countries, and its consumption is continuously increasing. As a result, complex piping systems are being installed to transport and distribute the gas for end users. Pipeline networks are mostly installed in urban zones, i.e. in highly populated areas. Therefore, accidental gas releases can cause significant environmental damages, economical losses and injury to the population [1] .
Although gas piping systems are mostly installed underground, they are often damaged by various activities. The leakage of NG can lead to different scenarios and outcomes. The most common consequence of NG pipeline accidents is fire and explosion. NG pipelines are divided into three main categories [2] (Figure 1).
a) Gathering pipelines: that transport gas from a current production facility to a transmission line or main. Plainly speaking, gathering lines are those pipelines that are used to transport NG from the production site (wellhead) to a central collection point. They generally operate at relatively low pressures and flow, and are smaller in diameter than transmission lines.
b) Transmission pipelines: These pipelines are used to transport NG from their respective gathering systems to refining, processing or storage facilities. Transmission pipelines also transport refined NG to customers, for use or for further distribution. Transmission pipelines are constructed from steel pipe and can range in size from several inches to several feet in diameter.
c) Distribution pipelines: Local distribution companies own and operate NG distribution pipelines. They receive NG from transmission pipelines and distribute it to commercial and residential end-users. Distribution pipelines are generally smaller in diameter than gas transmission pipelines and operate at reduced pressures (e.g. 60 psi). Many gas distribution pipelines are made of plastic pipe rather than steel.
NG pipelines failures are potentially hazardous events especially in urban areas and near roads. Therefore, people around the pipeline routes are subject to significant risk from pipeline failure. The hazard distance associated with the pipeline ranges from under 20 m for a smaller pipeline at lower pressure, up to over 300 m for a larger one at higher pressure [3] .
2. Risks of NG Distribution Network
Risk is defined as a measure of the probability and severity of adverse effects [4] . Recently, risk analysis has already been extensively applied in safety science, environmental science, economics, sociology, etc. It aims at finding out the potential accidents, analysis on the causes as well as the improvements to reduce the risk [5] .
Statistical data show that the number of serious incidents of the gas distribution pipelines is relatively high, compared with that of gathering and transmission pipelines, and almost 80 percent of total accidents of the pipelines is related to gas distribution network (Figure 2). So the frequency of NG distribution pipeline accidents is relatively high.
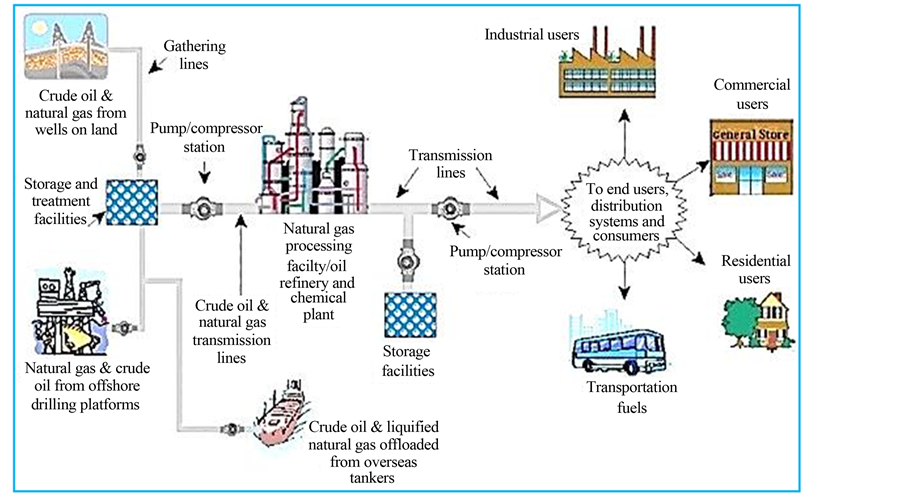
Figure 1. NG from wellhead to consumption [2] .
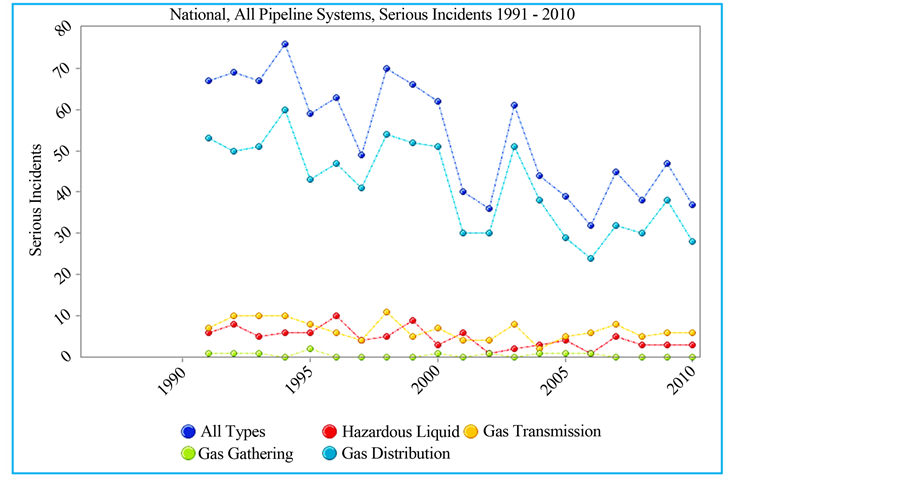
Figure 2. Comparison between the number of serious incidents of gas distribution pipelines and gathering and transmission pipelines [6] .
At the other hand, number of the people living in the vicinity of these pipelines is considerably high compared with other types of pipelines, and this will increase the severity of gas distribution pipeline accidents. High frequency and high severity of consequences will raise the level of the risk. Therefore comprehensive, accurate and quantitative assessment of the risks will be necessary to determine the safe distances, prevent the accidents, and provide proper emergency responses.
Risk assessment is an essential and systematic process for assessing the impact, occurrence, and the consequences of human activities on systems with hazardous characteristics [7] . Risk may be assessed qualitatively or quantitatively. Both of these methods are useful, but the quantitative method is highly recommended to assess the risks of the NG distribution network. However, some specialists prefer to use hybrid or semi-quantitative techniques.
In quantitative method both individual risks (IR) and societal risks (SR) should be taken into consideration. Individual risk transects quantitatively express the likelihood at various distances from the pipeline that an individual could sustain a fatal injury or dangerous dose as a result of an accidental release from the pipeline. The individual risk is represented as a transect perpendicular to the axis of the pipeline. Risk transects have been calculated for individual risk of fatality and individual risk of dangerous dose or greater for each pipeline in the study [8] .
In the case of societal risk, F-N curves quantitatively express societal risk as the probability of N or more fatalities as a result of an accidental release from the pipeline [8] .
Individual risk is calculated by multiplying the probability of pipeline failure (φ) by death probability (P), resulted from pipe failure, in a specific location of the pipeline. We can realize that societal risk is more important than individual risk, since having the societal risk we will be able to calculate the number of fatalities that will result from accident in a pipeline with a probability of failure of φ.
The calculation of risk requires the combination of the probability of a hazardous event occurring and the consequence of that event causing a fatality. The probability and consequences of pipeline failure have been combined to develop individual risk transects and societal risk F-N curves [8] .
The failure of NG pipelines may occur due to natural or man-made disasters such as earthquake, hurricane, sabotage, overpressure, flood, corrosion, or fatigue failures. The failure rate is also influenced by design factors, construction conditions, maintenance policy, technology usage and environmental factors [9] .
External interference, corrosion, mechanical and material failure, ground movement, and error in Hot tap operation are the main known causes of NG pipeline accidents and consequent losses (Figure 3).
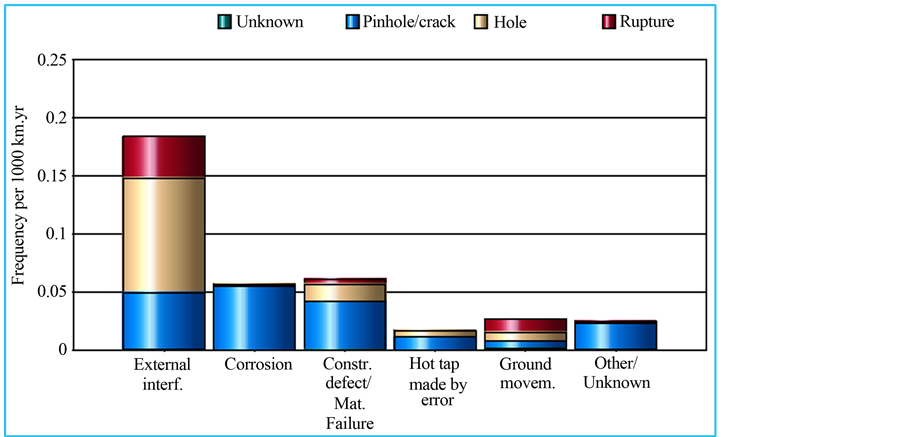
Figure 3. Main causes of NG pipeline accidents by frequencies, 2008 [10] .
3. Results and Discussion
3.1. Quantitative Risk Assessment of NG Distribution Network
Risk analysis and assessment (RAA) techniques are classified into three main categories: (a) the qualitative techniques, such as: HAZOP1 and What-if analysis (b) the quantitative techniques, and (c) the hybrid techniques (semi-quantitative) such as FTA2 and ETA3. The qualitative techniques are based both on analytical estimation processes, and on the safety managers/engineers ability. Also the hybrid techniques, present a great complexity due to their ad hoc character that prevents a wide spreading. However in quantitative techniques, the risk can be considered as a quantity, which can be estimated and expressed by a mathematical relation, under the help of real accident’s data recorded in a work site [11] [12] . Therefore in quantitative risk assessment techniques we deal with some empirical and mathematical relations and also with the historical data of accidents.
Quantitative risk assessment combines three key ideas [13] :
1. The chance of something going wrong2. The consequences if it does, and 3. The context within which the situation is set.
The most common methods of quantitative risk assessment are: PRAT4 technique [14] , DMRA5 technique [15] , Risk measures of societal risk, QRA6 techniques, QADS7, CREA8 method [16] , PEA9 method, and WRA [17] .
3.1.1. Probability of Failure in the NG Pipelines
Usually historical data are used to determine the probability of pipeline failure [18] . The failure probability of various segments of a pipeline may be completely different. The failure rate of a pipeline varies significantly with design factors, construction conditions, maintenance techniques and environmental situation, etc. [5] . At present, many companies (e.g. the British Gas Corporation [19] ) use demerit-point-cards to assess the propensity of different sections of a gas pipeline to fail [20] .
The probability of failure in the pipelines is defined as the number of failures per unit length of pipe in one year (1/year∙km), assuming uniform conditions along the pipeline section of interest [21] . This probability is not a constant value and depends on various factors.
In Europe this probability varies from  [22] . The European Gas Pipeline Incident Data Group presented an overall failure rate of 0.575 per 1000 km year based on the experiences over 1.47 ´ 106 km year of onshore NG pipeline, which can be used as a general value of failure rate for risk analysis (in Europe) [3] .
The factors that are directly involved in probability of failure of low-pressure CI10 pipelines (in gas distribution network) are: [23]
Ÿ intrinsic features of the pipeline-section
-hickness
-Diameter
-Age
Ÿ factors concerning the laying of the pipeline-section
-Depth
-Location
-Ground characteristics
-Type and state of the pavement
-laying techniques
Ÿ environmental parameters of the pipeline-section
-Traffic characteristics
-Intensity of underground services
-External temperature and moisture
3.1.2. Valid Scenarios and Consequences of the NG Pipeline Accidents
In order to assess the risk regarding the NG pipeline, it is necessary to evaluate probable undesirable consequences resulting from any pipeline leakage or rupture [10] .
As a result of an accident in a pipeline a large amount of fuel gas enters into the atmosphere. This release may lead to consequences such as fire or explosion [24] and cause harm to the adjacent people and buildings.
When the released gas intensively mixes with air and forms a persistent vapor cloud, it will lead to a significant flash fire or unconfined vapor cloud explosion.
In the case of NG pipelines the probability of flash fire is very low, since NG is lighter than air, and because of its buoyant nature it cannot form a persistent vapor cloud at the ground level. Therefore the overpressure from unconfined vapor cloud explosion can be ignored. Dangers Related from Gas release (leakage and rupture) in gas line Evaluated by Event Tree Analysis (ETA) Technique (Figure 4). The toxic effect of NG leakage can also be neglected [18] . So the consequences of the NG pipeline accidents are usually: thermal radiation of the jet fire and confined explosion.
1) Jet fire
Fire is a complex chain reaction where a fuel combines with oxygen to generate heat, smoke, and light. A jet fire, also referred to as a flame jet, occurs when a flammable chemical is rapidly released from an opening in a container and immediately catches on fire—much like the flame from a blowtorch. Thermal radiation is the primary hazard associated with a jet fire. Other potential jet fire hazards include smoke, toxic byproducts from the fire, and secondary fires and explosions in the surrounding area [25] . In the case of NG pipelines, the thermal radiation will be the most important hazard of an accident.
When the gas is burning at the leakage source, the fire becomes diffusion flame (i.e. jet flame) and poses a threat to the people near the leakage source. The risk of jet flame can be quantitative judged by the measure of thermal radiation. A jet flame can be idealized as a series of point source heat emitters spreading along the length of the flame. By collapsing the set of heat emitters into a single point source emitter located at ground level, the total heat flux received by a ground level damage receptor is conservatively estimated [5] .
2) Confined vapor cloud explosion
The most basic definition of an explosion is a sudden, intense release of energy that often produces a loud noise, high temperatures, and flying debris, and generates a pressure wave. There are many types of explosions and the causes and effects will vary. We should consider three primary hazards when dealing with an explosion: thermal radiation, overpressure, and hazardous fragments [25] .
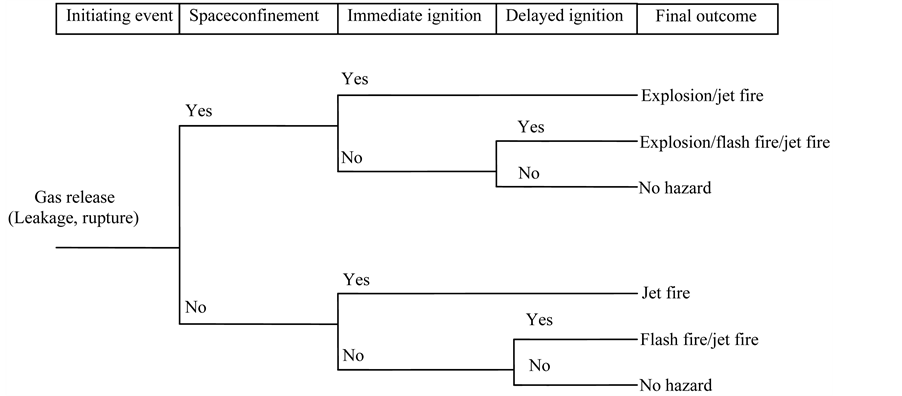
Figure 4. Event tree analysis of N.G pipeline leakage.
Buildings inside the LFL11 radius could be severely damaged due to the potential of a confined vapor cloud explosion. Moreover, if the escaping gas is not trapped and immediate ignition occurs, then a long-lasting jet fire would pose the most significant hazard, due to the high thermal radiation levels [3] .
3.2. Quantitative Determination of Individual and Societal Risks
We can use Pietersen model to calculate the death probability of a person affected by the thermal radiation of a jet fire: [26]
 (1)
(1)
where t is the exposure time in seconds, and I is the thermal radiation flux at a specific location in .
.
To calculate the thermal radiation flux at a defined distance from the source of radiation we can use Equation (2), which is suggested by APIRP [27] :
 (2)
(2)
In which ![]() is the radiation fraction,
is the radiation fraction, ![]() is the atmospheric transmissivity, Q is the gas release rate in
is the atmospheric transmissivity, Q is the gas release rate in![]() ,
,  is the heat of combustion of the burning material in
 ![]() , and r is the radial distance of the point that is exposed to radiation from the source of radiation.
, and r is the radial distance of the point that is exposed to radiation from the source of radiation.
The radiation factor for the methane is 0.2 and the time of exposure in urban areas is suggested by Rausch
[28] to be 30 seconds. If we get the heat of combustion of the NG equal to , and atmospheric transmissivity equal to 1, Equation (1) reduces to Equation (3):
 (3)
(3)
To calculate ![]() from Equation (3) it is necessary to determine the rate of release Q. the flow of gas from the hole may be sonic or subsonic. The rate of release is different for the sonic and subsonic flow. The type of gas in the pipeline and the difference between the internal and atmospheric pressure will define the type of flow.
from Equation (3) it is necessary to determine the rate of release Q. the flow of gas from the hole may be sonic or subsonic. The rate of release is different for the sonic and subsonic flow. The type of gas in the pipeline and the difference between the internal and atmospheric pressure will define the type of flow.
According to the mechanic of fluids relations, the flow of the gas from a throat or hole can be characterized by equations bellow: [29]


in this equations  is the atmospheric pressure in Pascal, P the pressure of the gas in the pipeline in Pascal,
![]() is the specific heat ratio of the gas, M is the molecular weight, R is the ideal gas constant in
is the specific heat ratio of the gas, M is the molecular weight, R is the ideal gas constant in , T is the absolute temperature in Kelvin,
  is the gas release coefficient that depends on the shape an geometry of the hole in the pipeline, and Y is the gas inflating coefficient that can be obtained by Equation (8):
 (8)
(8)
Flow can be assumed to be subsonic for most of the city gas pipelines [30] . These formulas will be used in determination of the societal and individual risks resulted from jet fire scenario in a pipeline. The calculations for confined vapr cloud explosion are similar to that of jet fire, but in the case of confined explosion, overpressure is the dominant hazard.
3.2.1. Individual Risk
Individual risk is defined as the probability that an average unprotected person, permanently present at a certain location, is killed due to an accident resulting from a hazardous activity [31] .
To calculate the individual risk we need to determine the probability of pipeline failure (![]() ) and the death probability due to accident in the pipeline (P). The individual risk is obtained by multiplying these two quantities.
) and the death probability due to accident in the pipeline (P). The individual risk is obtained by multiplying these two quantities.
To calculate the death probability, first we should determine the probability unit![]() . Calculating the release rate (Q), and inserting this amount and the distance of the known point from the radiation source (r) into the Equation (3),
. Calculating the release rate (Q), and inserting this amount and the distance of the known point from the radiation source (r) into the Equation (3), ![]() will be obtained for jet fire scenario. Now having
will be obtained for jet fire scenario. Now having ![]() and using Figure 5, we can determine the death probability P. P depends on gas release rate and the distance from the fire.
and using Figure 5, we can determine the death probability P. P depends on gas release rate and the distance from the fire.
Then individual risk at a specific location and specific scenario is calculated by Equation (9):
 (9)
(9)
For a specific accident scenario, ![]() can be calculated by following equation [32] :
can be calculated by following equation [32] :
![]() (10)
(10)
where ![]() is the expected failure rate per unit pipeline length (1/yr×km),
is the expected failure rate per unit pipeline length (1/yr×km),  is the basic failure rate per unit length of pipeline (1/yr×km), Kk is the correction function associated with the failure causes,
  are the variables of the correction function, and the subscript k denotes the failure causes such as external interference, construction defects, corrosion, ground movement and others.
According to the Section 3.1, the pipeline failure probability (![]() ) can be calculated by quantification of historical data, using specific statistical techniques.
) can be calculated by quantification of historical data, using specific statistical techniques.
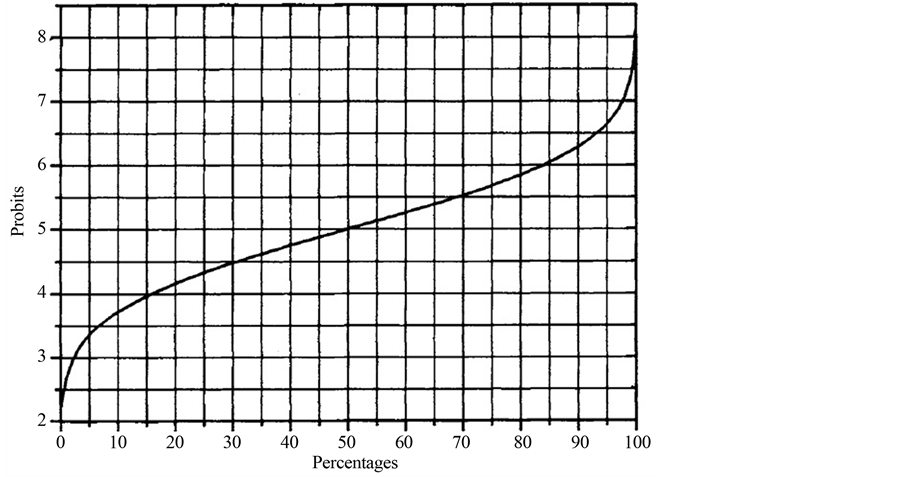
Figure 5. Relation between probability unit (Probit) and probability of death [33] .
The failure rate of pipelines depends on various parameters such as soil conditions, coating type and properties, design considerations, and pipeline age. So a long pipeline is divided into sections due to significant changes of these parameters. Considering a constant failure rate, the individual risk can be written as [34] :
 (11)
(11)
where
 = Failure rate per unit length of the pipeline associated with the accident scenario i due to soil condition, coating, design and age, 1/year∙km l = Pipeline length, m Pi = Lethality associated with the accident scenario i l± = Ends of the interacting section of the pipeline in which an accident poses hazard to the specified location, m The release of gas through a hole on the pipeline causes explosion and fire in the NG pipeline and the surrounding area, which creates accidents. The effected section causes a hazard distance. The release rate of NG and hazard distance is correlated [3] :
 (12)
(12)
where:
![]() = Effective release rate from a hole on a pipeline carrying NG, kg/sec, and
= Effective release rate from a hole on a pipeline carrying NG, kg/sec, and
 = Hazard distance, m The hazard distance is the distance within which there is more than one percent chance of fatality due to the radiational heat of jet fire from pipeline rupture.
From Figure 6, the interacting section of a straight pipeline, h, from a specified location, is estimated by the following equation [34] :
 (13)
(13)
Individual risk is useful, however it does not completely describe situations where a single accident could kill or injure large numbers of people. These situations are addressed by estimating societal risk which is expressed as the relationship between the probability of an incident, expressed as the average frequency with which it can be expected to occur, and its consequences. It is usually represented as an F-N curve.
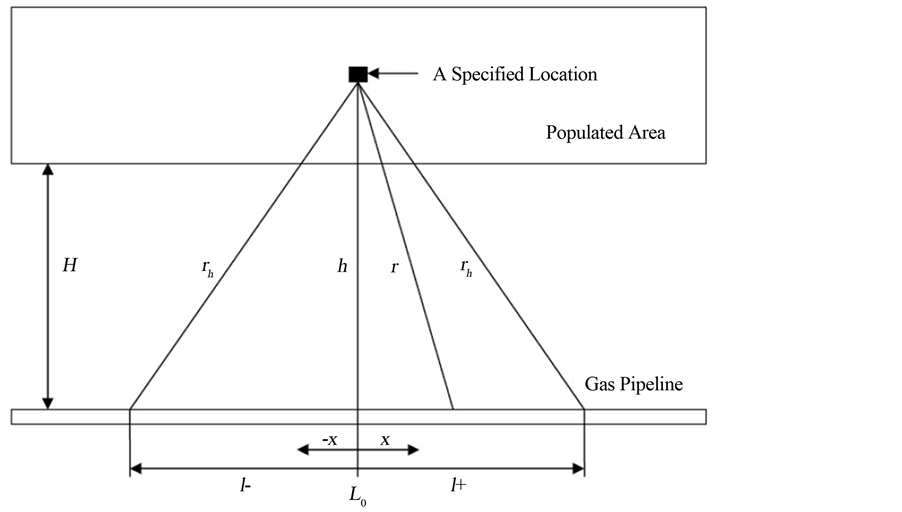
Figure 6. Individual risk variables [34] .
3.2.2. Societal Risk
In determining the societal risk we deal with both probability of pipeline failure and the number of people that will die as a result of accident in the pipeline. Societal risk is defined as the relationship between cumulative frequency and the number of people suffering from a specified level of harm in a given population from the realization of specified hazards. The expected number of fatality from a hypothetical accident could be calculated by integrating the multiplication of fatality and population density within a hazard area, and it is usually expressed in the form of a graph of cumulative frequency (F) of N or more casualties plotted against N (F-N curve) [35] .
From plotted F-N curve and criteria function we can determine whether the level of the societal risk is accepted or not (Figure 7).
The societal risk for a given technical system is accepted when F-N curve is below the criterion line D (a defined function with regard to societal preferences) for all N. If the F-N curve is situated between criteria lines D and G, then the ALARP (as low as reasonably practicable) principle should be applied to indicate the ways to reduce risk. If for any N the F-N curve is above the upper criteria line G, the risk is intolerable and the system must re-designed (e.g. functionally and structurally modified) to reduce risk as required [12] .
Every radius (r) from radiation source has its specific value of P. we have a function such as  that assigns a specific probability of death for each radius (r). The longer the distance (r), the lower the probability of death (P).
![]() (14)
(14)
Having the radius of threat zones, and the probability of death at different radiuses and also the population density, we can compute the number of fatality (N) resulted from a specific accident in the pipeline. The quality of computation depends on the sensitivity and the accuracy required. The total number of fatality can be calculated by the formula bellow:
 (15)
(15)
In this formula ![]() is the population density, P is the probability of death, r is the radial distance from the fire,
is the population density, P is the probability of death, r is the radial distance from the fire,  is the radial distance at which the probability of death is 1%, A is the area of the circle with a radius of r, and
 ![]() is the area of circle with a radius of
is the area of circle with a radius of  (Figure 8).
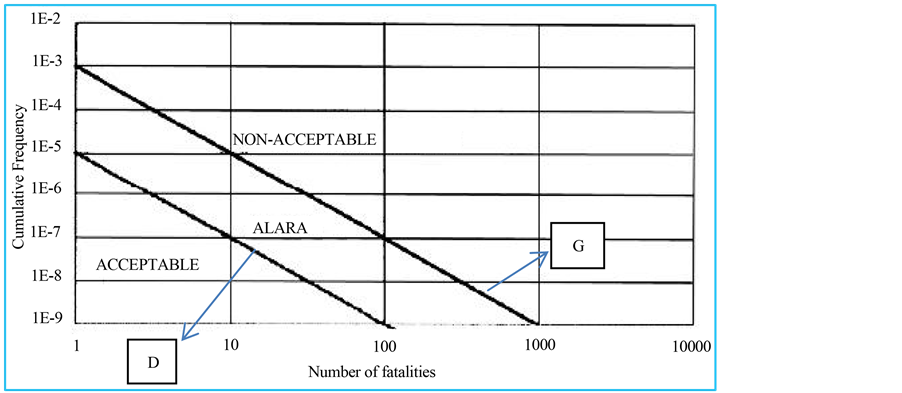
Figure 7. Criteria function of societal risk [36] .
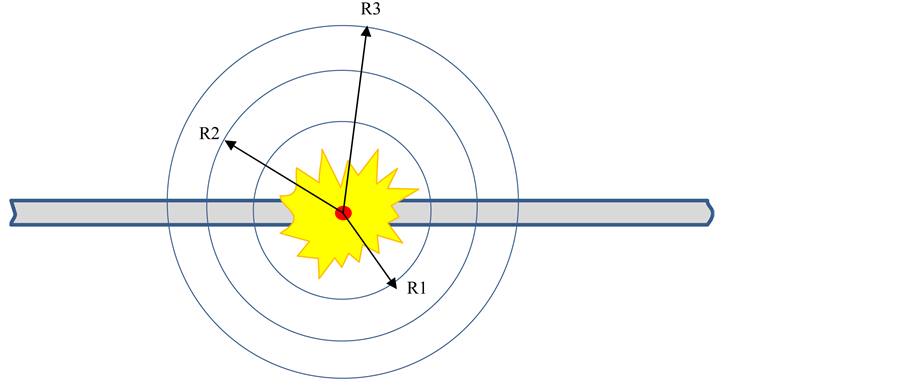
Figure 8. Radial distance (ri,p) of threat zones with a probability of death of P.
The limitation of using the right side relation of Equation (15) is that both  and P must be just radially variables, i.e. there must be no variation of P and
  in different directions at any arbitrary r value. We can realize that
  may be a constant value all over the area A.
In this formula the threat zone is assumed to be completely symmetric and as a circle with origin at the radiation source. This is just a theoretical formula and the real condition for a jet fire may have some differences with the theory. For example the thermal radiation zone of a jet fire may not be completely symmetric due to atmospheric conditions and effect of exact location of the hole in the pipeline. Also we may have no specific formula for the population density.
Regarding these problems we can use a simpler and approximate method. We can estimate the number of fatality at three zones, illustrated before, and then sum up them to calculate the total number of fatality.
In order to determine the number of fatality we can divide the threat zone into three zones, each one with specific range of probability of death. Having the number of the people in each zone and the average probability of death in them, we can determine the total number of fatality. The death zone can be divided into three zones, with the range of probability of death equal to 1% - 50%, 50% - 99%, and 99% - 100% [34] 12.
Considering the source of radiation as origin, the probability of death will decrease with increasing the radial distance from the origin.
To calculate the radial distance of points at which the probability of death is P, first we find the corresponding value of  from Figure 5 and inserting this value into Equation (3), we can find the radius of circle on which the probability of death is P. the radius of this circle depend on the rate of release (Q).
From Figure 5, the corresponding  for the zones with a P of 1%, 50%, and 99%, is 2.67, 5, and 7.33 respectively. Inserting these values into Equation (3) the radiuses of these zones are computed as bellow:

Then:
 (19)
(19)
 is the number of the fatality in the zone with death probability from a to b.
Using average death probability at these zones we can estimate the total number of the fatality. Combining Equation (3) with the data provided in Figure 5 we can obtain a relation between P and r with a third variable Q in the relation.
Then the average probability of death in each zone can be obtained as:
 (20)
(20)
In this formula  and
and  are the boundary radiuses for each zone. These values obtained in equations 16 to 18.
Now we can determine number of fatality from Equation (21), which is derived from Equation (19) and Table 1:
![]() (21)
(21)
In this formula  is the population density and
  is the area of the zone in which the death probability (P) is between a and b.
Having (N) and estimating the cumulative frequency (F), we can plot the F-N curve. Plotting the F-N curve and criteria function both in one coordinate we can determine if the level of existing societal risk is acceptable or not, and also from this plot we will find that what can be done to reduce the level of the risk (Figure 9).
Nowadays modeling softwares, such as ALOHA13 and PHAST14 help specialists to accurately determine the threat zones. ALOHA is a simple software that can be used in consequence modeling and risk assessment of NG pipelines. A sample output model of this software for the scenario of jet fire in a 60 psi pipeline is shown in Figure 10. ALOHA assumes the jet fire release is oriented vertically, although the wind can tilt the flames in the downwind direction.
4. Conclusion
NG distribution pipelines in a city gas network pass from populated areas such as pavements, roads, and residen

Table 1. Required data in Equation (20), and calculated value of Pave.
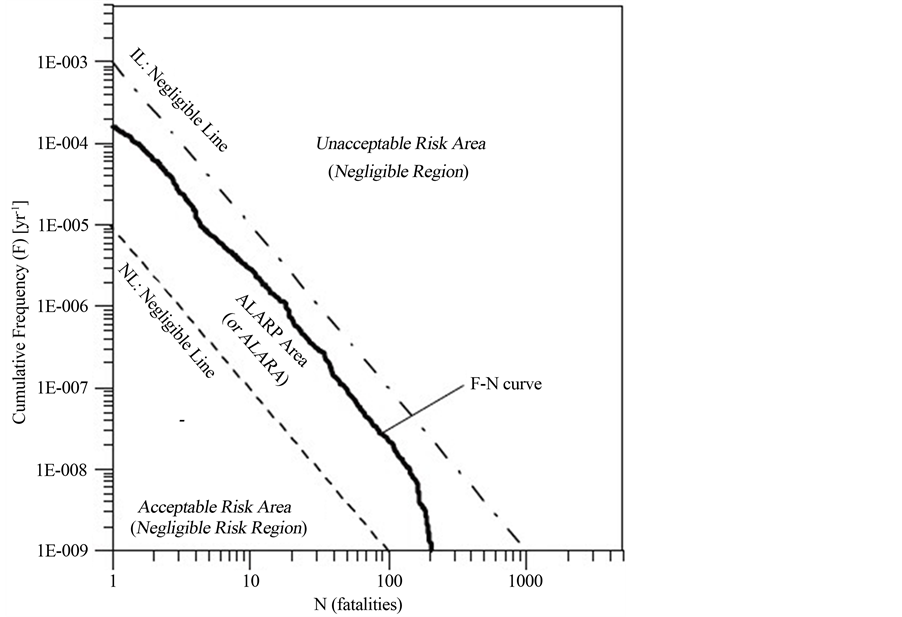
Figure 9. An example of the F-N curve and criteria functions for societal risk [12] .
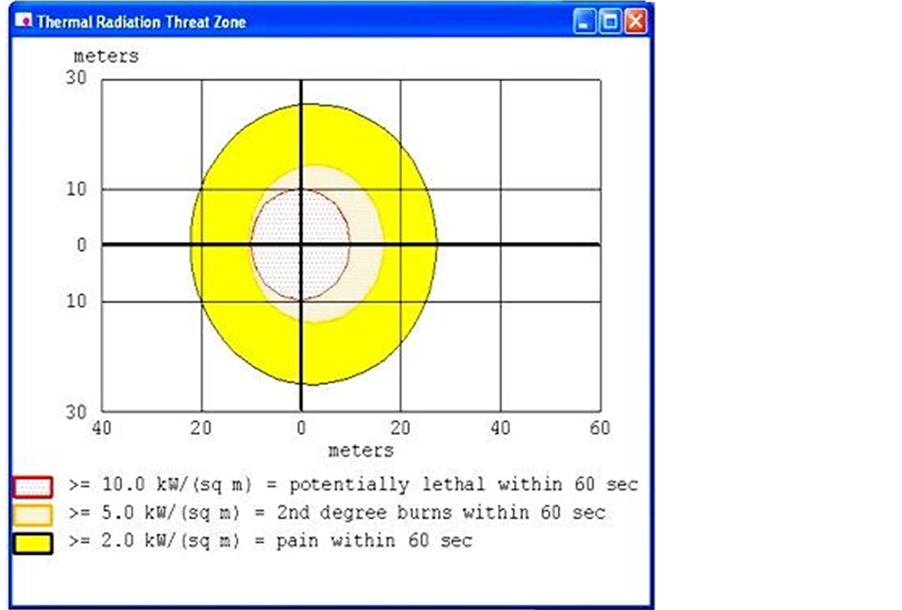
Figure 10. Aloha model for jet fire scenario in 60 psi ng pipeline.
tial areas. These pipelines are usually installed underground; however always there is a probability of accident and gas release due to unsafe actions and unsafe conditions. The probability of failure and severity of consequences is relatively high in urban areas; therefore, in distribution network, the level of the risk is high, compared with risks of gathering and transmission pipelines. Accident in distribution pipelines leads to adverse outcomes such as injuries and losses. To prevent these accidents we need to accurately analyze and assess the risks of the network. Quantitative risk assessment methods are highly recommended for assessing the risks of NG distribution network. These methods can help us to properly compute the level of individual and societal risks and determine the safe distances. These methods can also be used to manage and control the risks.
References
- Arnaldo, J., Casal, J., Montiel, H., Sanchez-Carricondo, M. and Vilchez, J.A. (1998) Design of a Computer Tool for the Evaluation of the Consequences of Accidental NG Release in Distribution Pipes. Journal of Loss Prevention in the Process Industries, 11, 135-148. http://dx.doi.org/10.1016/S0950-4230(97)00041-7
- PHMSA. http://primis.phmsa.dot.gov/comm/PetroleumPipelineSystems.htm
- Jo, Y.-D. and Ahn, B.J. (2002) Analysis of Hazard Area Associated with High Pressure Natural-Gas Pipeline. Journal of Loss Prevention in the Process Industries, 15, 179-188. http://dx.doi.org/10.1016/S0950-4230(02)00007-4
- Haimes, Y.Y. (2008) Risk modelling, Assessment, and Management. 3rd Edition, John Wiley & Sons Inc. Publication, New York.
- Han, Z.Y. and Weng, W.G. (2010) An Integrated Quantitative Risk Analysis Method for NG Pipeline Network. Journal of Loss Prevention in the Process Industries, 23, 428-436. http://dx.doi.org/10.1016/j.jlp.2010.02.003
- Enamul Hossain, M., Ketata, C., Ibrahim Khan, M. and Rafiqul Islam, M. (2009) Flammability and Individual Risk Assessment for NG Pipelines. ASPES, 1, 33-44.
- Van Duijne, F.H., Aken, D. and Schouten, E.G. (2008) Considerations in Developing Complete and Quantified Methods for Risk Assessment. Safety Science, 46, 245-254. http://dx.doi.org/10.1016/j.ssci.2007.05.003
- HSE (1994) Risks from Hazardous Pipelines in the United Kingdom, HSE Contract Research Report No. 82/1994.
- PHMSA Significant Incident Files, 2011.
- 7th Report of the European Gas Pipeline Incident Data Group, Gas Pipeline Incidents, 2008, Document No. EGIG 08. TV-B. 0502.
- Marhavilas, P.K., Koulouriotis, D. E. and Voulgaridou, K. (2009) Development of a Quantitative Risk Assessment Technique and Application on an Industry’s Worksite Using Real Accidents’ Data. Scientific Journal of Hellenic Association of Mechanical & Electrical Engineers, 416, 14-20.
- Marhavilas, P.K., Koulouriotis, D. and Gemeni, V. (2011) Risk Analysis and Assessment Methodologies in the Work Sites: On a Review, Classification and Comparative Study of the Scientific Literature of the Period 2000-2009. Journal of Loss Prevention in the Process Industries, 24, 477-523.
- Almoussawi, R. and Christian, C. (2005) Fundamentals of Quantitative Risk Analysis. Journal of Hydroinformatics, 7, 61-77
- Marhavilas, P.K. andKoulouriotis, D.E. (2008) A Risk Estimation Methodological Framework Using Quantitative Assessment Techniques and Real Accidents’ Data: Application in an Aluminum Extrusion Industry. Journal of Loss Prevention in the Process Industries, 21, 596-603.
- Woodruff, J.M. (2005) Consequence and Likelihood in Risk Estimation: A Matter of Balance in UK Health and Safety Risk Assessment Practice. Safety Science, 43, 345-353. http://dx.doi.org/10.1016/j.ssci.2005.07.003
- Trucco, P. and Cavallin, M. (2006) A Quantitative Approach to Clinical Risk Assessment: The CREA Method. Safety Science, 44, 491-513.
- Suddle, S. (2009) The Weighted Risk Analysis. Safety Science, 47, 668-679.
- Amir Heidary, P. (2011) Risk Assessment of NG Pipeline. 3rd Iranian Pipe & Pipeline Conference, 24-25 May 2011, Tehran.
- Bacon, J.F. (1988) King Report. British Gas Corporation, London, 1988.
- Cagno, E., Caron, F., Mancini, M. and Ruggeri, F. (2000) Using AHP in Determining the Prior Distributions on Gas Pipeline Failures in a Robust Bayesian Approach. Reliability Engineering and System Safety, 67, 275-284. http://dx.doi.org/10.1016/S0951-8320(99)00070-8
- Jo, Y.D. and Crowl, D.A. (2008) Individual Risk Analysis of High-Pressure NG Pipelines. Journal of Loss Prevention in the Process Industries, 21, 589-595. http://dx.doi.org/10.1016/j.jlp.2008.04.006
- Spyros, S. and Fotis, R. (2006) Estimation of Safety Distances in the Vicinity of Fuel Gas Pipelines. Journal of Loss Prevention in the Process Industries, 19, 24-31. http://dx.doi.org/10.1016/j.jlp.2005.05.002
- Cagno, E., Caron, F., Cipolletti, D., Mancini, M. and Ruggeri, F. (1997) Assessment of the Failure Probability of Underground Pipelines for the Gas Supply in a Metropolitan Environment: A Robust Bayesian Approach (Italian), Technical report CNR-IAMI, 97-12.
- Center for Chemical Process Safety (CCPS) (1994) Guidelines for Evaluating the Characteristics of Vapor Cloud Explosions, Flash Fires, and BLEVEs. Wiley-AICHE, New York.
- ALOHA User’s Manual, U.S. Environmental Protection Agency Office of Emergency Management, Washington DC, 2007.
- Pietersen, C.M. (1985) Analysis of the LPG-Incident in San Juan Ixhuasapec, Mexico City. TNO Report, The Netherlands.
- API RP 521, Guide for Pressure-Relieving and Depressuring Systems. American Petroleum Institute, Washington DC, 1997.
- Rausch, A.H., Eisenberg, N.A. and Lynch, C.J. (1977) Continuing Development of the Vulnerability Model (VM2). Department of Transportation, United States Coast Guard, Washington DC.
- Crowl, D.A. and Louvar, J.F. () Chemical Process Safety. 2nd Edition, Prentice Hall PTR, Upper Saddle River, 130- 135.
- Park, K.-S., Lee, J.-H., Jo and Y.-D. (2004) An Approchto Risk Managementof City Gas Pipeline. Process Safety and Environmental Protection, 82, 446-452. http://dx.doi.org/10.1205/psep.82.6.446.53210
- Jonkman, S.N., Van Gelder, P.H. and Vrijling, J.K. (2003) An Overview of Quantitative Risk Measures for Loss of Life and Economic Damage. Journal of Hazardous Materials, 99, 1-30. http://dx.doi.org/10.1016/S0304-3894(02)00283-2
- Sklavounos, S. and Rigas, F. (2006) Estimation of Safety Distances in the Vicinity of Fuel Gas Pipelines. Journal of Loss Prevention in the Process Industries, 19, 24-31. http://dx.doi.org/10.1016/j.jlp.2005.05.002
- Finney, D.J. (1971) Probit Analysis. 3d Edition, Cambridge University Press, Cambridge, 23.
- Jo, Y.-D. and Ahn, B.J. (2005) A Method of Quantitative Risk Assessment for Transmission Pipeline Carrying NG, Journal of Hazardous Materials, A123, 1-12. http://dx.doi.org/10.1016/j.jhazmat.2005.01.034
- IGE (2001) Steel Pipeline for High Pressure Gas Transmission. Recommendations on Transmission and Distribution Practice IGE/TD/1. 4th Edition, Institution of Gas Engineers, London, Communication 1670.
NOTES

*Corresponding author.

1Hazard & Operability.
2Fault Tree analysis.
3Event Tree Analysis.
4Proportional risk-assessment technique.
5Decision matrix risk-assessment.
6Quantitative risk assessment tool.
7Quantitative assessment of domino scenarios.
8Clinical risk and error analysis.
9Predictive, epistemic approach.

10Cast Iron.

11Lower Flammable Limit.

12Areas with a death probability less than 1% are not regarded as threat zones.

13Areal Locations of Hazardous Atmospheres.
14PHAST is a dispersion modeling and consequence analysis software package that is available through DNV.