Open Journal of Animal Sciences
Vol. 2 No. 4 (2012) , Article ID: 23977 , 7 pages DOI:10.4236/ojas.2012.24036
Growth and feed efficiency of range performance tested beef bulls in the arid sweet bushveld of South Africa
![]()
1Mara Research Station, Limpopo Department of Agriculture, Makhado, South Africa; *Corresponding Author: mashiloaneml@agric.limpopo.gov.za
2Limpopo Department of Agriculture, Polokwane, South Africa
Received 14 August 2012; revised 17 September 2012; accepted 27 September 2012
Keywords: Bull Performance Testing; Average Daily Gain; Kleiber Ratio
ABSTRACT
Data consisting of test performance records of 725 bulls was analysed to evaluate trends for growth and feed efficiency, and to determine environmental factors that influence growth of range performance tested bulls in the arid sweet bushveld of South Africa. Performance data were subjected to regression procedures to estimate parameters of the slope (β) and intercept (α) for average daily gain (ADG) and Kleiber ratio (KR). Mixed procedures were applied to test for sources of variation in ADG and KR. There was an increase of 3.481 g/day/year and 0.528 g/day/ year in ADG for Nguni and Bonsmara bulls, respectively. The ADG trends’ respective feed efficiency as reflected by KR was 0.093 and 0.059. Herd of origin and test-year were the sources of variation for ADG while the variation in KR was due to the herd of origin, test-year, start-age and start-weight. Results indicated a steady increase in ADG and KR for range performance tested bulls in the arid sweet bushveld.
1. INTRODUCTION
Given that natural grazing is the most important input resource at the disposal of range cattle farmers to convert low quality roughage into high quality protein, genetic improvement of cattle regarding growth and efficiency of production on natural grazing is crucial. Bull selection is the most rapid way to change the genetic composition of a herd of cattle [1]. Bull selection for increased herd performance is essential because of typically low selection intensity in cows owing to low reproduction and high replacement rate. Bulls also represent 50% of the genetic makeup of any year’s calf crop and for producers who retain their own heifers, 90% of cowherd genetic change [2,3].
A key selection aid for young bulls is performance information from a bull performance test. The aim of any testing programme is to identify the parents of the next generation which are likely to contribute to increased herd net income [4]. While several traits are evaluated in a bull performance test, the most important is the bull’s ability to gain weight and the efficiency with which it gains. [5] indicates that, average daily gain (ADG) will be more appropriate than live weight when evaluating the growth potential of beef bulls. Feed efficiency, in general, is a measure of weight gained from feed consumed. In range growth tests, feed intake data is not recorded to enable for estimation of feed efficiency but Kleiber ratio which is a ratio of ADG to metabolic weight (ME) is used as an alternative measure or indicator of feed efficiency [6]. The mean animal weight (MWT) from which the ME is derived, is the average of the start and end of test weight. ME is calculated as MWT0.73 [6]. [7] suggested that feed efficiency as measured in terms of KR is highly affected by the amount of grazing available. Therefore the KR in a range growth test is likely to be linked with the test-year effect.
Producers should make informed decisions when purchasing or selecting for a herd bull since substantial financial and genetic risks are associated with poor quality bulls [2]. Mara Research Station of the Limpopo Department of Agriculture has since 1995 performed annual bull performance tests aimed at aiding range cattle farmers in selecting superior bulls for their production environment. The test follows procedures as described for Phase D of the National Beef Cattle Improvement Scheme (NBCIS) wherein bullocks of about a year of age are received from farmers for range performance testing on the facility [8].
Mara Research Station is found on the arid sweet bushveld of South Africa. Bulls from farms within the arid sweet bushveld and other veld types in the Limpopo Province are brought together and evaluated for performance as contemporaries on this particular veld type which is the sole feed source for the duration of the test. The Bonsmara and Nguni cattle breeds are the most prominent breeds participating in the Mara Research Station range performance test of young bulls. Growth and feed efficiency, and the traits respective trends over years for bulls of these breeds in a range performance test in the arid sweet bushveld have not been studied. [9] indicated that studying long term trends of performance tested bulls allows producers to understand how cattle have changed over time (performance-wise) and how to further improve their herds today. Therefore the objectives of the current study were to evaluate growth and feed efficiency trends and to determine environmental factors that affected growth and efficiency of range performance tested bulls in the arid sweet bushveld.
2. MATERIALS AND METHODS
2.1. Test Site Environment
Data used for this study was collected at Mara Research Station which is located in the summer rainfall area of the Limpopo bushveld 23˚05′S and 29˚25'E. The natural grazing type (veld type) at Mara Research Station is described as the arid sweet bushveld of the South Africa [10] and has an estimated carrying capacity of 10 ha/LSU. Figure 1 shows the map of South Africa, the Limpopo province with its various veld types and the test site. For the period of testing covered in the analysis, the average annual rainfall was 452.25 mm. Figure 2 shows the mean annual rainfall recorded at test site for the period covering the tests considered in analysis.
2.2. Animal Management and Data Collection
Bullocks less than 425 days of age arrive on the testing facility around September to October of every year. Upon arrival, initial weights are recorded then bullocks are put in an adaptation period (21 - 90 days allowable). During the adaptation phase, bullocks are dewormed, vaccinated for quarter evil, anthrax, botulism and lumpy skin. During the test phase, live body weights are recorded at 3 week intervals. Body measurements, scrotum circumference and skin thickness are recorded at the end of the test. Performance results of bulls are expressed as indexes for the test contemporary restricting comparison and bull ranking to a specific test year. Further details on the Phase D testing requirements and procedures are available in NBCIS Guidelines [8]. Noteworthy for the
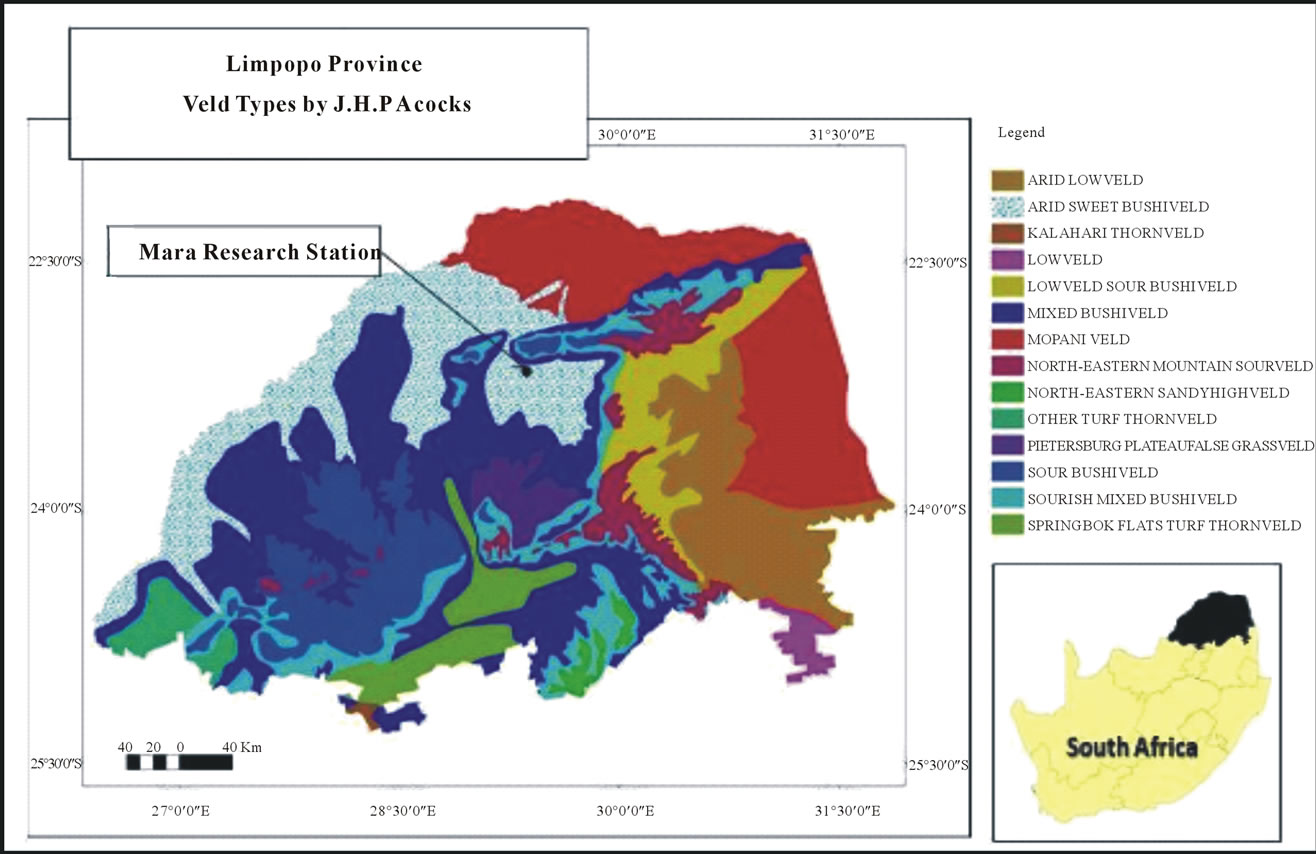
Figure 1. Map of Limpopo province showing Acocks veld types and the study site.
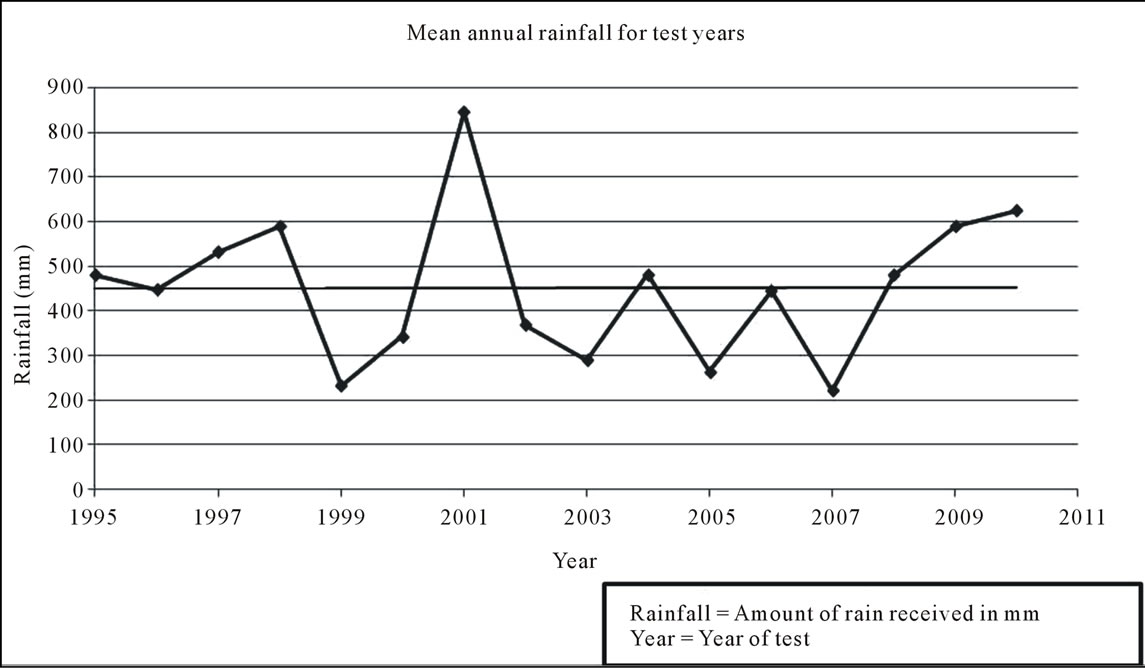
Figure 2. Mean annual rainfall (mm) at Mara Research Station from 1995 to 2010.
Mara Research Station range performance test is that throughout the test period, bullocks are kept strictly on natural grazing without lick or supplements. This test environment mimics the production environment of range farmers in which cattle are run on natural pastures throughout the year without supplements.
2.3. Data Editing
The initial data set consisted of test performance records of 725 bulls of which 362 were Nguni and 363 were Bonsmara. The data sets for the two breeds were edited separately. Observations exceeding three standard deviations around the mean for ADG and KR were removed. Herds with less than 3 participations in the test were also removed to ensure the elimination of possible sire effect on performance as multiple sires will be represented across three test-years. The two resultant data sets were as follows: Nguni data had 345 records of ADG and KR from 13 herds; Bonsmara data had 354 records on ADG and KR from 18 herds. The summary of the traits, covariable and class effects for the data sets are presented in Table 1.
2.4. Data Analysis
The assumption of linear increase of growth traits was made based on findings by [9] that suggested linearity (P < 0.01) of growth traits in bull performance tests. Therefore, linear function parameters of the slope (β) and intercept (α) were estimated for ADG and KR for both breeds separately using regression procedures of the Statistical Analysis Software packages [11]. Mixed procedures were applied on the combined data to test for sources of variation (P < 0.05) in the performance as described by ADG and KR by fitting Eq.1.
 (1)
(1)
where:
yijkl = is a vector of observation for a given trait (ADG and KR);
µ = is the overall mean for trait;
bi = is the effect of the ith breed of bull;
hi = is the effect of the jth herd of origin;
pj = is the effect of the kth test-year;
β1 & β2 = are linear regressions of start-age and startweight;
eijkl = is the random residual (error).
3. RESULTS AND DISCUSSION
3.1. Results
The rate of change in ADG was 3.48 g/day/year while KR increased at a rate of 0.093 units per year for the Nguni (Figures 3 and 5). The rate of change in ADG was 0.53 g/day/year with KR increasing at a rate of 0.059 units per year for the Bonsmara (Figures 4 and 6).
ADG was affected by test-year and herd of origin but not by start-weight and start-age. Contrary to ADG, KR was affected by all effects considered. Table 2 presents probability values for the significant effect of breed, testyear, herd, initial mass and initial age on ADG and KR.
3.2. Discussion
The significant upward trend for growth rate (ADG) in
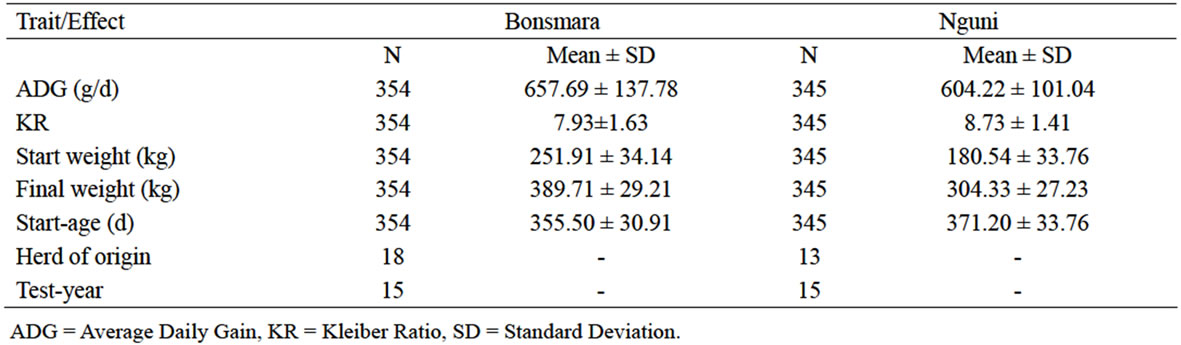
Table 1. Summary of data after editing.
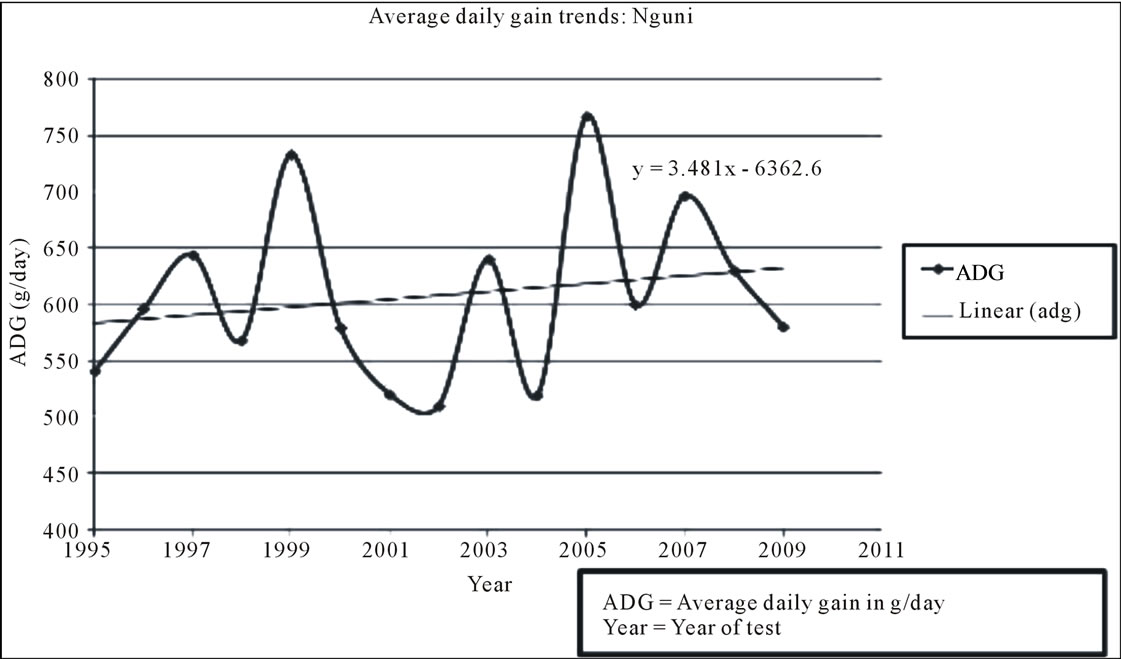
Figure 3. Average daily gain trends for Nguni bulls in range test.
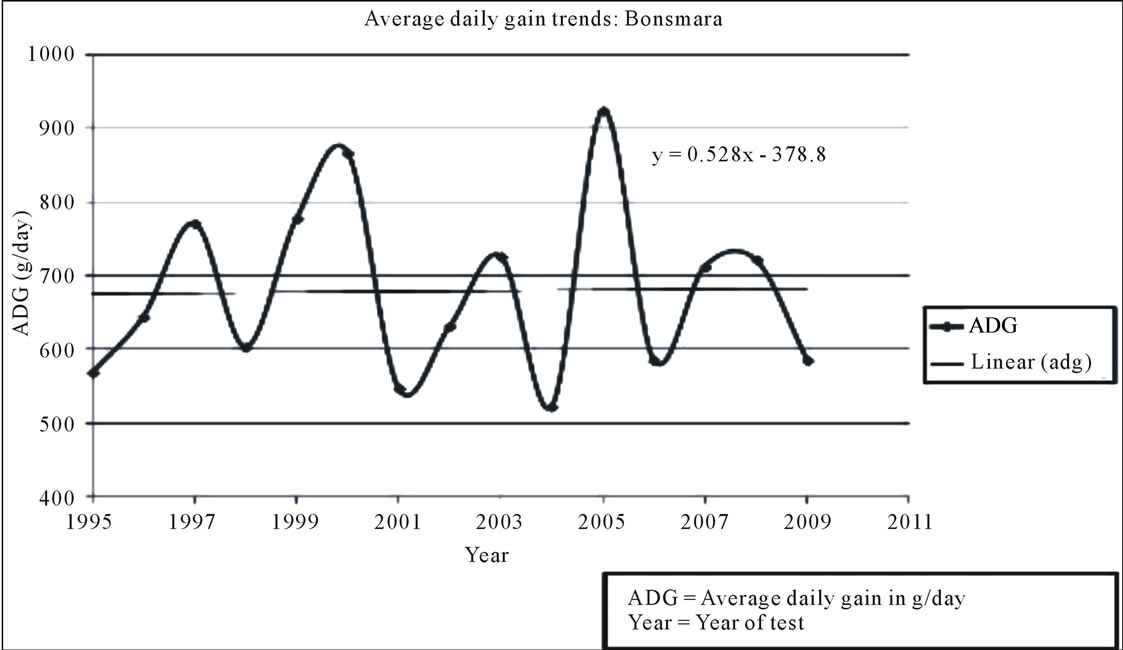
Figure 4. Average daily gain trends for Bonsmara bulls in range test.
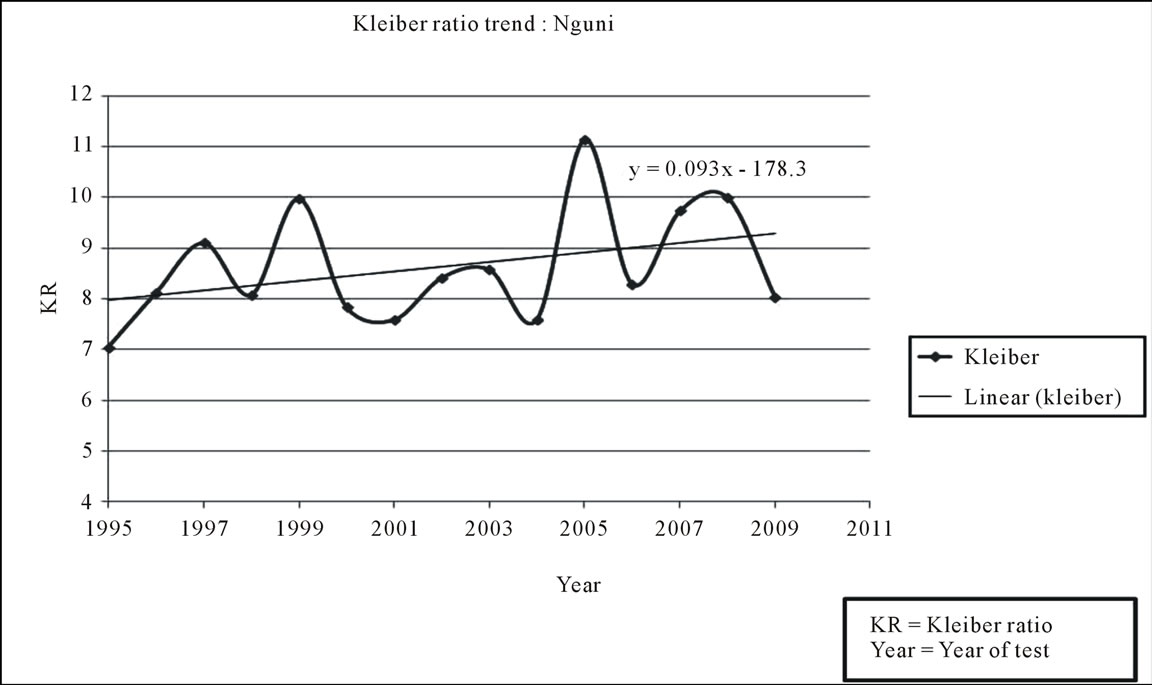
Figure 5. Kleiber ratio trends for Nguni bulls in range test.
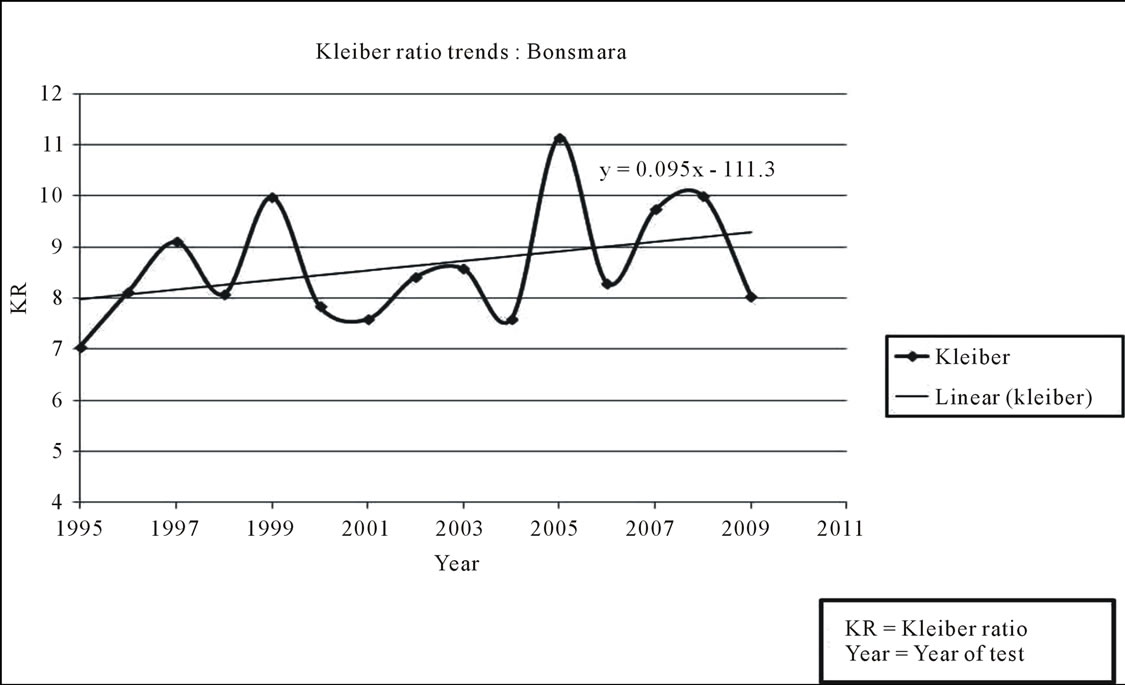
Figure 6. Kleiber ratio trends for Bonsmara bulls in range test.
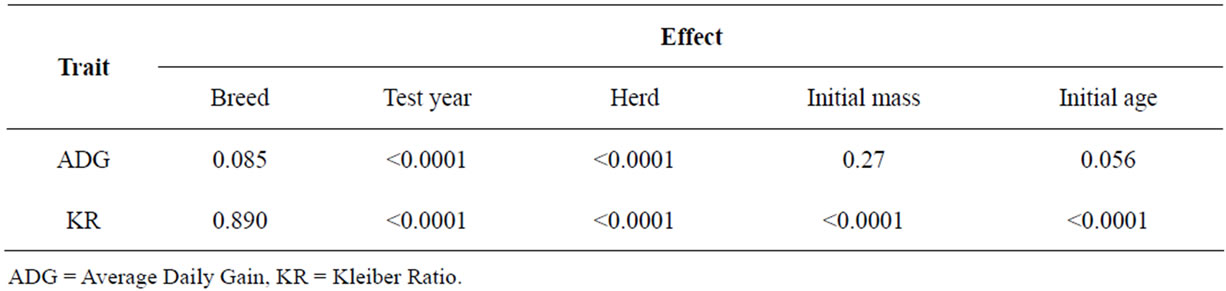
Table 2. Probability values for considered effects on ADG and KR.
both breeds is expected as both breeds are selected for higher post weaning ADG. [12] also reported general increases in ADG for beef bulls in test over years. The higher rate of change in ADG in Nguni shows more improvement was made in the test-years considered. The reason could be that the Nguni breed was among the breeds that joined formal performance evaluation later, therefore with the vast genetic variation, and bigger room for improvement in management, higher gains are expected in earlier periods of performance testing as opposed to later when the breed is expected to be at an improved stage. The positive trend of feed efficiency as represented by KR also reflected positive gains that were made for the two traits in both breeds.
The realized non difference in ADG and KR between breeds demonstrates that in a similar environment of testing, a bull’s performance is primarily due to its individual genetic potential for the traits and not the breed to which it belongs. In a Phase D type of test in which the two breeds in this study (Nguni and Bonsmara) were compared together with other breeds, [7] concluded generally that none of the breeds differed in terms ADG and KR. The significant herd of origin and test-year effect for ADG in a range bull test as found in this study has not been previously reported, but in a centralized test it was reported as a combined effect [13,14] and as herd of origin separately [15,16]. The insignificance of age at start of test on ADG was expected given the applied age restrictions of test contemporaries (not more than 100 days between oldest and youngest bull). It has been suggested that live weight increases with chronological age [9,15] but reports on the effect of age of bull on post weaning growth have not been consistent [5,17-20]. [5] suggested that variation in weight at start of test can consequently lead to variation in gain on test which would persist up to the end of test. In the contrary, results of the current study suggest that weight at start of test did not affect ADG. This could also be attributed to restrictions for within test group variation in start weight (not more than 65 kg for Nguni and not more than 75 kg for Bonsmara between the heaviest and lightest bull). The within test group weight ranges were set based on the scientific evidence for fair comparison hence are likely to minimize the unfair advantages in subsequent performance of bulls. Earlier studies have shown that weight at start of test influences growth rate of bulls on test [18,20]. Adversative to the nullifying effect of age and weight restrictions on the effect of start age and weight on ADG, KR was affected (P < 0.0001) by all effects (herd of origin, test year, age at start of test and weight at start of test) fitted. The implication hereby is that the feed efficiency estimated for range tested bull by KR is a trait whose variation is not limited by the start weight and age restrictions as is the case for ADG.
4. CONCLUSION
There are positive trends in annual ADG and KR of Nguni and Bonsmara bulls tested in the arid-sweet bushveld at Mara Research Station. The breed differences in annual rates are attributable to the level of improvement of the breeds. The year in which a bull is tested and the herd from which the bull originated play a major role in the realized ADG and KR. The current results suggest that for the range test in which start-age and start-weight ranges are restricted, age at which a bull starts a test and weight at start of test are immaterial to the realized ADG but important for the realized KR.
5. ACKNOWLEDGEMENTS
Authors like to acknowledge the farmer members of the Limpopo Veld Bull Club for the data on their bulls, Dr. Maiwashe A.N. of the Agricultural Research Council for the technical inputs and Gabrielle Lekalakala of the Limpopo Department of Agriculture for mapping of the study site.
REFERENCES
- Kriese, L.A., Bertrand, J.K. and Benyshek, L.L. (1991) Age adjustment factors, heritabilities and genetic correlations for scrotal circumference and related growth traits in Hereford and Brangus bulls. Journal of Animal Science, 69, 478-489.
- Dhuyvetter, K.C., Schroeder, T.C., Simms, D.D., Bolze, R.P. and Geske, J. (1996) Determinants of purebred beef bull price differentials. Journal of Agricultural and Resource Economics, 21, 396-410.
- Wagner, W., Gibb, J., Farmer, J. and Strohbehn, D. (1985) “Understanding and using sire summaries” Kansas beef cattle handbook No. GPE-8154. Kansas State University, Manhattan.
- Dalton, D.C. and Morris, C.A. (1978) A review of central performance testing of beef bulls and of recent research in New Zealand. Livestock Production Science, 5, 147. doi:10.1016/0301-6226(78)90042-8
- Liu, M.F. and Makerachian, M. (1993) Optimum test period and associations between standard growth growth rate in station tested bulls beef bulls. Journal of Animal Breeding and Genetics, 110, 312-317. doi:10.1111/j.1439-0388.1993.tb00743.x
- Arthur, P.F., Archer, J.A., Johnston, D.J., Herd, R.M., Richardson, E.C. and Parnell, D.F. (2001) Genetic and phenotypic variance and covariance of components of feed intake, feed efficiency, and other postweaning traits in Angus cattle. Journal of Animal Science, 79, 2805-2811.
- Mukuahima, G. (2008) The performance of beef cattle bulls in the Vrede district of Mpumlanga, South Africa. M Sc Dissertation, University of Pretoria, South Africa.
- Animal Improvement Institute (2005) National Beef Cattle Improvement Scheme (NBCIS) Version 1. Animal Improvement Institute, Irene.
- Garcia, M.D., Thomas, M.G., Enns, R.M. and Parker, W.R. (2002) 40-year trends in the Tucumcari New Mexico performance bull test. Proceedings, Western Section, American Society of Animal Science, 53.
- Acocks, J.P.H. (1998) Veld types of South Africa. Memoirs of the Botanical survey of South Africa No. 57. Government Printers, Pretoria.
- SAS (2010) SAS Enterprise Version 4.3 user’s guide. SAS Institute Inc, Cary.
- Chewning, J.J., Brown, Jr. A.H., Johnson, Z.B. and Brown, C.J. (1990) Breed means for average daily gain, feed conversion and intake of beef bulls during postweaning feedlot performance tests. Journal of Animal Science, 68, 1500-1505.
- Nephawe, K.A., Maiwashe, A. and Theron, E. (2006) The effect of herd of origin by year effect on postweaning traits of young beef bulls at centralized testing centres in South Africa. South African Journal of Animal Science, 36, 33-39.
- Schenkel, F.S., Miller, S.P. and Wilton, J.W. (2004) Herd of origin effect of weight gain of station tested bulls. Livestock Production Science, 86, 93-103. doi:10.1016/S0301-6226(03)00143-X
- Collins-Lussweti, E. and Curran, M.K. (1985) A note on environmental factors affecting beef performance. Animal Production, 41, 131-134. doi:10.1017/S0003356100017645
- Mantovani, R., Contiero, B, Gallo, L., Carnier, P., Cassandro, M. and Battinde, G. (1999) The effect of herd of origin on selection of Chianina, Marchgiana and Romagnola performance tested young bulls. Zootechnica Nutrizione Animale, 25, 109-121.
- Amal, S. and Crow, G.H. (1987) Herd of origin effects on the performance of station tested beef bulls. Canadian Journal of Animal Science, 67, 349. doi:10.4141/cjas87-034
- Batra, T.R. and Wilton, J.W. (1972) Effect of age and weight on gains of beef bulls. Journal of Animal Science, 35, 171.
- Lewis, W.H.E. and Allen, D.M. (1975) Performance testing for beef characteristics. In: Proceedings of the 1st World Congress on Genetics and Applied Livestock Production, Madrid.
- Tong, A.K.W. (1982) Effects of initial age and weight on test daily gains of station-tested bulls. Canadian Journal of Animal Science, 62, 671. doi:10.4141/cjas82-082