Open Journal of Preventive Medicine
Vol.4 No.4(2014), Article ID:44710,11 pages DOI:10.4236/ojpm.2014.44025
A Cluster Analysis of Lifestyle and Health Habits of Youth from Two Geographically and Culturally Diverse Countries
Yahya Al-Nakeeb1, Lorna J. Dodd2, Mark Lyons3, Peter Collins4, Anwar Al-Nuaim5
1College of Education, Qatar University, Doha, Qatar
2Department of Psychology and Counselling, Newman University, Birmingham, UK
3Faculty of Education and Health Sciences, University of Limerick, Limerick, Ireland
4School of Human Sciences, Newman University, Birmingham, UK
5Department of Physical Education, King Faisal University, Dammam, Saudi Arabia
Email: alnakeeb@qu.edu.qa, l.dodd@newman.ac.uk, mark.lyons@ul.ie, p.collins@newman.ac.uk, NUAI200@newman.ac.uk
Copyright © 2014 by authors and Scientific Research Publishing Inc.
This work is licensed under the Creative Commons Attribution International License (CC BY).
http://creativecommons.org/licenses/by/4.0/


Received 4 February 2014; revised 18 March 2014; accepted 1 April 2014
ABSTRACT
Objectives: Obesity is a leading risk factor for global mortality, promoted by poor dietary habits and sedentary behaviour. This study explores the clustering and differences in dietary habits, body mass index (BMI) and physical activity (PA) amongst youth from United Kingdom (UK) and Saudi Arabia (SA). Methods: 2290 males and females aged 15 - 17 years completed a self-report questionnaire and an objective measure of BMI. Results: Youth from SA had a higher prevalence of overweight/obesity and lower levels of PA than youth from the UK. Males were more physically active than females across both countries. Three clusters were identified: a “high risk” cluster with least healthy dietary habits, low PA and high BMI; a “moderate cluster” with moderate healthy dietary habits, PA and BMI; a “low risk” cluster with healthiest dietary habits, greatest PA and the lowest BMI compared to the other clusters. There were more SA youth in the high and moderate risk clusters compared to UK youth. Conclusions: Exploring cross-cultural and demographic characteristics of youth enables the identification of similarities and differences that might lead to the development of universal intervention strategies.
Keywords
Clustering; Risk Factors; Youth; Diet; Physical Activity; Body Mass Index

1. Introduction
Physical inactivity and obesity are leading risk factors for global mortality [1] [2] . Recent epidemiological studies utilising valid measures of PA have demonstrated stronger associations between PA and health benefits than have been observed previously [3] [4] . The strength of the relationship between PA and health outcomes persists throughout people’s lives, highlighting the potential health gains that could be achieved if people continue to be active. The increase in the global obesity epidemic during the past few decades is substantial. However, there are wide variations in obesity prevalence across countries and populations due to socioeconomic, cultural and transport differences in national and local environments [5] . Industrial countries have witnessed significant technological advancement and automation during the first half of the 20th century. This was paralleled by decreases in food energy supply that helped in preserving low obesity prevalence. However, in the 1970s-80s, an energy balance turning point seems to have occurred in many high-income countries [6] followed by a number of middle-income and low-income countries who have joined the global surge in obesity prevalence in adults and children [7] [8] . It appears that the most obvious environmental precondition for a population to develop obesity is sufficient wealth and economic prosperity [9] . The lifestyle changes during the last 2 - 3 decades in high-income countries seems to have led to a decrease in the energy expenditure needed for daily life and an increase in sedentary activities and weight gain.
The cross-cultural differences in lifestyle, dietary habits and PA in relation to overweight and obesity are clearly of interest to researchers, health professionals and policy makers in most countries to explore and identify intervention strategies. Both the UK and SA are regarded as high income countries with a growing problem of obesity among their child and adult populations [10] . The economic development and technological advances in the UK over the past few decades have led to a serious discrepancy between food availability and the energy required to access food. This has, inevitably, led to a new pandemic of metabolic conditions such as obesity and type 2 diabetes. Meanwhile, over the past two to three decades, SA has witnessed significant lifestyle changes due to rapid development, dominance of the automobile, availability of high-fat foods, satellite TV, increased reliance on computer and telecommunication [11] .
The most important risk factors of non-communicable diseases in the Arabian Gulf countries include high blood pressure, high concentrations of cholesterol in the blood, inadequate intake of fruit and vegetables, overweight or obesity, physical inactivity and tobacco use [12] . Five of these risks are closely related to inappropriate diet and physical inactivity. One of the key determinants of energy expenditure in youth is taking part in health-enhancing PA, which leads to improved cardiovascular and metabolic fitness as well as bone health [13] . Childhood and adolescence are crucial stages of development where lifestyle habits are formed and set. Young people’s health habits and PA are normally influenced by a number of physical and social environmental determinants. These include: culture, societal norms, attitudes, built environment and climate.
In the UK, sedentary behaviour and low levels of PA are regarded as the key factors in promoting obesity among young people [14] . The excess weight gain which has taken place by the time of adolescence may often have occurred largely by the time children enter primary school [15] . The prevalence of overweight and obesity in the UK has increased significantly with almost one in four children either overweight or obese [16] . Likewise, an alarming level of physical inactivity among the Saudi populations has been reported, as well as poor dietary practices, predisposing them to health problems [17] -[22] . The significant lifestyle changes witnessed in the UK and SA during the last three decades have led to the prevalence of sedentary lifestyle and an ever-increasing rate of obesity amongst young people and adults in these countries [23] [24] .
Unhealthy dietary habits, physical inactivity and excessive BMI are considered to be the main risk factors and a genuine cause for concern amongst youth in both countries. To date, a very limited attempt has been made to examine the interrelationship of these risk factors within youth or to explore the cross-cultural differences in order to design interventions that target these risk factors. Generally, studies that have focused on dietary habits, have failed to examine the relationship between different food practices. However, directional relationships have been identified in several studies. For example, a recent study on Saudi youth aged 10 - 19 years reported a significant positive correlation between sugar-sweetened beverage consumption and poor dietary habits [20] . Also, skipping breakfast has been associated with lower nutritional status and increased risk of cardio-vascular disease [21] , while low fruit and vegetable intake has been associated with low PA [25] .
Hence, the main objectives of this study were to: firstly, assess levels of PA and obesity index of youth from the UK and SA; secondly, investigate the clustering of eight dietary habits, BMI and PA; and thirdly, identify the cross-cultural and demographic characteristics within the clusters. This attempt to explore the relationships between different food habits, BMI and PA cross-culturally should enable health professionals to understand how behaviours cluster together so that they can design more effective intervention strategies.
2. Methods
2.1. Sample and Procedure
The study was carried out in two countries that are culturally and environmentally diverse, the UK and SA. Data was collected in two cities of the UK-“Birmingham” and “Coventry” (henceforth referred to as Central EnglandCE), and one city from SA called “Al-Ahsa”. Birmingham is a large metropolitan and the second largest city in England. Coventry is the second largest city in the Midlands. Both are situated in Central England [26] . Al-Ahsa is the largest governorate in the Eastern Province of SA; it has the second highest population in SA and the longest history of adopting a Western lifestyle with respect to nutritional habits [27] . A total of 2290 young males (1185) and females (1105) aged 15 - 17 years-old from CE and SA volunteered to complete a self-report lifestyle questionnaire on dietary habits and PA, which took approximately 10 minutes to complete. Also, an objective measure of BMI was taken. Prior to data collection, ethical approval from the Institutional Research Ethics Committee was obtained.
A stratified sample representing the different geographical areas in each city was identified; the sample size was determined so that it would be within ±0.05 of the population proportion with a 95% confidence level. Participants were randomly selected from secondary schools in each city. Furthermore, within the participating schools, a random selection of youth from each class was selected (based on class lists) for participation in the study. Informed consent was obtained from all participating schools, guardians and participants prior to data collection. Sampling procedures were also standardised across participating schools and cities. In Birmingham, a total of 637 participants took part, with 329 females and 308 males. In Coventry, a total of 515 participants took part, with 238 females and 277 males. Thus, CE equated to a total of 1152 participants, with 567 females and 585 males with an overall mean age of 15.4 ± 0.67 yrs. In SA, 1138 youth took part, with 538 female and 600 males, with an overall mean age of 16.6 ± 0.64 yrs. Sample characteristics of youth from CE and SA are presented in Table 1.
2.2. Measures
A validated self-report questionnaire in both the Arabic and English languages was used to assess dietary habits and PA [11] [28] . Further details on the adaptation of the questionnaire from Arabic to English language have been reported previously [19] [29] . For greater accuracy, the questionnaire was administered face-to-face by the researchers across participating schools, cities and countries. This enabled the researchers to explain the questionnaire in full prior to completion. It also afforded youth the opportunity of posing any questions before, during or after completing the questionnaire. The questionnaire included the following two sections:
1) PA section: This encompassed a series of questions that included various domains of PA such as household, transport, fitness and sports, representing light-, moderateand vigorous-intensity physical activities. Each physical activity was assigned a MET value based on previous MET compendium guidelines for the PA of adults [30] and youth [31] . The average MET value assigned to moderate intensity sports was 4 METs, whilst vigorous intensity sports were assigned an average value of 8 METs. The equivalent MET value for walking was dependent on self-reported walking pace, with slow (2.8 METs), normal (3.5 METs) and brisk (4.5 METs) walking pace assigned modified values from the compendium of PA for youth [31] [32] . Based upon the metabolic equivalent (MET-min) values of each activity reported by the participant, total energy expenditure per week was calculated (total MET-mins per week). The participants’ level of PA was measured by total METminsper week and the MET-minsper week spent in vigorousand moderate-intensity PA. A cut-off point of 60 minutes per day of at least a moderate level of PA was used to classify overall activity level, based on recent recommendations [33] . This was then converted into two activity categories based on total MET-minsper week as follows: Active: >1680 MET-minsper week (60 minutes × 7 days × 4 METs); and inactive: <1680 METminsper week [34] .
2) Dietary habits section: this included specific questions designed to quantify the frequency of certain dietary habits of youth. The questions covered healthy and unhealthy dietary habits. They comprised questions related

Table 1. Demographic and risk factor composition by country.
*p < 0.05, **p < 0.01, ***p < 0.001.
to how many servings per week does the participant consume breakfast, fruit and vegetables, milk, sugary foods, energy drinks, fried potatoes and fast foods. The fast foods in this regard included some examples from both Western and Middle Eastern fast food choices.
2.3. BMI Measurement
Body weight was recorded using medical weight scales (Seca Ltd., Hamburg, Germany) and participants were weighed barefooted and without excess outer clothing. Weight was measured to the nearest 100 grams. To ensure measurement accuracy, the scale was regularly calibrated in line with the manufacturer guidelines. The weight scales were also checked for a zero reading before each weighing. Height was recorded using a portable height measure (Seca Ltd., Hamburg, Germany), and measurements were recorded to the nearest 0.5 centimetre. All measurements were taken by trained researchers. Height and weight scales were the same across participating schools, cities and countries. BMI was calculated using the formulae: Weight (kg)/Height (m2). In accordance with the International Obesity Task Force (IOTF) criteria, age and gender specific BMI cut-off points were used for overweight and obesity classification [35] .
2.4. Statistical Analysis
Descriptive statistics were utilised to highlight the prevalence of overweight/obesity as well as classifications according to activity index. PA levels and BMI of the youth were analysed according to country and gender using two-way analyses of variance (ANOVA). Additionally, a two-step cluster analysis was used to identify clusters of different risk factors based on dietary habits, BMI and PA (e.g., total MET-minsper week). This is an analysis used to identify subgroups of cases in specific populations based on shared characteristics. The patterns within a cluster are much more similar to each other than they are to a pattern belonging to a different cluster [36] [37] . Clusters are then given names based upon the characteristics of the variables (e.g. dietary behaviour, PA, BMI) that shaped them. The measurement criteria are the pattern within the cluster and how they differ from another cluster. Subsequent analyses such as chi-square and analysis of variance (ANOVA) were used to identify differences between the clusters with regard to cross-cultural (i.e., CE & SA) and demographic characteristics (i.e., gender, age). Analyses were conducted using the Statistical Package for Social Sciences (Version 19, SPSS Inc. Chicago, IL, USA).
3. Results
3.1. Descriptive Statistics
The overall demographic characteristics of the sample are displayed in Table 1. The sample consisted of 2290 youth, 1152 from CE and 1138 from SA. Mean age (±SD) by country was 15.4 ± 0.67 years and 16.6 ± 0.64 years respectively. Gender composition by country consisted of 585 males and 567 females from CE, and 600 males and 538 females from SA. Overall, British youth had a lower BMI and were slightly younger and taller than the Saudi youth. They expended greater energy from PA and exhibited more prevalent healthy dietary practices compared to Saudi youth.
3.2. Individual Risk Factors by Country—Overview
Table 1 further displays the risk factor composition of the sample by country. Descriptive statistics, statistical analysis and effect sizes were reported. There were significant differences in dietary habits between youth from the two countries. Saudi youth participated in less healthy dietary practices than British youth (p < 0.001). Consumption of fast foods and fried potatoes within a week was higher amongst Saudi youth (p < 0.001). Additionally, Saudi youth had a higher BMI and lower levels of PA than the British youth (p < 0.001). However, there was no difference in sugary food intake between the two groups (p > 0.05). Moreover, British youth consumed more energy drinks within a week (p < 0.001) than their Saudi counterparts.
3.3. Differences in Physical Activity Levels
A two-way ANOVA was carried out to test for country, gender and their interactions on PA levels. The analysis confirmed significant differences between country (F(1,2241) = 671.752, p < 0.001, eta squared = 0.216) and gender (F(1,2241) = 410.621, p < 0.001, eta squared = 0.155). British youth were considerably more active than Saudi youth (3774 and 1500 mean total MET-mins per week respectively), and males more active than females (3554 and 1710 mean total MET-mins per week). However, there was no significant interaction between country and gender with regard to PA levels (total MET-mins per week) (p > 0.05). The percentages of “active” youth (males and females combined) in CE and SA were 74.7% and 25.2% respectively (Table 2).
3.4. Differences in BMI Classifications
A second two-way ANOVA was carried out to test for country, gender and their interactions on BMI. The analysis confirmed a significant difference between country (F(1,2241) = 671.752, p < 0.001, eta squared = 0.216) but not for gender (p > 0.05), and there was no significant interaction (p > 0.05). British youth had a lower BMI compared to Saudi youth (mean 22.0 and 24.0 kg/m2 respectively), but there was no significant difference in BMI between males and females in each country. The BMI classifications according to the IOTF are presented in Table 3. These figures indicate that youth from SA have higher prevalence of overweight/obesity compared to CE youth (36.5% and 23% respectively).
Cluster 1 (high risk factors) engaged least with healthy dietary practices compared to the other two clusters; they consumed the fewest servings of fruit and vegetables, breakfast and milk in a week. Also, they participated in less PA and had the highest BMI compared to the other two clusters. They consumed unhealthy foods such as fried potatoes and fast foods at a moderate level compared to Clusters 2 and 3 (Table 4).
Cluster 2 (moderate risk factors) had considerably more behaviours falling into the moderate category compared to Clusters 1 and 3. This cluster was therefore shaped by moderate servings of fruit and vegetable intake per week, moderate breakfast consumption (on average three times per week) and moderate consumption of
Table 2. Levels of physical activity across the two countries.
Table 3. BMI classification according to IOTF across both countries.
milk. The latter dietary behaviours are all associated with healthy food and dietary habits. Also, this cluster seemed to be shaped by moderate PA and BMI (Table 4). Nevertheless, this cluster did report engaging in four unhealthy dietary behaviours at a greater level compared to the other two clusters: consumption of sugary foods (on average five servings per week), fried potatoes (more than five servings per week), fast foods (on average four servings per week) and energy drinks (more than two servings a week) (Figure 1).
Cluster 3 (low risk factors) engaged the most with healthy dietary practices compared to Clusters 1 and 2. They were characterised by better fruit and vegetable intake and high breakfast and milk intake (more than five servings per week). This cluster was the least engaged in unhealthy dietary practices (e.g., fried potatoes & fast food intake), participated most in PA during a week and had the lowest BMI compared to the other two clusters (Table 4). Nevertheless, their consumption of sugary foods and energy drinks was at a moderate level compared to clusters 1 and 2 (Figure 1).
The patterns of cluster affiliation differed across country (χ2(2) = 115.319, p < 0.001, Cramer’s phi = 0.233), gender (χ2(2) = 68.147, p < 0.001, Cramer’s phi = 0.179), and age (F(2,2123) = 27.528 p < 0.001, eta squared = 0.26). Further partitioning of the significant contingency tables for country revealed that there was a significant association between Clusters 1 and 2 and country (χ2(1) = 10.905, p = 0.001, phi = 0.085) with a higher percentage of the Saudi youth (64.0%) in Cluster 1 and a higher percentage of British youth (44.3%) in Cluster 2. There was a significant association between Clusters 1 and 3 and country (χ2(1) = 114.244, p < 0.001, phi = 0.274), with a higher percentage of the Saudi youth (74.0%) in Cluster 1 and a higher percentage of British youth (52.7%) in Cluster 3. There was also a significant association between Clusters 2 and 3 and country (χ2(1) = 46.688, p < 0.001, phi = 0.197), with a higher percentage of the Saudi youth (61.6%) in Cluster 2 and a higher percentage of British youth in (58.4%) in Cluster 3.
Moreover, further partitioning of the significant contingency tables for gender revealed that there was no significant association between Clusters 1 and 2 and gender (χ2(1) = 1.919, p = 0.166, phi = 0.035). Also, there was a significant association between Clusters 1 and 3 and gender (χ2(1) = 48.401, p < 0.001, phi = 0.178), with a higher percentage of the females (70.1%) in Cluster 1 and a higher percentage of males (47.4%) in Cluster 3.
Table 4. Descriptive statistics for the three clusters.
*p < 0.05, **p < 0.01, ***p < 0.001.
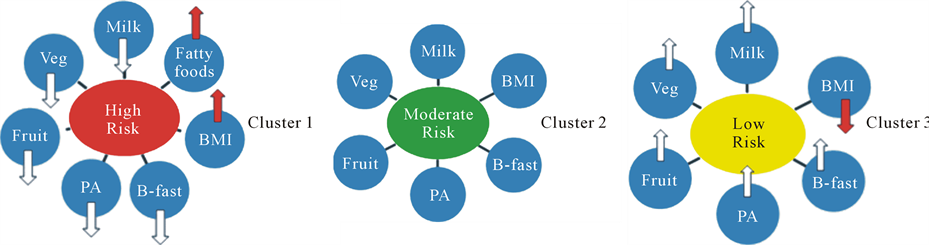
Figure 1. “High”, “moderate” and “low” risk clusters and their associated risk factors.
Likewise, there was a significant association between Clusters 2 and 3 and gender (χ2(1) = 57.593, p < 0.001, phi = 0.219), with a higher percentage of the females (62.1%) in Cluster 2 and a higher percentage of males in (59.9%) in Cluster 3.
The following was depicted for age: Tukey HSD post hoc tests revealed that there were significant differences between each of the clusters (p < 0.05); while older participants fell into Cluster 1 (mean age 16.2), the youngest participants fell into Cluster 3 (mean age 15.8).
4. Discussion
Over the past three decades, the UK and SA have experienced significant lifestyle changes. Consequently, sedentary lifestyle, low levels of PA, and high rates of obesity became widespread amongst youth in these two countries [18] [19] . The sedentary lifestyle seemed to be on the increase despite the multiple health gains associated with a physically active lifestyle; this decline in PA is more evident with the increase in age of both males and females.
It is well known that many complexities exist in understanding why some populations and subpopulations are more susceptible to the drivers of obesity than others, and how mediating factors affect different population groups. To date, most studies have focused on the significance of unhealthy behaviour in isolation from other high risk behaviours, even though research has shown that health behaviours often coexist [25] . The distinctive contribution of this study is evident in its approach to data analysis which examines the clustering of multiple health behaviours of youth using a cluster analytical procedure. The study attempted to investigate dietary habits, BMI and PA cross-culturally to identify possible clusters of behaviours of interest to policy makers, teachers and health professionals alike in the respective countries. Exploring the cross-cultural and demographic characteristics of youth enables policy makers to identify similarities and differences that may inform the development of universal intervention strategies.
Three distinct clusters were identified in this research based upon the variables of interest: Cluster 1 “high risk factors”, Cluster 2 “moderate risk factors” and Cluster 3 “low risk factors”. The largest proportion of the sample fell into Cluster 1 (43.4%), with 61% of this sample being youth from SA. Furthermore, a larger number of females and older youth were in this cluster too. Also, members of this cluster participated least in healthy dietary behaviours, had higher BMI and reported lower PA. These findings alongside the ANOVA outcomes clearly demonstrate that youth in SA are significantly less active and are more likely to be obese than youth from CE. The low levels of PA amongst Saudi youth might be due to environmental and cultural reasons as well as limited availability to suitable facilities for exercise. Moreover, males in both countries seem to report more PA than females. The gender differences found in this study seem to concur with the findings from several other studies indicating that males are generally more physically active than females [25] [38] .
Another interesting finding from the cluster analysis was that individuals in cluster 2 (moderate risk) participated in both healthy and unhealthy dietary behaviours. While energy drink and sugary food consumption was at its highest, PA behaviour and BMI was at a moderate level. The association between immoderate intake of energy drink and sugary food as energy sources for PA behaviour cannot be ruled out here. This may also explain a similar relationship identified in cluster 3.
The weight status classification of youth from the two countries indicates that there is a higher percentage of overweight/obese Saudi youth compared to those from CE. The combined prevalence of overweight/obesity amongst Saudi youth was 36.5%. Additionally, the cluster analysis clearly demonstrates that there are existing patterns between the variables. For example, high BMI is related to low PA behaviour. Engaging in healthy dietary habits is related to lower BMI and higher levels of PA. The findings reaffirm the notion that behaviours should not be considered in isolation from one another.
The relatively high percentages of overweight/obese Saudi youth found in this study appear to concur with findings from other studies on Saudi populations [2] [19] [20] [38] . Overall, youth from SA appeared to be the least active and had the highest prevalence of overweight/obesity compared to youth from CE. The low levels of PA and high percentage of overweight/obese amongst males and females from SA might be related to certain aspects of their lifestyle, dietary habits and environmental factors. For example, using saturated fat in traditional cooking is commonplace in the Gulf countries. A recent study on poor diet quality and food habits of Saudi youth found an increase in dietary intake from fats combined with a high daily consumption of rice, bread and meat which are regarded as the staple diet and included in most meals [21] . This seems to concur with other studies on youth that found obese children and adolescents consume significantly more servings of meat, grain products, fast foods, sugar, sweetened drinks and potato chips compared to non-obese children and adolescents [22] .
Generally, engagement in PA by young people in SA is not regarded as a desired leisure time pursuit due to cultural attitudes and beliefs. It is commonly perceived that the quest for academic excellence has greater status and given higher priority than participation in other activities. Usually, parents encourage their children to engage in educational and spiritual activities rather than leisure time activities. This unfavourable approach towards PA is further compounded by the harsh desert environment for a substantial part of the year and the absence of appropriate outdoor and indoor facilities for exercise. Moreover, attitudes, societal norms and expectations of communities in SA are generally less amenable towards involvement in sporting activities that require adherence to particular forms of dress [18] [19] [38] .
The findings of the study should be considered within the context of its limitations. Firstly, in the absence of more accurate knowledge relating to the body composition or biological age of the youth, the use of BMI cut-off points for overweight and obesity classification complicate data interpretation particularly for borderline individuals. Furthermore, height/weight curves for youth are not linear. The lower BMI in the UK youth may in part, be due to the fact that the UK youth were marginally younger than the SA youth. The differences found here need to be interpreted with this point in mind. Secondly, self-report measures of behavior may be subject to social desirability bias, and the differences in maturation status between youth from the two countries may have affected obesity classification. Therefore, future studies could consider utilising a mixed approach in data collection through both objective and self-report measures of PA. Also, the youths’ perceptions could be recorded through focus groups and interviews to further explore other causes and aspects of their lifestyle and health behaviours.
5. Conclusion
The lifestyle and nutritional habits of young people in both developed and developing countries have undergone a major transformation over the past few decades. This is particularly evident in high-income countries such as the UK and SA, where a sedentary lifestyle and an unhealthy diet that is based on high-density processed food offered by a huge range of fast food outlets has contributed to a low level of PA and a high rate of obesity amongst young people. While males from both the UK and SA had healthier lifestyle and dietary habits than females, the younger the youth the healthier the lifestyle and dietary habits they have. Overall, the youth from the UK seemed to pursue a comparatively healthier lifestyle and follow better dietary habits than SA youth. However, these findings reveal a worrying picture of young people’s lifestyle and have important practical implications for both countries and will be of interest to policy makers, teachers and health professionals. Furthermore, exploring the cross-cultural and demographic characteristics of youth enables the identification of similarities and differences that might lead to the development of universal intervention strategies. The findings further reaffirm the notion that health practices tend to occur in clusters rather than in isolation and indicate that one should consider the patterns within these clusters of behaviours when planning policies and designing intervention strategies regarding nutritional habits, PA and obesity of youth.
Acknowledgements
The authors wish to thank Professor Alan Nevill for his advice with respect to data handling and analysis. The authors also wish to thank Dr Mike Duncan for his help and advice.
References
- Department of Health, Physical Activity, Health Improvement and Protection (2004) At Least Five a Week: Evidence on the Impact of Physical Activity and Its Relationship to Health. London.
- Al-Nuaim, A.R., Al-Mazrou, Y., Al-Rubean, K., Al-Attas, O., Khoja, T. and Al-Daghari, N. (1997) National Chronic Metabolic Diseases Survey Part II. The Prevalence at National and Regional Level. The Sociodemographic, Clinical and Chemical Characteristics, In-Depth Analysis. Ministry of Health and King Saud University, Riyadh.
- The Sedentary Behaviour and Obesity Expert Working Group (2010) Sedentary Behaviour and Obesity: Review of the Current Scientific Evidence. Department of Health, London.
- Dumith, S.C., Gigante, D.P., Domingues, M.R. and Kohl III, H.W. (2011) Physical Activity Change during Adolescence: A Systematic Review and a Pooled Analysis. International Journal of Epidemiology, 3, 685-698. http://dx.doi.org/10.1093/ije/dyq272
- Swinburn, B.A., Sacks, G., Hall, K.D., McPherson, K., Finegood, D.T., Moodie, M.L. and Gortmaker, S.L. (2011) The Global Obesity Pandemic: Shaped by Global Drivers and Local Environments. The Lancet, 378, 804-814.
- Sassi, F., Devaux, M., Cecchini, M. and Rusticalli, E. (2009) The Obesity Epidemic: Analysis of Past and Projected Future Trends in Selected OECD Countries. Organisation for Economic Co-Operation and Development (OECD), Directorate for Employment, Labour and Social Affairs, Health Committee, Paris.
- WHO (2003) Reducing Risks, Promoting Healthy Life. World Health Organization, Geneva.
- Finucane, M.M., Stevens, G.A., Cowan, M.J., Danaei, G., Lin, J.K., Paciorek, C.J., Singh, G.M., Gutierrez, H.R., Lu, Y., Bahalim, A.N., Farzadfar, F., Riley, L.M. and Ezzati, M. (2011) National, Regional, and Global Trends in BodyMass Index Since 1980: Systematic Analysis of Health Examination Surveys and Epidemiological Studies with 960 Country-Years and 9.1 Million Participants. The Lancet, 377, 557-567.
- Lobstein, T. and Leach, R. (2007) Tackling Obesities: Future Choices—International Comparisons of Obesity Trends, Determinants and Responses—Evidence Review. Government Office for Science, London.
- Wang, F. and Lobstein, T. (2006) Worldwide Trends in Childhood Overweight and Obesity. International Journal of Pediatric Obesity, 1, 11-25. http://dx.doi.org/10.1080/17477160600586747
- Al-Hazzaa, H.M. and Musaiger, A.O. (2010) Physical Activity Patterns and Eating Habits of Adolescents Living in Major Arab Cities. The Arab Teens Lifestyle Study. Saudi Medical Journal, 2, 210-211.
- WHO (2002) Reducing Risks, Promoting Healthy Life. World Health Organization, Geneva.
- Physical Activity Guidelines Advisory Committee (2008) Physical Activity Guidelines Advisory Committee Report. US Department of Health and Human Services, Washington DC.
- Reilly, J.J. (2006) Tackling the Obesity Epidemic: New Approaches. Archives of Disease in Childhood, 9, 724-726. http://dx.doi.org/10.1080/17477160600586747
- Gardner, D.S.L., Hosking, J. and Metcalf, B.S. (2009) Contribution of Early Weight Gain to Childhood Overweight and Metabolic Health. Pediatrics, 123, e67-e73. http://dx.doi.org/10.1542/peds.2008-1292
- Reilly, J.J., Okely, A.D., Almond, L., Cardon, G., Prosser, L. and Hubbard, J. (2010) Making the Case for UK Physical Activity Guidelines for Early Years: Recommendations and Draft Summary Statements Based on the Current Evidence. Working Paper, Department of Health, London.
- Al-Nozha, M.M., Al-Hazzaa, H.M., Arafah, M., Al-Khadra, A., Al-Mazrou, Y.Y., Al-Maatouq, M.A., Khan, N.B., Al-Marzouki, K., Al-Harthi, S.S., Abdullah, M and Al-Shahid, M.S. (2007) Prevalence of Physical Activity and Inactivity among Saudis Aged 30 - 70 Years: Population-Based Cross-Sectional Study. Saudi Medical Journal, 28, 559- 568.
- Al-Hazzaa, H. (2004) Prevalence of Physical Inactivity in Saudi Arabia: A Brief Review. Eastern Mediterranean Health Journal, 10, 663-670.
- Al-Nakeeb, Y., Lyons, M., Collins, P., Al-Nuaim, A., Al-Hazzaa, H., Duncan, M. and Nevill, A. (2012) Obesity, Physical Activity and Sedentary Behavior amongst British and Saudi Youth: A Cross-Cultural Study. International Journal of Environmental Research and Public Health, 9, 1409-1506. http://dx.doi.org/10.3390/ijerph9041490
- Al Qauhiz, N.M. (2010) Obesity among Saudi Female University Students: Dietary Habits and Health Behaviours. Journal of the Egyptian Public Health Association, 85, 45-59.
- Washi, S.A. and Ageib, M.B. (2010) Poor Diet Quality and Food Habits Are Related to Impaired Nutritional Status in 13- to 18-Year-Old Adolescents in Jeddah. Nutrition Research, 30, 527-534. http://dx.doi.org/10.1016/j.nutres.2010.07.002
- Gillis, L.J. and Bar-Or, O. (2003) Food Away from Home, Sugar-Sweetened Drink Consumption and Juvenile Obesity. Journal of the American College of Nutrition, 22, 539-545. http://dx.doi.org/10.1080/07315724.2003.10719333
- James, P.T. (2004) Obesity: The Worldwide Epidemic. Clinics in Dermatology, 22, 276-280. http://dx.doi.org/10.1016/j.clindermatol.2004.01.010
- El Mouzan, M.I., Foster, P.J., Al Herbish, A.S., Al Salloum, A.A., Al Omer, A.A., Qurachi, M.M. and Kecojevic, T. (2010) Prevalence of Overweight and Obesity in Saudi Children and Adolescents. Annals of Saudi Medicine, 30, 203- 208. http://dx.doi.org/10.4103/0256-4947.62833
- Dodd, L., Al-Nakeeb, Y., Nevill, A. and Forshaw, M.J. (2010) Lifestyle Risk Factors of Students: A Cluster Analytical Approach. Preventative Medicine, 51, 73-77. http://dx.doi.org/10.1016/j.ypmed.2010.04.005
- Office of National Statistics (2011) Local Area Statistics: Birmingham. Office of National Statistics, London.
- Central Department of Statistics and Information (2005) Demographic Research Bulletin 2004. Central Department of Statistics and Information, Riyadh.
- Al-Hazzaa, H. and Al-Ahmadi, M. (2003) A Self-Reported Questionnaire for the Assessment of Physical Activity in Youth 15 - 25 Years: Development, Reliability and Construct Validity. Arab Journal of Food Nutrition, 4, 279-291.
- Del Greco, L., Walop, W. and Eastridge, L. (1987) Questionnaire Development: 3. Translation. Canadian Medical Association Journal, 136, 817-818.
- Ainsworth, B.E., Haskell, W.L., Whitt, M.C., Irwin, M.L., Swartz, A.M., Strath, S.C., O’Brien, W.L., Bassett, D.R., Schmitz, K.H., Emplaincourt, P.O., Jacobs, D.R. and Leon, A.S. (2000) Compendium of Physical Activities: An Update of Activity Codes and MET Intensities. Medicine and Science in Sports and Exercise, 32, s498-s516. http://dx.doi.org/10.1097/00005768-200009001-00009
- Ridley, K., Ainsworth, B.E. and Olds, T.S. (2008) Development of a Compendium of Energy Expenditures for Youth. International Journal of Behavioural Nutrition and Physical Activity, 5, 1-8. http://dx.doi.org/10.1186/1479-5868-5-45
- Bauman, A., Bull, F., Chey, T., Craig, C.L., Ainsworth, B.E., Sallis, J.F., Bowles, H.R., Hagstromer, M., Sjostrom, M. and Pratt, M. (2009) The International Prevalence Study on Physical Activity: Results from 20 Countries. International Journal of Behavioural Nutrition and Physical Activity, 6, 21. http://dx.doi.org/10.1186/1479-5868-6-21
- WHO (2010) Global Recommendations on Physical Activity for Health. WHO Press, Geneva.
- Kesaniemi, A., Riddoch, C.J., Reeder, B., Blair, S.N. and Sorensen, T. (2010) Advancing the Future of Physical Activity Guidelines in Canada: An Independent Expert Panel Interpretation of the Evidence. International Journal of Behavioural Nutrition and Physical Activity, 7, 41. http://dx.doi.org/10.1186/1479-5868-7-41
- Cole, T.J., Bellizzi, M.C., Flegal, K.M. and Dietz, W.H. (2000) Establishing a Standard Definition for Child Overweight and Obesity Worldwide: International Survey. British Medical Journal, 320, 1240-1243. http://dx.doi.org/10.1136/bmj.320.7244.1240
- Everitt, B., Landau, S. and Leese, M. (2001) Cluster Analysis. Oxford University Press, New York.
- Hair, J.F., Black, W.C., Babin, B.J. and Anderson, R.E. (2005) Multivariate Data Analysis. Prentice Hall, Upper Saddle River.
- Al-Nuaim, A.A., Al-Nakeeb, Y., Lyons, M., Al-Hazzaa, H.M., Nevill, A., Collins, P. and Duncan, M. (2012) The Prevalence of Physical Activity and Sedentary Behaviours Relative to Obesity among Adolescents from Al-Ahsa, Saudi Arabia: Rural versus Urban Variations. Journal of Nutrition and Metabolism, 2012, Article ID: 417589.