Open Journal of Physical Chemistry
Vol. 2 No. 4 (2012) , Article ID: 24975 , 10 pages DOI:10.4236/ojpc.2012.24033
Influence of Single Use and Combination of Reductants on the Size, Morphology and Growth Steps of Gold Nanoparticles in Colloidal Mixture
1National Nanotechnology Research Center, King Abdulaziz City for Science and Technology, Riyadh, Saudi Arabia
2Leibniz-Institute for Catalysis at University of Rostock, Rostock, Germany
Email: *aalshammari@kacst.edu.sa
Received July 9, 2012; revised August 11, 2012; accepted September 13, 2012
Keywords: Colloidal Gold Nanoparticles; Reducing Agents; Size Distribution; Morphology
ABSTRACT
A comprehensive investigation on the formation mechanism of gold nanoparticles (AuNPs) in colloidal mixture obtained from the reduction of chloroauric acid (HAuCl4) solution using a single reducing agent (sodium citrate; process-I), (tannic acid; process-II), and a combination of two reducing agents (sodium citrate plus tannic acid; process-III) is reported. The growth steps at different time intervals during synthesis of colloidal AuNPs were monitored in situ and ex situ using various methods for all the three processes. The measurement of changes in the surface plasmon band position of colloidal AuNPs, along with dynamic light scattering results gave important information for the first assessing of particle size, shape and distribution. Besides, the size and morphological changes at different stages during different processes were also analyzed by transmission electron microscopy. The final Au particles of processes-I & II exhibited different shapes (spherical and nanowires) with particle size and nano wire diameter of 12 nm and 17 nm, respectively. Nevertheless, combination of two reductants (process-III) surprisingly leads to drastically reduced size (ca. 3 nm) with spherical morphology compared to their parent solutions with either of single reducing agent. This result clearly indicates that the combination of reductants has a significant influence on the particle size, morphology and formation mechanism.
1. Introduction
Metal nanoparticles (NPs) have been the subject of extensive research in recent times due to their fascinating size-dependent electrical, optical, physical and chemical properties [1-3]. In particular, colloidal gold nanoparticles (AuNPs) have attracted increasing research attention in the field of nanocatalysis [4-8]. Since the properties of AuNPs strongly depend on their size, size distribution and shape [9,10]. Many studies on colloidal AuNPs have been focused on the control of their morphology, which also directly correlates to the catalytic activity [11-12].
Several approaches have been reported for the preparation of colloidal AuNPs such as conventional chemical reduction [13], radiation chemical reduction [14], and photochemical reduction [15]. The most simple and widely used method to synthesize colloidal AuNPs is the reduction of chloroauric acid (HAuCl4) with sodium citrate, a method pioneered by Turkevich et al. [16]. Ingeneral, such type of preparation method involves the formation of NPs mainly in three different stages such as 1) an initial step of reduction process of ionic Au3+ species, 2) a second step of formation of nuclei, and 3) a third step of particle growth. The first and second steps are somewhat difficult to identify due to the involvement of ionic species during synthesis while the third step can easily be detected due to the growth process of the particles. La Mer firstly reported the formation process of mono-dispersed particles [17]. This model showed that formation of seed occurred, which then proceeds by its successive growth of the particles. In addition, Chow and Zukoski [18] investigated the formation mechanism of particles at different conditions and proposed that aggregation of nanocrystals occurred at low reaction temperatures. A mechanism proposed by Watzky and Finke [18] showed that the nucleation process was rather slow, which resulted in nearly monodisperse size distribution. Among several proposals, the most accepted mechanism suggests a two-step process, i.e. nucleation followed by successive growth of particles. It was also reported elsewhere [19,20] that different morphologies of AuNPs such as rod-like particles or polyhedrons could be obtained during the further growth of gold seed particles. In addition, the formation mechanism of colloidal particles in presence of stabilizers (i.e. probucol/polyvinylpyrrolidone (PVP)) ensuring high dispersion was also investigated [21]. A recent work presented results on the photo-reduction of gold ionic species in aqueous surfactant solutions of dodecyltrimethylammonium chloride and polyethylene glycol lauryl ether [22]. Furthermore, some theoretical studies on the growth mechanism of colloidal AuNPs were also reported [23,24]. Even though some articles appear sporadically, systematic investigations approved with different spectroscopic and microscopic techniques, which monitor the formation growth mechanism of colloidal AuNPs, are still missing in the literature. In addition, studies on the application of two reducing agents on the size of AuNPs are very rare in the literature [25]. It is assumed that the second reductant has an additional reducing and protecting effect during colloidal gold formation as claimed elsewhere [26]. Therefore, there is a need to explore and understand the growth process of AuNPs in suspension, which certainly allows a tailor-made synthesis regarding catalytic applications. Furthermore, most of these studies listed above have used single reducing agents for AuNPs formation. To the best of our knowledge, there is not even single source of publication on exploring the growth steps of AuNPs formation at different stages of synthesis using the combination of two or more reducing agents.
Against this background, the present study is aimed at investigating the influence of combination of two reducing agents on the size, distribution and morphology of AuNPs during the formation process in colloidal mixture and compares such results with that of those obtained from the usage of single reducing agent. We further make attempts to understand the formation growth mechanism of such colloidal AuNPs in more detail. The objective is also to characterize these materials by various techniques such as UV-vis, TEM, zeta potential, and DLS for better understanding of growth process and material properties.
2. Experimental Section
2.1. Materials
Tetrachloroauric acid (HAuCl4·3H2O) and tri-sodium citrate dihydrate (C6H5Na3O7·2H2O; SC) were purchased from Fluka. Tannic acid (C76H52O46; TA) was obtained from Sigma-Aldrich. All chemicals were used as received. All solutions were prepared with distilled water.
2.2. Experimental Procedure
Process-I (single reducing agent-SC): 0.186 mmol of 1.0 mM HAuCl4 solution was heated in a 400 ml beaker to 60˚C. In a second vessel, 0.75 mmol of 15.0 mM SC solution was also heated to 60˚C. In a typical experiment, the solution of SC was added at once and quickly to the solution of HAuCl4 under stirring (1000 rpm). 20 seconds after mixing, a 50 ml aliquot of the reaction mixture was assayed for characterization. The sampling procedure was repeated and aliquots were taken from the reaction mixture at different reaction intervals in the range of 0 - 60 min.
Process-II (single reducing agent-TA): The same procedure and similar reaction conditions/concentrations as described above were applied except the type of reducing agent. The samples were assayed at three different time intervals such as 2, 5 and 9 sec, respectively due to fast reduction by TA as strong reducing agent.
Process-III (combination of two reducing agents-SC & TA): The same procedure and similar reaction conditions/ concentration as described above were applied. However, instead of using a single reductant, a combination of two reducing agents such as SC (7.5 mM) plus TA (7.5 mM) was used. Samples were collected at different time intervals (i.e. 2, 6 and 10 sec).
2.3. Analytical Methods
Ultraviolet-visible Spectroscopy (UV-vis): The optical properties (absorbance) of colloidal solutions were acquired with a UV-vis spectrometer (Avantes-2048, light source combined deuterium-halogen). The spectra were collected over a range of 200 - 1100 nm (with an optical path length of 0.4 cm) as a function of reaction time by directly dipping the optical probe in the reaction vessel under constant stirring.
Dynamic Light Scattering (DLS): Size, size distribution and zeta potential of colloidal AuNPs were determined using DLS with Malvern Instruments Zetasizer (ZS ZEN 4003) at room temperature. Samples were assayed at defined times from the reaction and transferred to cuvette for size and size distribution analysis.
Transmission Electron Microscopy (TEM): Size analysis of colloidal AuNPs was carried out using HRTEM JEM-2100F at a voltage of 200 kV. The samples were prepared by mounting a drop of the aqueous suspension containing the AuNPs on a carbon grid, which then was placed on filter paper to absorb excess solvent. The average particle diameter and size distribution were calculated using Java image tool software (Image J), based on the data of an average of 100 - 150 particles.
3. Results and Discussion
3.1. Formation of Colloidal Aunps with SC (Process-I)
The simultaneous mixing of HAuCl4 and SC solutions used in process-I led to the formation of colloidal AuNPs by the appearance of the typical ruby-red color of the final slurry. During the course of AuNPs growth, a succession of color changes in the reaction solution was observed passing from pale yellow to colorless, grey, light blue, purple, ruby and finally to red (Figure 1). No further change in the color of the gold suspension was observed after 60 min of reduction indicating completion of reaction. This applied preparation method is similar to those reported previously [15,26] but the aim of the present investigations was focused on comparative in-situ and ex-situ studies to understand the growth steps involved at different stages of synthesis.
First, UV-vis spectroscopy was applied as an effective method to illustrate the evolution of metallic species during the formation of colloidal metal clusters [27]. Absorbance or wavelength of Surface Plasmon (SP) band provides a measure of particles size, shape, morphology, concentration, and dielelectric medium properties [28,29]. The in-situ measurement of SP band during the origination of AuNPs certainly provides useful information of assessing the reaction kinetics. Colloidal AuNPs are known to exhibit a strong absorption in the visible range (380 - 780 nm) due to Localized Surface Plasmon Resonance (LSPR), which is caused by collective oscillations of the conduction electrons upon excitation with visible light [30]. Mie first described the theoretical basis of this behavior [31]. Besides, changes in the wavelength and bandwidth (Full Width at Half Maximum—FWHM) of this SP band depend significantly on various factors such as particle size [32,33], shape [34], dielectric environment [35], and the sign and size of the core charge [36,37]. The formation kinetics was followed by measuring changes in the absorption bands of resulting AuNPs at the maximum absorption wavelength (λmax). As reported elsewhere [29,38,39], the position of the absorption band of metal species strongly depends on the size and length of the nanoclusters. The time-resolved UV-vis spectra obtained during the reduction of HAuCl4 with SC are shown in Figure 2. The evolution of the band position revealed the formation history of the AuNPs. The base spectrum of pure HAuCl4 solution (light yellow in color, i.e., before mixing with reducing agent) showed no distinct absorption in the range of 400 - 1000 nm. However, upon the addition of SC solution to HAuCl4 solution, the initial light yellow solution became colorless, indicating
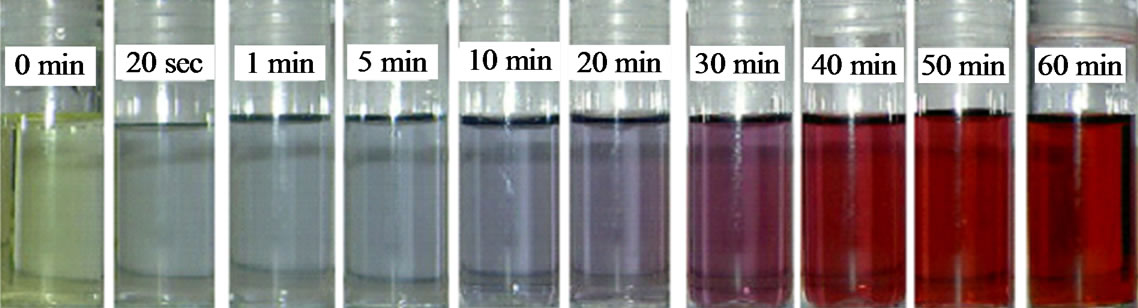
Figure 1. Color changes of the reaction solution during the course of colloidal AuNPs formation with SC as reductant.
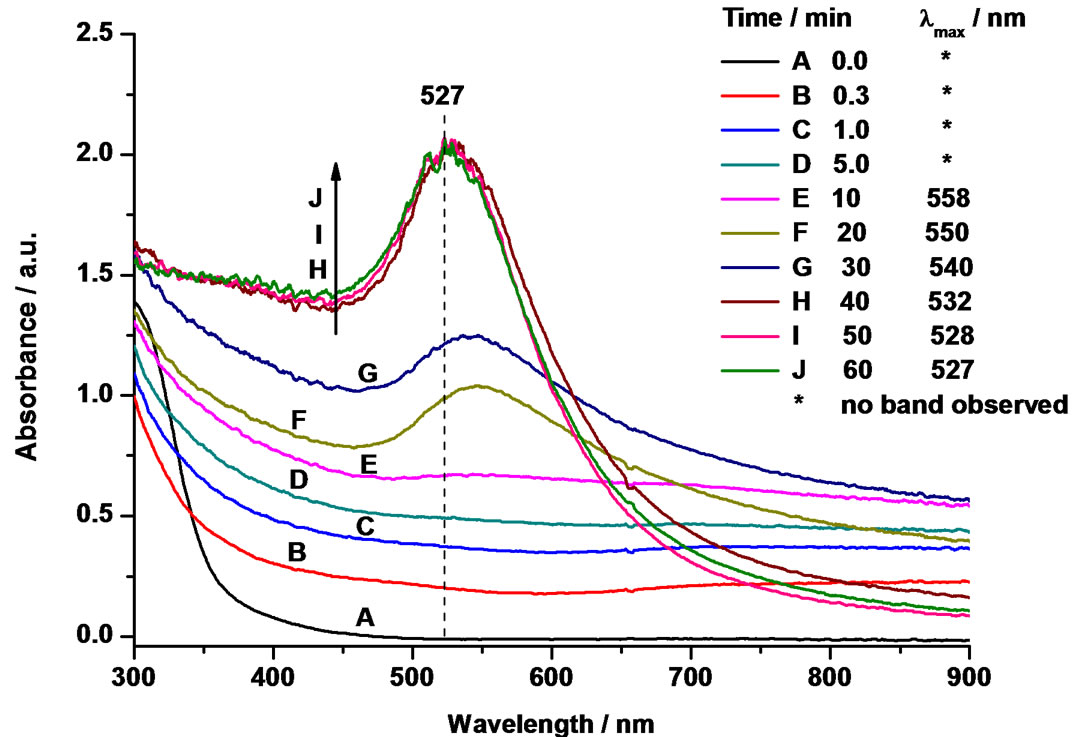
Figure 2. Time-resolved UV-vis spectra during the reduction of 1.0 mM HAuCl4 solution with 15 mM SC solution at 60˚C and an [Au3+]/[SC] ratio of 1:4.
the beginning of the reduction process. After 0.3, 1 and 5 min of reaction time, a considerable change in the color of colloidal solution could be observed by both visibly and analytically by recording the UV-vis absorption spectra, particularly in the range of 500 - 550 nm. Even though, no clear SP bands were found in UV-vis spectra, the base spectrum was found to be shifted upwards. Hence, one can assume that larger flower-like Au nanocrystals were probably formed during the initial stages of the reduction, which could not exhibit any SP band in the visible range between 400 - 1000 nm. Therefore, this band might be red-shifted, however, this was not detectable with our UV-vis instrument [40]. As a matter of support to this assumption, some previous reports [41,42] also claimed that very large nanoparticles absorb and scatter light in the near-infrared and mid-infrared region of the spectrum. On the other hand, TEM could provide further hints on the formation of expected flower-like nanocrystals. To confirm such proposition, TEM analysis at different stages of reaction was also carried out and discussed below in a separate section. However, after 10 min of reaction time, a flat absorbance band with a broadening of the curve profile begins to appear. As the reaction progressed further (20 - 30 min), symmetrical SP bands distinctly appeared at 550 and 540 nm, respectively. Finally, when the solution turned to ruby-red after 50 - 60 min, the SP band continued to exhibit a blue-shift with a peak maximum at 528 nm, and at the same time the peak was narrowed, which is a clear indication for the formation of colloidal AuNPs. There-after, this ruby-red color remained constant over two months, indicating good stability of such gold colloids. Additionally, in good agreement with the literature, the present results revealed strong evidence that the position of the absorption band strongly depends on the size and shape of the nano-clusters [43].
As mentioned above, various steps involved during the course of AuNPs formation were also tracked by TEM, and the results are shown in Figure 3. Here four main stages of AuNPs development were observed: 1) in the very initial stage (Figure 3(a), after 1 min, colorless solution), the formation of large nanocrystals having flower-like morphology was observed. Individual flowerlike or flake-like nanoclusters reached sizes between 80 - 100 nm with irregular shapes. Such type of AuNPs shape has also been reported elsewhere [44]. This result undeniably supports the view observed from UV-vis spectra. At initial stages of reduction, large nanocrystals were formed which might exhibit SP bands at higher wavelengths (in the region of near IR) that is beyond the scope of the detection limit (400 - 1000 nm) and hence no clear bands could be detected in UV-vis spectra under this set of conditions (see Figure 2). 2) Subsequently, wire-like networks with a smaller diameter ranging from 10 - 20 nm were observed when the reaction time was prolonged to 10 min (Figure 3(b), light blue solution). These wirelike networks exhibited a Face-Centered Cubic (FCC) lattice with distinct facets that mostly showed Au(200) lattice planes. However, such wire-like structures could not be verified again with UV-vis spectra (see Figure 2: 10 and 20 min) but some indirect hints from the shift in the band position could be realized. Wang and co-workers [45] reported that the corresponding absorption band of gold nano-wires gave an extremely broadened band in the range of 650 - 1000 nm due to the longitudinal mode of the SP absorption and depending on the aspect ratio of the nanochains. In addition, it is reported elsewhere [46] that the colloidal solution having a nanowires structure gives a blue suspension, which is in good agreement with our results. Link and El-Sayed [37,47] also observed a strong longitudinal SP absorption band in the range of 700 - 1000 nm in the case of AuNPs with cylindrical shape and various aspect ratios. Nevertheless, none of such phenomena was observed in the present experiments. 3) When the reaction solution started becoming purple after 30 min, these nano-wires began to breakdown to form NPs with a diameter ranging from 12 to 16 nm (Figure 3(c)). 4) The final stage was observed after a period of 60 min where TEM images showed highly uniform NPs with an average diameter of 12 nm and a polyhedral, sphere-like morphology with some spherical particles exhibiting (111) and (200) lattice planes (Figure 3(d)). Interestingly, no further change in the morphology of the particles was observed after 60 min. The large aggregates of Au flower-like nanocrystals observed in the first stage (see Figure 3(a)) may be later separated due to the absorption of citrate ions on the surface of the gold particles, which may affect a strong repelling layer preventing the nanoparticles from coming into close contact [48].
Furthermore, supporting investigations regarding the formation of such colloidal AuNPs were also conducted using other technique such as DLS, which provide a more direct measurement of colloidal AuNPs in solution. DLS measures the hydrodynamic diameter of particles (solvation sphere) including agglomerates. Figure 4 portrays time-resolved size distribution curves recorded by DLS during the reduction with SC over a period of 60 min. Initially, the average diameter of the gold cluster amounted to 220 nm immediately after the addition of SC to HAuCl4 solution. When the reaction progressed, the average particle diameter rapidly decreased, indicating disaggregation of the Au nano-clusters flakes to a size of about 30 - 25 nm after 10 - 20 min. Finally, the smallest AuNPs with an average size of ca.13 nm appeared after 60 min. Interestingly, these small nanoparticles did not change further even after 2 hours of reaction time. This evidence well supports the observations made above by TEM analysis.
3.2. Formation of Colloidal AuNPs with TA (Process-II)
Additionally, colloidal AuNPs were also synthesized using other type of single reducing agent such as Tannic Acid (TA). Figure 4 shows a typical example of the variation of suspension color when the reductant to the gold chloride solution is added. Upon the addition of TA, the initial yellow solution (at 0 sec) became light blue
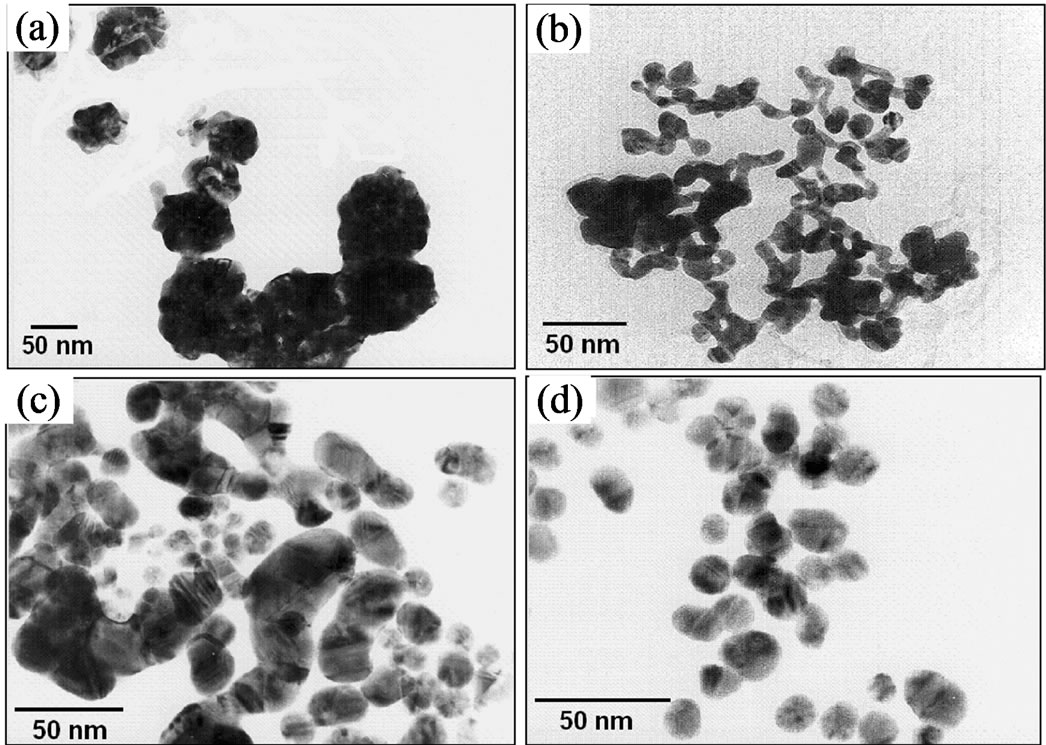
Figure 3. TEM images taken during the formation of colloidal AuNPs obtained by reduction of 1.0 mM HAuCl4 solution with 15 mM SC solution at 60˚C and an [Au3+]/[SC] ratio of 1:4 at reaction time of (a) 1 min; (b) 10 min; (c) 30 min; and (d) 60 min.
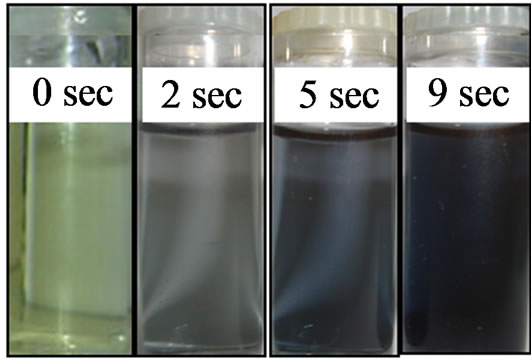
Figure 4. Color changes of the reaction solution during the course of colloidal AuNPs formation with TA as reducing agent.
within 2 sec indicating that the first stage of the reduction took place. Subsequently, the solution turned from light blue to blue (5 sec), which finally transferred to dark blue within 9 sec. No further change was observed afterwards, which indicates the completion of the reaction. In addition to the physical observation of color changes at different time intervals, the corresponding changes in the morphology and size distribution was also characterized using different methods, which are reported below one after the other.
Figure 5 illustrates UV-vis absorption spectrum colloidal AuNPs recorded from the suspension during the reduction process that corresponding to different reaction times (i.e. 2, 5 and 9 sec). The appearance of broad absorption band in the range from 500 to 900 nm observed after 2 sec provides indirect hints on the formation of nanowires, which is however confirmed from TEM. No further change in the plasmon band position and shape was observed even after 9 sec. However, it is interesting to note that clear changes in the color of colloidal solution were watched at different times (from yellow to dark blue). As we have described earlier on the usage of SC alone, Au nanowires showed a flat absorption pattern with a broad peak observed from 500 to 900 nm (see Figure 3(b)). Similar such observation of broadening plasmon band when nanowires are formed is also reported elsewhere [47]. From this result, it can be speculated that the reduction of gold ions by TA is producing gold metal having nanowires morphology. Such phenomena of nanowires structure can also be found in the literature as supporting evidence [46].
The corresponding TEM images of colloidal AuNPs obtained at different reaction times are shown in Figure 6. TEM images confirmed that the gold particles are in nanowires shape. At the early stage (Figure 6(a), after 2 sec, light blue solution), Au nanowires extended from a big nanostructure. After 5 sec (blue solution), a clear Au nanowires shape was observed with diameter of approximately 17 nm as shown in Figure 6(b). At final stage (Figure 6(c), 9 sec, dark blue), the large aggregates
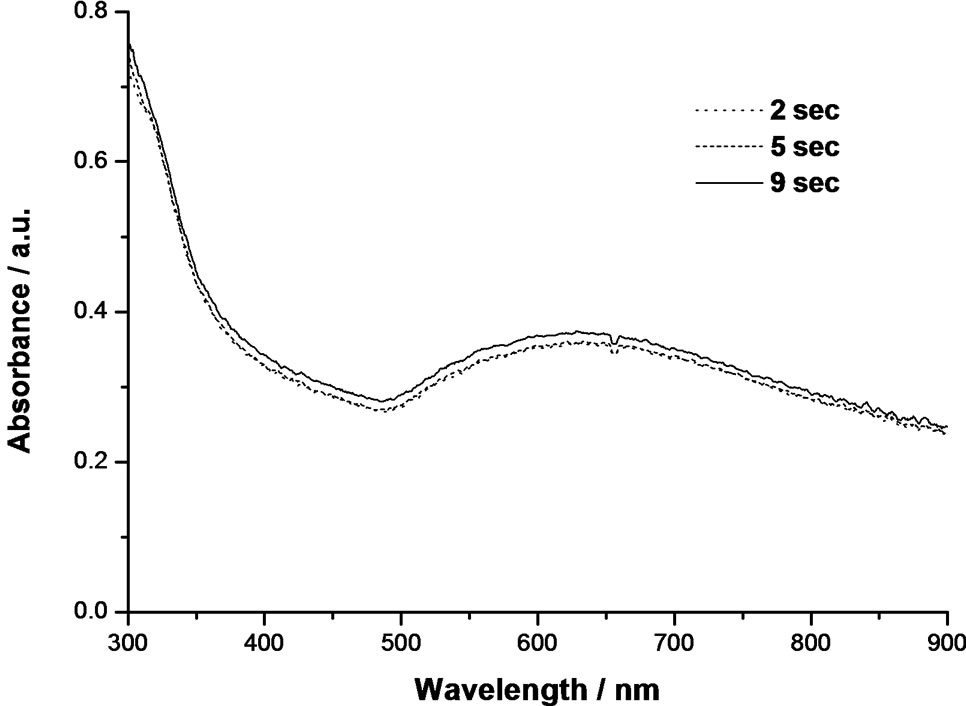
Figure 5. Time-resolved UV-vis spectra during the reduction of 1.0 mM HAuCl4 solution with 15 mM TA at 60ºC.
of Au nanowires was observed due to instability of AuNPs prepared using tannic acid, which is also confirmed using zeta potential instrument. The nanowires network remained without changes after 5 min of reaction, which corresponded to the broad absorption spectrum of gold colloids. Based on this observation, such nanowires structure was also reported in the very early stage when the gold ions reduced by SC (Figure 3(b)).
Furthermore, the histogram obtained from DLS (not shown here) depicts the evolution of gold colloids of average sizes between 16 and 45 nm vs. reaction time. Another interesting observation is that the formation process of colloidal AuNPs using TA was extremely fast, which was completed within 9 sec. Such quick reduction is expected from the stronger nature of reducing agent. At first stage, a broad size distribution with an average particle size of 35 nm was recorded in the suspension. After that, the average size was slightly decreased from 35 to 31 nm. The final stage showed a better distribution with average size of 27 nm.
3.3. Formation of Colloidal AuNPs by Combination of SC and TA (Process-III)
Further studies were focused on the application of combination of two reducing agents (process-III) and check their influence on the size and growth steps. The application of a mixture of SC and TA surprisingly caused an extremely faster reduction compared to SC while comparable time with that of TA when used as single reducing agent. Some changes in the color of the solution were also observed during the formation process of AuNPs using a combination of SC and TA. Such changes are shown in Figure 7.
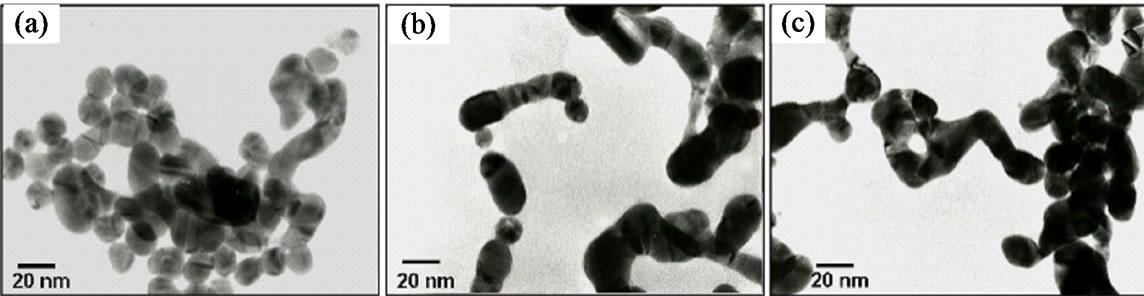
Figure 6. TEM images taken during the formation of colloidal AuNPs obtained by reduction of 1.0 mM HAuCl4 solution with 15 mM TA solution at 60ºC at reaction time of (a) 2 sec; (b) 5 sec; and (c) 9 sec.
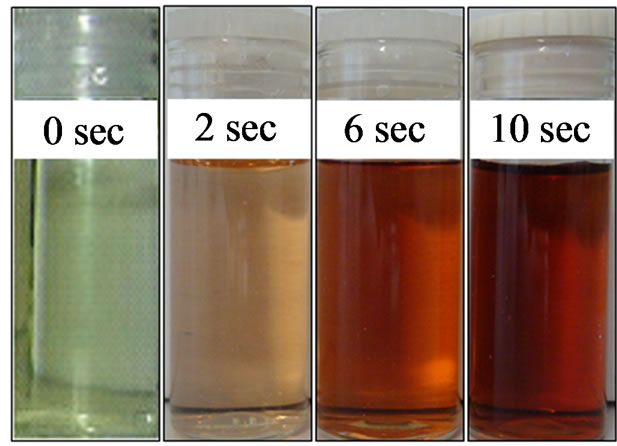
Figure 7. Color changes of the reaction solution during the course of colloidal AuNPs formation with a combination of SC and TA as reducing agent.
The light yellowish solution of starting materials turned to yellow-orange immediately after the addition of the mixture of SC and TA (after 2 sec), which then turned to orange-red (6 sec), and the final colloidal solution exhibited a ruby-red color within 10 sec. The stirring of the solution was continued for another 5 min, but no further change in color was observed. Hence, it can be considered that the completion of reduction is achieved within 10 sec.
In addition, the samples were also collected at different stages of reduction and characterized by UV-Vis, TEM and DLS techniques with a view to follow the growth steps. Figure 8 shows the UV-Vis spectra monitoring the formation of AuNPs at different reaction times. Amazingly, the maximum of plasmon band position was recorded in the region of around 520 nm (even after 2 sec), which is a characteristic of the formation of AuNPs. This result points to the fact that the formation of AuNPs with spherical morphology is occurring within the very first stage (2 sec). This observation completely differs from the usage of any of single reducing agents. In the subsequent stages (6 and 10 sec), no considerable shift in the band position could be noticed, which is again an indicative of single step reduction when combination is used. To get further confirmation of UV-Vis results on the fast and one-step reduction, TEM analysis was also carried out. Interestingly, a good complementary evidence for such single step reduction could be obtained from TEM, which is described below.
TEM studies were conducted to provide the better evidence for the evolution of structure, morphology, and size of AuNPs in solution at different reaction stages. Appropriate samples were prepared by dipping a carbon grid in the colloidal mixture collected at different time intervals. Figure 9 portrays a time succession of TEM images of colloidal AuNPs at different reaction times. The corresponding particle size distributions of the respective steps were also included in this Figure. After 2 sec, monodispersed AuNPs were formed mostly with spherical morphology; however a few percentage of particles with irregular shapes were also present (Figure 9(a)). The particle size distributions were more or less narrowed with an average size of 6.3 nm. With increasing reaction time (6 sec), the average particle size slightly decreased from 6.3 nm to 4.9 nm (Figure 9(b)), and finally to 3.2 nm after 10 sec (Figure 9(c)). The size distribution obviously narrowed again at the final stage of the formation of colloidal AuNPs. No further change either in the morphology or in the size of AuNPs was noticed by TEM even after 5 min, which further supports the results of UV-Vis that the reaction was completed in short time (10 sec). Achieving such the smallest nanoparticles of 3.2 nm using the combination of two reductants is indeed the remarkable outcome of this study. One common observation between the usages of single or combination of two reducing agents is that always bigger Au particles are formed irrespective of type of reducing agent used especially during the initial stages of reduction process, and then the size of AuNPs decreased to a minimum where the reduction is complete. Interestingly, this observation is often noticed in all investigations and is also supported by different characterization techniques. The probable reason for obtaining different morphology with smaller particles of less than 4 nm using combination of reductants (against 12 nm with SCalone and 17 nm TA alone) might be due to the hydrophobicity of ligand, charge and binding affinity to colloidal
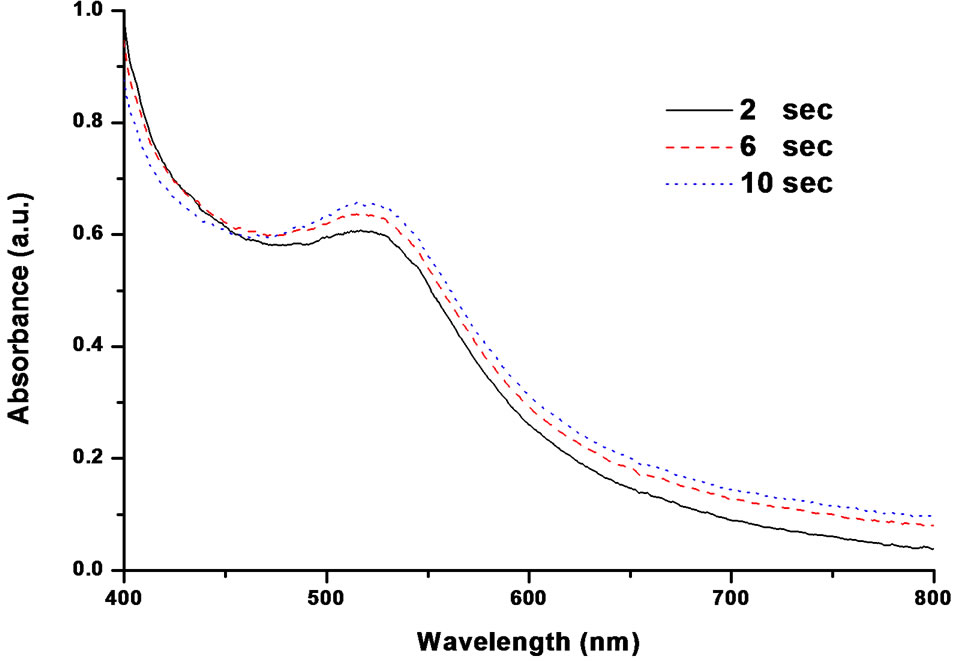
Figure 8. Time-resolved UV-vis spectra during the reduction of 1.0 mM HAuCl4 solution with 15 mM SC solution in the presence of TA at 60˚C.
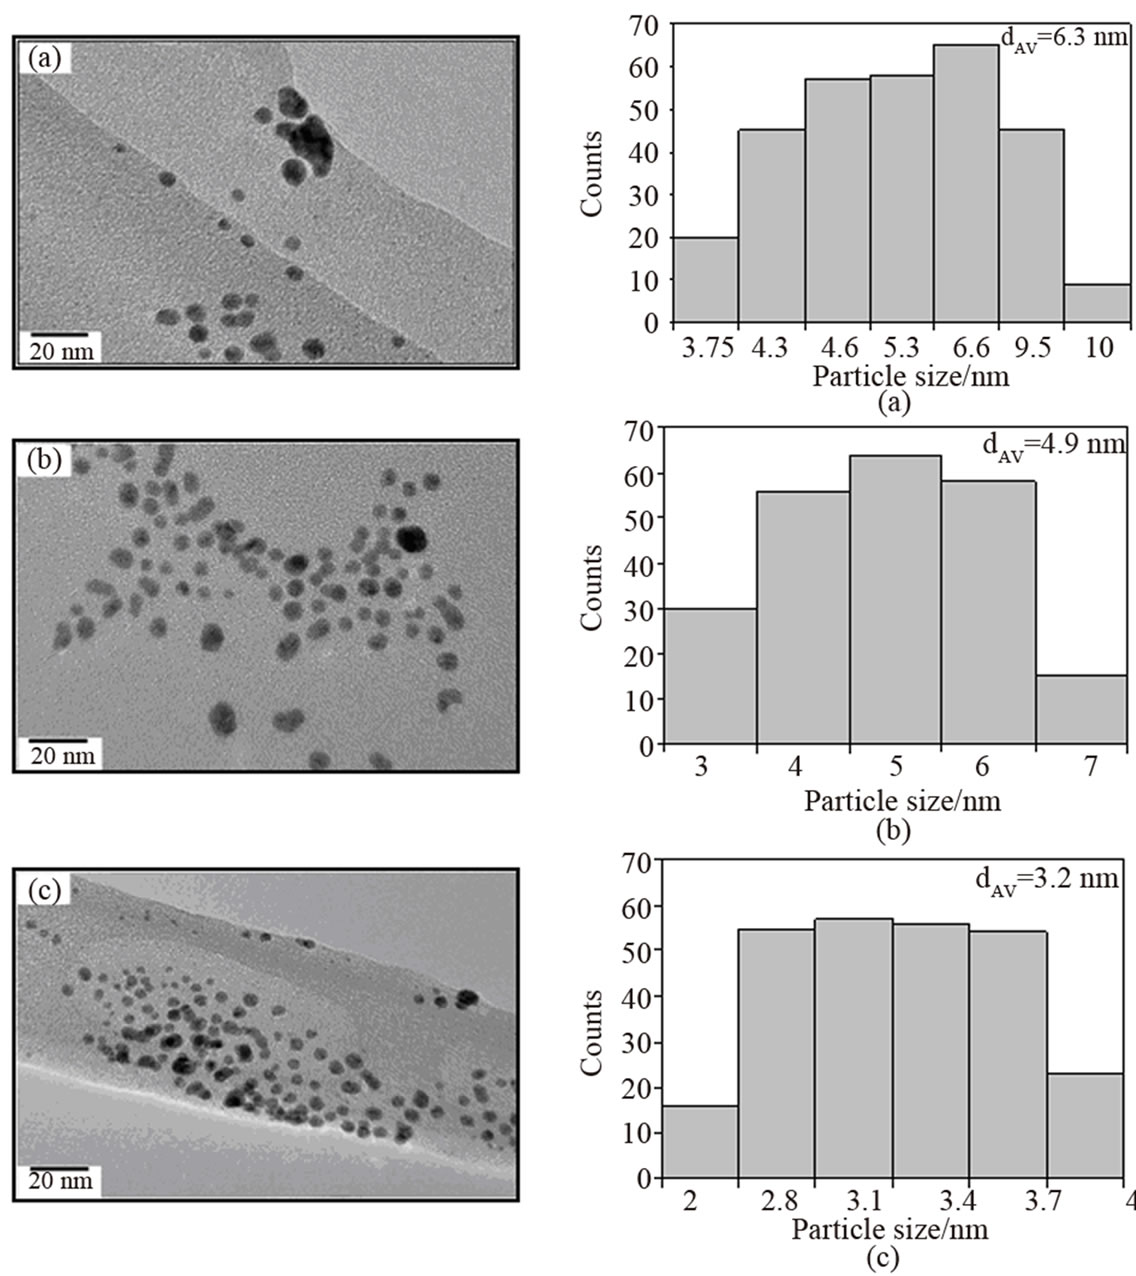
Figure 9. TEM images taken during the formation of colloidal AuNPs obtained by reduction of 1.0 mM HAuCl4 solution with 15 mM SC solution in the presence of TA at 60˚C at reaction time of (a) 2 sec; (b) 6 sec; (c) 10 sec.
mixture. Possibly, this assumption is also displayed by the changes in zeta potential (ζ) values with changed reductant, which are discussed after DLS results in more detail.
The formation of colloidal AuNPs produced by the combination of two reductants can also be conveniently followed by DLS measurements. The histogram (Figure 9) shows the evolution of gold colloids of average sizes between 3.5 and 15 nm vs. reaction time. It can also be seen that the formation process of colloidal AuNPs in process-III was completed within 10 sec, which is much faster than SC (60 min) but comparable with TA (9 sec). Initially (i.e. 2 sec), after the addition of SC + TA mixture to Au3+ solution, a broad size distribution with an average particle size of 11 nm was characterized in the suspension. After 6 sec, the average particle size slightly decreased to 9.5 nm with a more narrow size distribution, indicating that some changes in this process occurred. At final stage (after 10 sec), the mean average size of AuNPs reached 8.5 nm with a very narrow size distribution. In addition, another sample was also tested after 1 min but no further changes occurred. Overall, the difference in the average size of colloidal AuNPs formed at various reaction times is relatively small indicating that these results are in reasonable agreement with the UV-vis results where no significant change was found in the maximum wavelength of the SP bands.
In addition to UV-Vis, TEM and DLS investigation, the samples (final stage) were also characterized by zeta potential to get further insights on the stability of colloiddal AuNPs obtained from processes-I to III. The magnitude of zeta potential gives an indication of potential stability of colloid. In general, the particles with zeta potential values more positive than +30 mV or more negative than –30 mV are considered stable. On the other hand, the colloids are least stable at isoelectric point, where the zeta potential is zero. In other words, the colloids with high zeta potentials (positive or negative) are electrically stabilized while the ones with low zeta potentials tend to coagulate, i.e. a dividing line between stable and unstable colloids is usually taken at either +30 mV or –30 mV. In the present study, the ζ values are varied in the range from –17 mV to –39 mV, depending upon the type of reducing agent/process applied. Thus, the changes in the size of AuNPs are also reflected by the changes in ζ values when we move from process-I to -III. Our results showed that the process-II (TA as reductant) displayed the lowest zeta potential (–17 mV) and hence there is no force to prevent the particles coming together and floculate, which is called dispersion instability. Therefore, process-II gives the least stable AuNPs compared to others. Alternatively, the highest stability of AuNPs is obtained from process-I (i.e. SC reductant) with a ζ value of –39.3 mV. Fascinatingly, the combination (process-III) also gave not only the smallest particles of 3.2 nm but also stable particles with a ζ value of –32.4 mV. Based on these results, it can be stated that the combination of two reducing agents has a clear influence on the size and stability of AuNPs. However, the possibility of other parameters that are responsible for the formation of smaller particles during process-III cannot be ruled out. In general, various reasons can be taken into account to understand the formation of different morphologies of AuNPs such as 1) repulsive electrostatic forces, which stabilize the particles, 2) attractive electrostatic forces between non-equivalent metal particles due to charge redistribution, 3) attractive size-dependent dispersive forces between identical particles, 4) attractive dipole forces between in-plane magnetic or electric dipoles etc. However, further studies are necessary to clarify these aspects and identify the precise reasons for the formation of the smallest particles, when combination of two reductants is applied.
Comparing the effects of single reducing agent with that of combination, a few interesting observations can be made. The effects induced by the combination of reducing agents are: 1) clear changes in the colour of suspensions, 2) formation of the smallest of AuNPs could be produced, which is a beneficial effect, 3) the reduction process was fast probably due to the presence of strong reducing agent (TA). This might also be useful with respect to saving time, and 4) finally the growth steps and size distribution are different when we compare the combination effects with that of individual (single) reducing agents.
To confirm these results, the synthesis and the measurements were repeated three times under identical conditions and similar results were obtained. This fact shows that the formation of smaller particles and growth steps involved at different stages are quite reproducible.
Based on the above results, the different steps involved in the formation processes of colloidal AuNPs, using a single reducing agent (process-I & II), and a combination of two reducing agents (process-III), can be schematically depicted in Figure 10. This imagination is mainly based on the results of TEM analysis. In comparison, processes I, II and III, which differ considerably in particle morphology as well as growth steps involved during AuNPs formation at different stages. Process-I shows three distinct particle shapes during the reduction steps, namely: large Au flower/flake-like nanocrystals (after 1 min), wire-like networks (after 10 min), and spherical Au particles (almost polyhedrons) after 60 min. Process-II gives different steps which includes some nanocrystals (after 2 sec), nanowires structures after 5 sec which then aggregated at the end of the reaction. In contrast, such considerable differences in particle morphology could not be found in case of process-III where the reduction
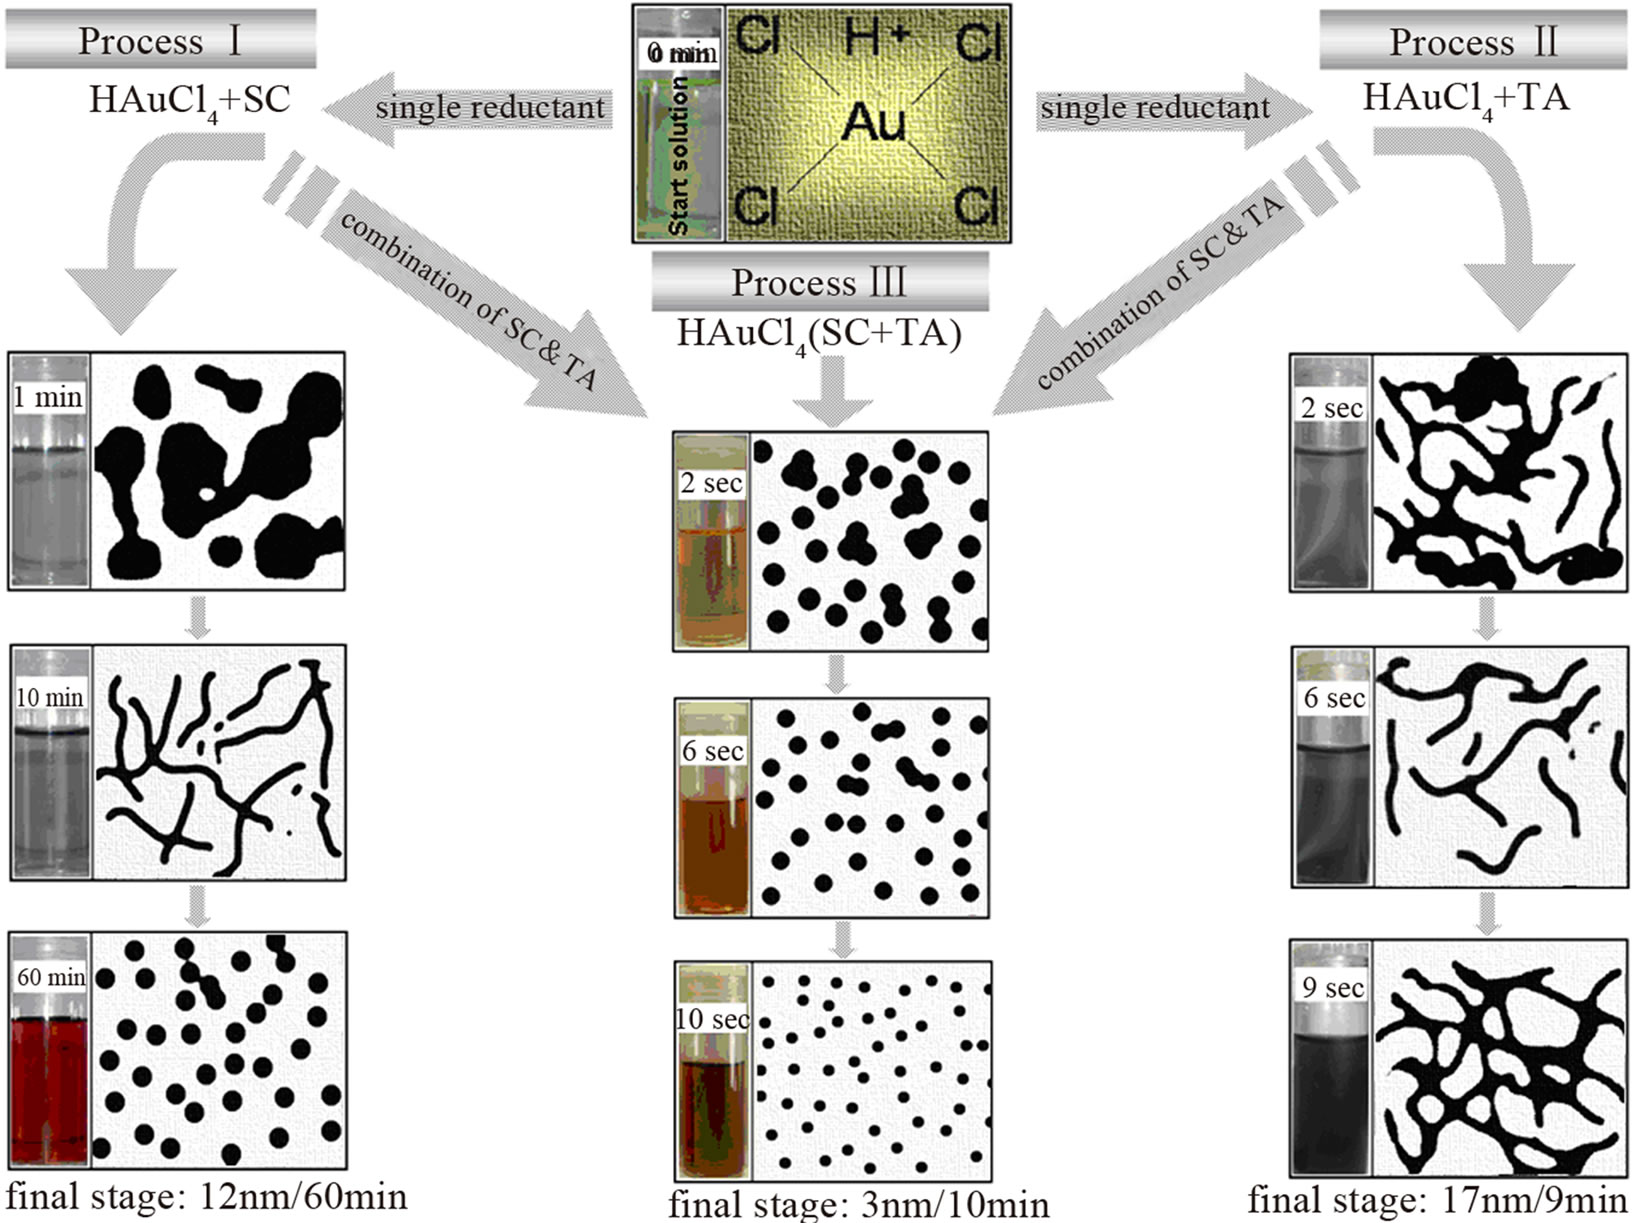
Figure 10. Scheme of the formation mechanism of colloidal AuNPs in solution. Process I shows the different steps of AuNPs formation using single reductant. Process II represents the steps of AuNPs formation using a combination of two reductants.
was achieved quickly and in a single step. In addition, the colour of colloidal suspensions was also found to depend upon the nature of reductant used.
4. Conclusion
The present study has shown a first overview of the effect of the combination of two reducing agents on the formation mechanism steps and size of colloidal AuNPs in solution. At first, the mechanism of the formation of AuNPs using an individual reductant like sodium citrate and tannic acid was elucidated. The results of SC showed clear evidence of a multi-stage formation process, which includes varying morphologies of AuNPs starting from flower/flake-like nanocrystals, wire-like networks to spherical Au particles at different stages of reduction. On the other hand, application of TA also showed some similarities with that of SC particularly during the first two steps of reduction and gave more or less similar morphology. However, TA differed from SC in the final stage in three ways such as 1) exhibiting nanowire morphology, 2) agglomeration of such nanowires and 3) low stability. Interestingly, the combination of two reductants (SC plus TA, process-III) led to a significant change in the formation mechanism. The data analysis of combination revealed no indication of multiple stages of particle formation during reduction instead the formation of AuNPs occurred quickly and in a single step. The most striking feature is that the smallest gold nanoparticles (3.2 nm) could be successfully achieved during the combination of reducing agents. Conversely, application of single reducing agents gave bigger AuNPs (ca. 12 nm in process-I, 17 nm in process-II). Moreover, it is worth noting that the results obtained from all the described techniques at various reaction time intervals showed comparable tendencies and complementary evidences. In summary, it can be said that the nature of reducing agent (either single or combination) has shown considerable influence on the size, morphology, distribution, growth steps and the stability of the formed AuNPs.
REFERENCES
- A. P. Alivisatos, “Semiconductor Clusters, Nanocrystals, and Quantum Dots,” Science, Vol. 271, No. 5251, 1996, pp. 933-937. doi:10.1126/science.271.5251.933
- M.-C. Daniel and D. Astruc, “Gold Nanoparticles: Assembly, Supramolecular Chemistry, Quantum-Size-Related Properties, and Applications toward Biology, Catalysis, and Nanotechnology,” Chemical Reviews, Vol. 104, No. 1, 2004, pp. 293-346. doi:10.1021/cr030698+
- K. E. Geckeler and E. Rosenberg, “Functional Nanomaterials,” American Scientific Publicationn, Valencia, 2006.
- A. S. K. Hashmi and G. J. Hutchings, “Gold Catalysis,” Angewandte Chemie International Edition, Vol. 45, No. 118, 2006, pp. 7896-7936. doi:10.1002/ange.200602454
- R. Narayana and M. A. El-Sayed, “Shape-Dependent Catalytic Activity of Platinum Nanoparticles in Colloidal Solution,” Nano Letters, Vol. 4, No. 7, 2004, pp. 1343- 1348.
- M. C. Daniel and D. Astruc, “Gold Nanoparticles: Assembly, Supramolecular Chemistry, Quantum-Size-Related Properties, and Applications toward Biology, Catalysis, and Nanotechnology,” Chemical Reviews, Vol. 104, No. 1, 2004, pp. 293-346. doi:10.1021/cr030698+
- B. L. V. Prasad, S. I. Stoeva, C. M. Sorensen, V. Zaikovski and K. J. Klabunde, “Gold Nanoparticles as Catalysts for Polymerization of Alkylsilanes to Siloxane Nanowires, Filaments, and Tubes,” Journal of the American Chemical Society, Vol. 125, No. 35, 2003, pp. 10488- 10489. doi:10.1021/ja035046h
- M. Haruta, “Gold Rush,” Nature, Vol. 437, No. 7062, 2005, pp. 1098-1099. doi:10.1038/4371098a
- D. V. Leff, P. C. Ohara, J. R. Heath and W. M. Gelbart, “Thermodynamic Control of Gold Nanocrystal Size: Experiment and Theory,” The Journal of Physical Chemistry, Vol. 99, No. 18, 1995, pp. 7036-7041. doi:10.1021/j100018a041
- R. L. Whetten and W. M. Gelbart, “Nanocrystal Microemulsions: Surfactant-Stabilized Size and Shape,” The Journal of Physical Chemistry, Vol. 98, No. 13, 1994, pp. 3544-3549. doi:10.1021/j100064a042
- N. R. Jana, “Shape Effect in Nanoparticle Self-Assembly,” Angewandte Chemie International Edition, Vol. 43, No. 12, 2004, pp. 1536-1540.
- A. Gole and C. Murphy, “Seed-Mediated Synthesis of Gold Nanorods: Role of the Size and Nature of the Seed,” Journal of Materials Chemistry, Vol. 16, No. 19, 2004, pp. 36633-36640. doi:10.1021/cm0492336
- G. Schmid, “Large Clusters and Colloids. Metals in the Embryonic State,” Chemical Reviews, Vol. 92, No. 8, 1992, pp. 1709-1727. doi:10.1021/cr00016a002
- K. Esumi, A. Suzuki, N. Aihara, K. Usui and K. Torigoe, “Preparation of Gold Colloids with UV Irradiation Using Dendrimers as Stabilizer,” Langmuir, Vol. 14, No. 12, 1998, pp. 3157-3159. doi:10.1021/la980162x
- S. Kapoor, “Preparation, Characterization, and Surface Modification of Silver Particles,” Langmuir, Vol. 14, No. 5, 1998, pp. 1021-1025. doi:10.1021/la9705827
- J. Kimling, M. Maier, B. Okenve, V. Kotaidis, H. Ballot and A. Plech, “Turkevich Method for Gold Nanoparticle Synthesis Revisited,” The Journal of Physical Chemistry B, Vol. 110, No. 32, 2006, pp. 15700-15707. doi:10.1021/jp061667w
- V. K. LaMer and R. H. Dinegar, “Theory, Production and Mechanism of Formation of Monodispersed Hydrosols,” Journal of the American Chemical Society, Vol. 72, No. 11, 1950, pp. 4847-4854. doi:10.1021/ja01167a001
- M. K. Chow and C. F. Zukoski, “Gold Sol Formation Mechanisms: Role of Colloidal Stability,” Journal of Colloid and Interface Science, Vol. 165, No. 1, 1994, pp. 97- 109. doi:10.1006/jcis.1994.1210
- M. A. Watzky and R. G. Finke, “Transition Metal Nanocluster Formation Kinetic and Mechanistic Studies. A New Mechanism When Hydrogen Is the Reductant: Slow, Continuous Nucleation and Fast Autocatalytic Surface Growth,” Journal of the American Chemical Society, Vol. 119, No. 43, 1997, pp. 10382-10400. doi:10.1021/ja9705102
- K. R. Brown and M. Natan, “Hydroxylamine Seeding of Colloidal Au Nanoparticles in Solution and on Surfaces,” Langmuir, Vol. 14, No. 4, 1998, pp. 726-728. doi:10.1021/la970982u
- L. Cao, T. Zhu and Z. Liu, “Formation Mechanism of Nonspherical Gold Nanoparticles during Seeding Growth: Roles of Anion Adsorption and Reduction Rate,” Journal of Colloid and Interface Science, Vol. 293, No. 1, 2006, pp. 69-76. doi:10.1016/j.jcis.2005.06.012
- A. Pongpeerapat, C. Wanawongthai, K. Moribe and K. Yamamoto, “Formation Mechanism of Colloidal Nanoparticles Obtained from Probucol/PVP/SDS Ternary Ground Mixture,” International Journal of Pharmaceutics, Vol. 352, No. 1-2, 2008, pp. 309-316. doi:10.1016/j.ijpharm.2007.10.052
- M. Harada, K. Saijo and N. Sakamoto, “Characterization of Metal Nanoparticles Prepared by Photoreduction in Aqueous Solutions of Various Surfactants Using UV-Vis, EXAFS and SAXS,” Colloids and Surfaces A, Vol. 349, No. 1-3, 2009, pp. 176-188. doi:10.1016/j.colsurfa.2009.08.015
- A. Cacciuto, S. Auer and D. Frenkel, “Onset of Heterogeneous Crystal Nucleation in Colloidal Suspensions,” Nature, Vol. 428, No. 6981, 2004, pp. 404-406. doi:10.1038/nature02397
- H. Mühlpfordt, “The Preparation of Colloidal Gold Particles Using Tannic Acid as an Additional Reducing Agent,” Expirentia, Vol. 38, No. 9, 1982, pp. 1127-1128. doi:10.1007/BF01955405
- G. Frens, “Controlled Nucleation for the Regulation of the Particle Size in Monodisperse Gold Suspensions,” Nature Physical Science, Vol. 241, No. 105, 1973, pp. 20- 22.
- A. I. Kirkland, P. P. Edward, D. A. Jefferson and D. G. Duff, “The Structure, Characterization, and Evolution of Colloidal Metals,” Annual Reports Section C (Physical Chemistry), Vol. 87, 1990, pp. 247-304. doi:10.1039/pc9908700247
- S. Link, C. Burda, Z. L. Wang and M. A. El-Sayed, “Electron Dynamics in Gold and Gold-Silver Alloy Nanoparticles: The Influence of a Nonequilibrium Electron Distribution and the Size Dependence of the ElectronPhonon Relaxation,” Journal of Chemical Physics, Vol. 111, No. 3, 1999, pp. 1255-1264. doi:10.1063/1.479310
- J. L. Yao, G. P. Pan, K. H. Xue, D. Y. Wu, B. Ren, D. M. Sun, J. Tang, X. Xu and Z. Q. Tian, “A Complementary Study of Surface-Enhanced Raman Scattering and Metal Nanorod Arrays,” Pure and Applied Chemistry, Vol. 72, No. 1-2, 2000, pp. 221-228. doi:10.1351/pac200072010221
- S. Link and M. A. El-Sayed, “Optical Properties and Ultrafast Dynamics in Metallic Nanocrystals,” Annual Review of Physical Chemistry, Vol. 54, 2003, pp. 331-366. doi:10.1146/annurev.physchem.54.011002.103759
- G. Mie, “Simulation of the Colour Effects Connected with Colloidal Gold Particles,” Annals of Physics, Vol. 25, No. 3, 1908, pp. 377-445. doi:10.1119/1.1621030
- C. L. Haynes and R. P. Van Duyne, “Nanosphere Lithography: A Versatile Nanofabrication Tool for Studies of Size-Dependent Nanoparticle Optics,” The Journal of Physical Chemistry B, Vol. 105, No. 24, 2001, pp. 5599- 5611. doi:10.1021/jp010657m
- S. Link, M. B. Mohamed and M. A. El-Sayed, “Simulation of the Optical Absorption Spectra of Gold Nanorods as a Function of Their Aspect Ratio and the Effect of the Medium Dielectric Constant,” The Journal of Physical Chemistry B, Vol. 103, No. 16, pp. 3073-3077. doi:10.1021/jp990183f
- R. Jin, Y. Cao, C. A. Mirkin, K. L. Kelly, G. C. Schatz and J. G. Zheng, “Photoinduced Conversion of Silver Nanospheres to Nanoprisms,” Science, Vol. 294, No. 5548, 2001, pp. 1901-1903. doi:10.1126/science.1066541
- M. D. Malinsky, K. L. Kelly, G. Schatz and R. P. Van Duyne, “Chain Length Dependence and Sensing Capabilities of the Localized Surface Plasmon Resonance of Silver Nanoparticles Chemically Modified with Al Kanethiol Self-Assembled Monolayers,” Journal of the American Chemical Society, Vol. 123, No. 7, 2001, pp. 1471-1482. doi:10.1021/ja003312a
- P. Mulvaney, “Surface Plasmon Spectroscopy of Nanosized Metal Particles,” Langmuir, Vol. 12, No. 3, 1996, pp. 788-800. doi:10.1021/la9502711
- I. O. Sosa, C. Noguez and R. G. Barrera, “Optical Properties of Metal Nanoparticles with Arbitrary Shapes,” The Journal of Physical Chemistry B, Vol. 107, No. 26, 2003, pp. 6269-6275. doi:10.1021/jp0274076
- M. M. Alvarez, J. T. Khoury, T. J. Schaaff, M. N. Shafigullin, I. Vezmar and R. L. Whetten, “Optical Absorption Spectra of Nanocrystal Gold Molecules,” Journal of Physical Chemistry, Vol. 101, No. 12, 1997, pp. 3706- 3719. doi:10.1021/jp962922n
- U. Kreibig and L. Genzel, “Optical Absorption of Small Metallic Particles,” Surface Science, Vol. 156, No. 2-3, 1985, pp. 678-700. doi:10.1016/0039-6028(85)90239-0
- M. Tréguer-Delapierre, J. Majimel, S. Mornet, E. Duguet and S. Ravaine, “Synthesis of Non-Spherical Gold Nanoparticles,” Gold Bulls, Vol. 41, No. 2, 2008, pp. 195-207. doi:10.1007/s13404-011-0037-2
- T. R. Jensen, R. P. van Duyne, S. A. Johnson and V. A. Maroni, “Surface-Enhanced Infrared Spectroscopy: A Comparison of Metal Island Films with Discrete and Nondiscrete Surface Plasmons,” Applied Spectroscopy, Vol. 54, No. 3, 2000, pp. 371-377.
- T. R. Jensen, M. D. Malinsky, C. L. Haynes and R. P. van Duyne, “Nanosphere Lithography: Tunable Localized Surface Plasmon Resonance Spectra of Silver Nanoparticles,” Journal of Physical Chemistry B, Vol. 104, No. 45, 2000, pp. 10549-10565. doi:10.1021/jp002435e
- E. Hutter and J. H. Fendler, “Exploitation of Localized Surface Plasmon Resonance,” Advanced Materials, Vol. 16, No. 19, 2004, pp. 1685-1709. doi:10.1002/adma.200400271
- B. K. Jena and C. R. Raj, “Synthesis of Flower-Like Gold Nanoparticles and Their Electrocatalytic Activity towards the Oxidation of Methanol and the Reduction of Oxygen,” Langmuir, Vol. 23, No. 7, 2007, pp. 4064-4070. doi:10.1021/la063243z
- C. D. Chen, Y. T. Yeh and C. R. Wang, “The Fabrication and Photo-Induced Melting of Networked Gold Nanostructures and Twisted Gold Nanorods,” Journal of Physics and Chemistry of Solids, Vol. 62, No. 9-10, 2001, pp. 1587-1597. doi:10.1016/S0022-3697(01)00098-1
- L. Pei, K. Mori and M. Adachi, “Formation Process of Two-Dimensional Networked Gold Nanowires by Citrate Reduction of AuCl4– and the Shape Stabilization,” Langmuir, Vol. 20, No. 18, 2004, pp. 7837-7843. doi:10.1021/la049262v
- S. Link and M. A. El-Sayed, “Spectral Properties and Relaxation Dynamics of Surface Plasmon Electronic Oscillations in Gold and Silver Nanodots and Nanorods,” Journal of Physical Chemistry B, Vol. 103, No. 40, 1999, pp. 8410-8426. doi:10.1021/jp9917648
- B. K. Pong, H. I. Elim, J. X. Chong, B. L. Trout and J. Y. Lee, “New Insights on the Nanoparticle Growth Mechanism in the Citrate Reduction of Gold (III) Salt: Formation of the Au Nanowire Intermediate and Its Nonlinear Optical Properties,” Journal of Physical Chemistry C, Vol. 111, No. 17, 2007, pp. 6281-6287. doi:10.1021/jp068666o
NOTES
*Corresponding author.