Open Journal of Geology
Vol.06 No.10(2016), Article ID:71601,32 pages
10.4236/ojg.2016.610096
Regional Hypsometric Analysis of the Jordan Rift Drainage Basins (Jordan) Using Geographic Information System
Yahya Farhan*, Rami Mousa, Arij Dagarah, Durgham Shtaya
Department of Geography, University of Jordan, Amman, Jordan

Copyright © 2016 by authors and Scientific Research Publishing Inc.
This work is licensed under the Creative Commons Attribution International License (CC BY 4.0).
http://creativecommons.org/licenses/by/4.0/


Received: September 27, 2016; Accepted: October 25, 2016; Published: October 28, 2016
ABSTRACT
This research is intended to assess the regional pattern of hypsometric curves (HCs) and hypsometric integrals (HIs) for the watersheds draining into the Jordan Rift (River Jordan, the Dead Sea, and Wadi Araba watersheds). Hypsometric analysis was performed on 22 drainage basins using ASTER DEM (30 m resolution) and GIS. The area-elevation ratio method was utilized to extract the hypsometric integral values within a GIS environment. A prominent variation exists in the HC shapes and HI values. The highest hypsometric values are found for the Dead Sea ( = 0.87) and River Jordan (
 = 0.77) watersheds. Whereas the lowest values (
 = 0.51) characterized Wadi Araba catchments, except Wadi Nukhaileh (lower Wadi Araba) which yields an HI value of 0.26. Seventeen HCs pertained to the River Jordan and the Dead Sea watersheds evince remarkably upward convex shapes indicating that such drainage basins are less eroded, and at the youth-stage of the geomorphic cycle of erosion. Catchments draining to Wadi Araba are of intermediate HI values (0.41 - 0.58) which are associated with a balance, or dynamic equilibrium between erosion and tectonic processes. Accordingly, they correspond to a late mature stage of geomorphic development. Additionally, Wadi Nukhaileh yields the lowest HI value (0.26) and is associated with highly eroded terrain of late mature geomorphic evolution, approaching an old stage therefore, with distorted concave upward curves. High HI values indicate that these watersheds have been subjected to tectonic uplift, down faulting of the Rift and intense rejuvenation. Differences in HI values can be attributed to disparity in tectonic uplift rate, base level heights, and mean heights of the River Jordan watersheds, the Dead Sea and Wadi Araba watersheds, and variation in lithology, which caused noticeable differences in rejuvenation processes, and channel incision. Regression analysis reveals that R2 values which represent the degree of control of driving parameters on HI, are positive and generally low (ranging from 0.026 to 0.224) except for the height of base level (m) parameter which contributes 0.42 (significant at 0.1% level). Such results mean that the height of base level has a significant at 0.1% level. It is obvious that the most crucial driving morphometric factor influencing HI values of the Jordan Rift drainage basins, is the height of base level (m).
Keywords:
Hypsometric Analysis, Tectonic Activity, GIS, ASTER DEM, Regression Analysis, Jordan Rift

1. Introduction
Hypsometric analysis refers to the relative proportion of an area at different elevations of the earth’s surface [1] . The technique has been developed and addressed to explain the geomorphic stages of landscape evolution, denudational processes which shape the morphology of drainage basins, and to recognize and interpret the impact of tectonic and erosional processes over a region. Hypsometry can be assessed through the hypsometric curve (HC) and hypsometric integral (HI) which are both explained in terms of the degree of drainage basin dissection and relative landform age. Hypsometric analysis is a fundamental tool to investigate the influence of lithology, tectonics, and climate on landforms change. Accordingly, the technique clarifies the interaction between tectonics and erosion. Thus, a geomorphic index can be established to illustrate the relative importance of erosion processes sculpting the topography of a watershed [2] [3] [4] . Recently, hypsometric analysis has been employed in several investigations in earth sciences such as: geology, tectonics, geomorphology, hydrology, and climatology [5] [6] [7] [8] . As a dimensionless number, hypsometric integral enables us to compare different drainage basins irrespective of scale [9] . HI analysis also provides an efficient tool to assess interactions existing between tectonic uplift, climate, lithology and erosion. With its dimensionless form, hypsometric analysis has been developed by Langbein [10] to exemplify the overall slope and forms of large drainage basins. The methodology has been extended later to investigate small drainage basins of low order [11] [12] [13] [14] [15] . The hypsometry of a watershed is displayed graphically as a “hypsometric curve” (HC), and quantitatively as an integral termed “hypsometric integral” (HI). The hypsometric curve refers to the volume of rock mass in the catchment and the amount of erosion that has taken place in the catchment against the remaining mass [16] [17] [18] . Whereas the hypsometric integral is computed from the area under a hypsometric curve and expressed as a percentage, where its value varies from 0 to 1. It has been postulated earlier that HI is strongly and positively correlated to the tectonic uplift rate for large watersheds with the area approximating 1000 km2. By contrast, small catchments (<100 km2) are affected mainly by lithological variations [2] . Therefore, the shape of hypsometric curves and the hypsometric integral values furnish fundamental information regarding the erosional stages of landforms and tectonic, lithology, and climatic factors controlling drainage basin development [19] [20] . Further, Lifton and Chase [2] examined the effect of uplift rates on hypsometry using a numerical model for landscape development. They concluded that hypsometric integral is positively correlated to uplift rate, thus it is often employed at present to trace and evaluate regional uplifting. Several studies have shown that HI is asserted by morphometric properties of a drainage basin, basin relief, area, length, width, and perimeter [6] [16] [19] . The shapes of the hypsometric curves, and values of hypsometric integral represent a primary indicator of watershed status [1] [17] . Disparity in HC shapes and variation in HI values are attributed to the degree of disequilibria in the balance of erosive and tectonic forces [3] . Comparison of HC shapes for different catchments developed under similar geologic, geomorphic and climatic conditions provide a relative insight into the erosional history and degradational processes of drainage basins. Furthermore, the shape of a hypsometric curve is an important indicator to recognize the landform erosion stage and evolution process with respect to the fluvial cycle of erosion, or the geological time needed to reduce terrain elevation to the base level [11] . Following the inspection of different hypsometric curves, and comparing different hypsometric curves for different watersheds, Strahler [1] categorized drainage basins with reference to three stages of geomorphic evolution (Figure 1): 1) youth stage (convex upward curves, where HI ≥ 0.60), where basins in this category are highly susceptible to erosion and landsliding; 2) mature stage or equilibrium (S-shaped hypsometric curve which concave upward at high elevations and convex downward at low elevations, where 0.30 ≤ Hi ≤ 0.60); and 3) old (monadnock) or peneplain stage (concave upward curve, where HI ≤ 0.30). These stages of geomorphic evolution are based on the supposition that whenever active tectonic uplift rates surpass erosion rates, the elevation and relief increase [1] [15] [21] [22] . Hypsometric curves prepared for hundreds of third or fourth- order drainage basins from different regions with homogenous geomorphic setting, show mature hypsometric curve properties which resemble the model of hypsometric function elaborated by Strahler [1] . Nevertheless, there is still an inconsiderable but distinct difference

Figure 1. Three types of hypsometric curves-youth- ful, mature and old stage [13] .
in the HCs shapes for different catchment regions [23] .
Strahler [1] examined the relationship of HI with morphometric parameters characterizing drainage basins (i.e., maximum elevation, stream channel gradient, slope steepness, drainage density, bifurcation ration, and length ratio). He concluded that positive correlation is evident between the average length of stream segments of any given order in each basin or sub-basins, and the related mean hypsometric integral. Such a relationship reveals that a progressive decline in stream length in the same order in evident as the integrals diminish. Crucial relationships were also explored between HI and the area of the catchment in active tectonic conditions where other factors, i.e., geologic structure, lithology, and climate are the same. In this regard a strong relationship has been revealed for HI classes and area classes with the number of watersheds in respective classes and the total area occupied by respective hypsometric and area classes [23] . The SIBERIA Catchment Evolution model was employed by Willgoose and Hancock [19] to assess linkages between watershed processes and hypsometry. The results achieved indicate that the SIBERIA model is of high reliability for predicting the form of the hypsometric curve from a simple model of geomorphic processes. In the recent past, hypsometric analysis was employed to evaluate the erosion status for prioritization and integrated watershed management [24] . Further, HI values were adopted as an indicator for high surface runoff, and thus, for prioritizing sub-watersheds for consideration in conservation measures [25] . Other researchers utilized HI values to elaborate a morphological index to predict surface runoff and sediment yields for different drainage basins [26] .
HI values for two catchment groups draining into the Tyrrhenian Sea and the Adriatic Sea (Italy) were inspected to assess the evolution processes against the stage of geomorphic cycle. It is indicated that low HI values of the Adriatic watersheds are explained in terms of spreading and the associated high impact of denudational processes rather than the factor of age, i.e. old stage of geomorphic cycle. Hence, HI values and HC curves were interpreted in relation to different tectonic history pertaining to each side of the Italian Peninsula [27] . The application of GIS tools in hypsometric analysis was introduced by Luo [28] . Later, he applied hypsometric techniques to quantity landforms, and to identity their origin both on earth and other planets (Mars), using digital data and GIS [29] . He also concluded that the technique is rational in separating typical sapping and fluvial landforms on the basis of their morphological aspects. Statistical and morphometric parameters such as density skewness, skewness, and hypsometric integral seem to be particularly powerful in separating the two types of landforms. It is believed that groundwater-sapping on Mars has played an important role in its landform evolution. Lou [30] also adopted hypsometric analysis to investigate the origin of stream networks in the Margaritifer Sinus region of Mars in an attempt to infer the evolution processes. He suggested that a number of basins are of sapping origin, or alternatively, more fluvial-like, indicating a warm and wet climate prevailing on early Mars.
Recently, Markose and Jayappa [31] employed hypsometric analysis to assess HI values and HI curves for 20 sub-basins of the Kali River (India). They successfully differentiate between two groups of sub-basins: the first group is characterized by high HI values, thus of younger geomorphic stage and subjected to recent tectonic activity. By contrast, the second group is described by low HI values, hence, less disturbed by recent tectonic activities, and exposed more to fluvial erosion [32] . Farhan et al. performed hypsometric analysis to investigate the geomorphic evolution and to demarcate areas of erosional proneness over W. Mujib-Wala watershed (southern Jordan). Twenty eight fourth-order sub-basins were selected and subjected to hypsometric analysis using 30 m ASTER DEM and GIS. HI values range from 0.71 to 0.88, whereas the hypsometric carves display sharp upward convex shapes, denoting that all sub-basins are at the youth-age stage of geomorphic evolution. Incised channel erosion, landslide activity, and high susceptibility to soil erosion loss are characteristic phenomena of these catchments. The marginal differences in rock mass removal from the watershed, and the 28 sub basin are explained in terms of variation in lithology, tectonic influence, and rejuvenation processes. The estimated sediment yields of W. Mujib and W. Wala separately [23] - [34] were also found in affirmation with high HI values. Higher values of HI, high sediments yield and soil erosion rates, occurred over the rejuvenated belt which occupied the western part of W. Mujib-Wala catchment.
Hypsometric analysis and slope computation were utilized to conduct terrain analysis on remote subaerial Hawaiian shield volcanoes, where field work is inaccessible. SRTM-1 and SRTM-3 digital elevation models and morphometry were employed in this regard [35] . It has been concluded that the combination of morphometric parameters such as average and median slope, average slope elevation [36] [37] [38] , and hypsometric analysis can be used in accordance with lava flow mapping to furnish insight into a volcano’s eruption and magma production history for both inaccessible remote terrestrial volcanoes, and volcanoes on other planets [35] . Hypsometric analysis techniques combined with selected morphometric parameters (i.e., basin area and/or relief) have been suggested to increase the predictive power and transferability of rainfall-ru- noff model [39] . Yunus [40] examined the relations between HI and the distance from the central location of each basin from south to north, HI and basin area, shape and lithology with reference to 36 drainage basins in the western Arabian Peninsula. Results revealed that basin hypsometry is independent of spatial variation and spatial scale.
Hypsometric analysis in the present research was performed in order to:
1) Assess the regional pattern of HC and HI for 22 drainage basins draining the eastern plateau of the Jordan Rift Valley, and to explain the variation of regional pattern in terms of tectonic activity, uplifting, continuous lowering of the Dead Sea base level, and height of base level pertaining to different watersheds (Figure 2).
2) Examine the relationships between HI values and the morphometric driving parameters, i.e., the hierarchical orders and area of watersheds, height of base level, shape factor (from factor and elongation ratio), and mean height of drainage basins draining to the River Jordan, Dead Sea, and Wadi Araba.
3) Identify the predictor parameters of HI (the dependent variable among the geomorphometric parameters), and recognize the total variance (R2) explained by the most

Figure 2. The twenty two watersheds of the eastern Jordan rift.
important variable through stepwise multiple regression.
4) Evaluate the hypsometric parameters in order to achieve useful information on areas of high tectonic activity, and type of erosion processes shaping the eastern drainage basins of the Jordan Rift.
2. Study Area
The Jordan Rift Valley trends north-south, and extends to 360 km from Lake Tiberias to the Gulf of Aqaba. With its eastern watersheds, it covers an area of 27,169 km2 between latitudes 35˚63'' and 35˚53" North and longitudes 34˚98" and 36˚80" East (Figure 3). Two major physiographic units can be distinguished along the Jordan Rift Valley: the highlands, and the associated dissected fault scarps overlooking the Rift; and the lowlands constituting three units: the Jordan valley floor, the Dead Sea (−430 m∙b.s.l.), and the floor of Wadi Araba, between the Dead Sea and the Gulf of Aqaba.
Since the early Miocene, each successive opening and downward movement along the Jordan Rift fault (part of the Dead Sea Transform (DTS)) [41] [42] predetermined the tectonic and geomorphic development of the deep Dead Sea Basin, and the uplifted eastern shoulder of the Jordanian Plateau [43] . During the Miocene, a major horizontal offset of 60 - 65 km occurred and was associated with a minor subsidence of approximately 1000 m. Whereas during the Pliocene and particularly down through the Pleistocene,

Figure 3. Location of the study area, and the DEM of the watersheds.
a second horizontal offset of 40 - 45 km was realized and followed by a major subsidence reaching 6000 m [44] [45] . However, recent gravimetric survey indicates that the thickness of sediment sequence across the Dead Sea is reaching 10,000 m [46] , which indicates that the subsidence level at the Dead Sea part of the transform was more than 7000 m as reported above. Tectonic activity has also resulted in basalt flows (Oligocene to Pleistocene) which covers a vast area of the northeastern part of the highland. Tectonic and rejuvenation processes initiate old landslide complexes which extend for several kilometers down slope towards the main courses of wadis/rivers draining to the Jordan Rift Valley. Progressive lowering of the Dead Sea level has strong influenced the fluvial behavior of drainage basins draining to the Jordan Rift (north of Ghor Al Al-Ajram, +240 m∙a.s.l, Wadi Araba (Figure 4). The response of a drainage system to base level changes is evident through degradation, and changes in channel pattern and geometry [47] . Lowering of the base level (i.e., when the slope of the “new” emerged area is steeper than that of the stream channel) activates degradation, and initiates gullies, down cutting and incision, knick-points migration, development of river terraces and incised meanders, breaks in the cross-profile of the valley, acceleration of bank erosion, and sediment discharge at the outlet. Adjustment to base level changes normally started at the outlets of the stream and arise upstream through the drainage system [48] [49] [50] . In this context, previous estimation of the lowering of the Dead Sea level, indicate that the Dead Sea level has dropped from −392 m in the early 1930s to −414 m in 1998―a total sea level drop of 22 m, averaging about 32 cm per year [47] . Recent measurements of the Dead Sea level (2015) using ASTER DEM (30 m resolution) are found to be −431 m∙b.s.l, which means 46 cm per year [32] . A study was carried out to estimate
the lowering and shrinkage of the Dead Sea water surface over the period 1973-2004 using GIS and remote sensing techniques [49] . It is reported that annual lowering of the Dead Sea is 83 cm. Thus, it is expected that the Dead Sea will become even lower in the future due to the construction of dams on the Dead Sea catchments, the production of potash and other salt minerals from the Dead Sea, possible climatic change, and the increase of water consumption for tourism, industrial and agricultural activities [51] .
The highlands varied from north to south, in terms of morphology and relief, rainfall, soils, land use and land cover. Cambrian, Ordovisian, and lower Cretaceous sandstones exposed. Pre-Cambrian granitic basement predominate the southern part of this unit from the Dead Sea to the Gulf of Aqaba (Figure 5). By contrast, Upper Cretaceous rocks of the Ajlune group and basalt covers most of the northern highlands. Further,

Figure 4. Topographic cross profile illustrates the River Jordan, the Dead Sea, the Gulf of Aqaba.

Figure 5. Lithology of the watershed areas.
Cambrian, Ordovisian, and lower Cretaceous sandstones, and Upper Cretaceous Limestone and Eocene rocks are exposed in the central parts of the highlands. The Dead Sea catchments are significantly influenced by successive rejuvenation, which has permitted erosion to cut spectacular canyons (Wadi Mujib-Wala and Wadi Hasa are the best examples) through strata which ranges from Eocene to pre-Cambrian [52] . Comparable with the bordering highlands, the floor of the Rift Valley is arid. In the north, water is, or was dominant in Lake Tiberias, in the lacustrine Lisan marl and in the Dead Sea, with the Lisan Marl extending to form its southern shore. From Wadi Araba to Aqaba, terrestrial deposits such as talus fans, alluvial fans, gravel outwash plains, and sand forms predominate. These deposits testify to the aridity and lack of water in the past and present. Between Lake Tiberias and the Dead Sea, the Jordan River meanders through its floodplain named locally the “Zhor”, incised to a depth of about 50 m below the “Ghor” or the Bajada of the valley. Recent lowering of the Dead Sea level has caused a continual adjustment of the lower Jordan River and led to: channel extension, major changes in channel morphology, deep incisions, and the development of minor terraces. Channel incision reached 11 km by 1993 [47] .
The Zhor is flanked by badlands topography formed by fluvial erosion of the soft Lisan marls which underlie a series of large coalescing’s alluvial fans. The highlands and the dissected fault scarps are characterized by dry Mediterranean, and semi-arid climate respectively. The average annual rainfall varies from 630 mm in the Ajlune Highlands, to 270 mm in Madaba, 349 mm in Kerak, and 149 in Ras En Naqb. Whereas the annual rainfall in the lowland zone ranges from 397 mm in Adasiya (on the northern corner of the Jordan Valley), 278 mm in Deir Alla (middle of the Jordan Valley), 168 mm in Shuneh (north of the Dead Sea), and 37 mm in Aqaba city. The number of rainy days (>1 mm/day) ranges from 30 to 50 days in the highlands, and comprises some 14 days in the lowlands of the Jordan [53] [54] [55] . Mediterranean Vertisolic soil covers large areas of semi-level lands of the highlands. This soil has a good water holding capacity making it suitable for rainfed cultivation (i.e., grains and barley, summer vegetables, olive and fruit trees) (Figure 6). The dissected fault scarps have a yellow soil which reflects the dry conditions prevailing there [56] . Some irrigated agriculture is practiced based on water collected by the reservoirs constructed on the eastern watersheds, or on the available underground water. 15% of the valley-side slopes are bare rock, and truncation of the upper soil horizon is widespread; consequently, fully developed soil profiles are rare. Erosion exposes more loosely structured soils, which accelerates further erosion.
3. Materials and Methods
The geomorphometric parameters employed in this investigation are derived from a 30 m resolution ASTER Globe Digital Elevation Model (GDEM) v. 2, provided on line cost free by the Ministry of Economy, Trade, and Industry (METI) of Japan, and NASA in the US (download from Jspace systems
http://www.jspacesystems.or.jp/ersdac/GDEME/4.html). Topo sheets of scale 1:50,000

Figure 6. Land use/land cover over the watersheds.
(20 m contour interval) were obtained from the Royal Jordanian National Geographic Centre (RJNGC). Topographic information was digitized and geo-referenced with UTM (WGS 1984, Zone 36 north) using Arc GIS tools. The contours were also digitized to establish the line feature class in Arc GIS, and then an ASTER DEM was generated using the Spatial Analyst Module. Additionally, drainage networks for the 22 watersheds were demarcated and digitized using Arc GIS 10.1 software. Stream order was designated to each stream following the stream ordering system developed by Strahler [11] [12] [13] . Stream order for the 22 watersheds ranges between 2nd and 8th order. Area of the basin, perimeter, length of watershed, height of base level (m) or minimum elevation, mean elevation, elongation ratio, form factor, circularity ratio, stream order for the 22 watersheds were measured using GIS software. The hypsometric curve (HC) and hypsometric integral (HI) were calculated using GIS. The attribute feature classes that accommodate these values were utilized to plot the hypsometric curves for the 22 studied watersheds, from which the HI values were calculated using the elevation-relief ratio method elaborated by Pike and Wilson [57] . The elevation-relief ratio method is found to be easy to apply and more accurate to calculate within the GIS environment. The relationship is expressed in the following equation:

where: Hmean is mean elevation,
Hmin is minimum elevation of a watershed,
Hmax is maximum elevation of the drainage basin.
Regression analysis is employed to detect the scale dependency of HI [7] [31] [32] , and to assess the effect of different driving parameters (i.e., height of base level (m), shape, elevation and stream order) on hypsometric integral. The value of R2 often indicates the degree of control of these parameters on hypsometric integral. HI values were also validated using the results of estimated average annual sediment yield and soil erosion loss achieved for several watersheds draining to the Jordan River (Wadi Kufranja), and the Dead Sea (Wadi Kerak, Wadi Mujib, and Wadi Wala) through the application of RUSLE and SWAT models [33] [34] [55] [58] . Verification of the accuracy of fieldwork observation was accomplished based on HCs, HIs, reconstruction of projected profiles, and longitudinal profiles for several wadis and rivers representing the Jordan Rift drainage basins. These cartographic methods facilitate the study of erosion cycles or subcycles, and help to determine the base levels to which these streams were eroding [59] . The surfaces preserved from such cycles are either erosion surfaces or surface of deposition or sedimentary accumulation. Erosion surfaces (gentle or flat) at high levels (upland remnant), are well illustrated in projected profile. They belong to early cycles, which are not interrupted until late maturity, old age or senility. The oldest may be interpreted as true peneplain remnants. They truly indicate the former position of the base level, because erosion had proceeded nearly to base level. Inclined erosion surfaces (or slopes), when regular, demonstrate the absence of interruptions in major movements of base level. Sudden changes in slope, are an indication of such discontinuities. Slopes lead down to the valley floors (also termed flats), where downward erosion is terminated, are also assigned as erosion surfaces. Their remnants at present stand as terraces. By contrast, the surface of deposition includes the floodplains, which either belong to modern rivers, or have been preserved in remnants as terraces. They represent the upper limit of aggradation, and they are well presented in reconstructed stream profiles. On the longitudinal profiles, the knick point was defined by intersection of the projection of the upstream and downstream reaches by fair drawing. The cross-sections of the wadis were also drawn and “valley-in-valley” phenomena were demarcated. Therefore, only these knickpoints which lie at the head of the reconstructed profile with the typical form of a graded reach; have been admitted as being rejuvenation heads.
Simple regression analysis was employed to explore the control of different morphometric driving parameters on hypsometric integral (HI), i.e. hierarchical orders of the watersheds, area of the watershed, height of base level (m), shape factor (form factor, and elongation ratio), and mean height of the watershed (m). The value of R2 is an indicator of the degree of control of these parameters on HIs. Stepwise multiple regression analysis was employed to identify the predictor parameters of HI (the dependent variable) among the geomorphometric parameters (the independent variables). The model employed is in the form given below:
Yi = a + b1∙x1 + b2∙x2 + b3∙x3 + … bj∙xj
Yi = hypsometric integral value
a = is a constant (the point where the line crosses the Y axis)
b = regression coefficient
Xi, … Xj = the independent variables (x1 … Xn).
The Digital Elevation Model (DEM) is demonstrated to be an efficient tool to analyze HI. As a dimensionless parameter, HI permits different catchments to be analyzed and compared irrespective of basin area, shape, or any other morphometric parameter [7] [11] . Further, a GIS software provides a useful tool for calculation and extraction of morphometric parameters (i.e., area, altitude, length and width, perimeter and shape) and geomorphometric information for inaccessible drainage basins.
4. Results and Discussion
4.1. Hypsometric Curve Shapes
Hypsometric curves for the 22 drainage basins draining to the Jordan Rift Valley are illustrated in Figure 7. A distinct variation exists in the HC shapes and HI values characterizing the River Jordan, Dead Sea, and Wadi Araba watersheds. The hypsometric curves of the catchments draining to the Dead Sea are remarkably convex upward, with average HI 0.87. The hypsometric curve shapes representing the River Jordan catchments, resemble those representing the Dead Sea watersheds, and the watersheds of Ras En Naqb escarpment (southern Jordan) east of the Rift [32] [60] . The average HI value is 0.77. Whereas, the shape of the hypsometric curves related to three catchments of Wadi Arab are slightly concave upward, with average HI 0.51, and highly concave upward for Wadi Nukhaile (Figure 6) with a HI value of 0.26. The hypsometric curve shapes of the River Jordan and the Dead Sea watersheds indicate that these watersheds are at the youth-age stage of geomorphic development (Figure 6, Table 1), although marginal differences in HC shapes were observed between the River Jordan and the Dead Sea catchment. These differences are retrospective to mass removal from the drainage basins, due to variation in tectonic influence, lithology, and rejuvenation processes.
The rejuvenated drainage draining into the Jordan Rift Valley (including the Dead Sea) commenced in the Miocene. Fluvial erosion cuts further and further eastwards into the Arabia surface the old Dead Sea basin as the base level of the Dead Sea has been lowered with each renewed downward movement of the Rift. Head ward erosion of streams towards the east reached a maximum distance of about 100 km. In this context recurrent lowering of the Dead Sea base-level was more significant than uplift of the plateau shoulder [52] . By contrast, the shape of the hypsometric curves of four watersheds in Wadi Araba is slightly concave upward, which denotes that this group is passing through a mature stage of geomorphic evolution. Whereas the shape of the hypsometric curves of two watersheds (W. Rakiya-Uheimer and W. Yutum) are remarkably convex upward, indicating the youth-age stage of geomorphic development. Wadi Nukhaile―the last watershed, represents a concave upward curve, or the old highly

Figure 7. Hypsometric curves of twenty two watersheds.

Table 1. Categorization of the twenty two watersheds based on HC, HI, and stage of geomorphic evolution.
eroded landscape with a HI value of 0.26. Although all hypsometric curves of the River Jordan (average HI value is 0.77) and the Dead Sea (average HI value is 0.87) watersheds are of shape convex upward shapes, the Dead Sea group of hypsometric curves demonstrates the most significant influence of base level changes and rejuvenation on these watersheds. The height of base level for streams draining to the Dead Sea ranges from (−302) m∙b.s.l to (−436) m∙b.s.l, with an average of (−400) m∙b.s.l, whereas, the average mean elevation for the Dead Sea watersheds is 813.2 m∙a.s.l. By contrast, the height of base level for streams draining to the River Jordan varies from 11 m∙a.s.l to (−385) m∙b.s.l, with an average of (−285.5) m∙b.s.l, while the average mean elevation for the River Jordan catchments is 737.1 m∙a.s.l. Furthermore, the height of base level for wadis draining to Wadi Araba range from 8 m∙a.s.l to 401 m∙a.s.l, with an average of 135.3 m∙a.s.l, while the average mean elevation for wadi Araba watersheds is 713.9 m∙a.s.l. It is obvious that the Dead Sea constitutes the lowest base level (−436) m∙b.s.l, and the associated watersheds also attained the highest mean elevation (813.2) m∙a.s.l over the Jordan Rift Valley. Therefore, the drainage basins draining to the Dead Sea were affected heavily by successive stages of rejuvenation processes as a result of the progressive lowering of the base level along the Dead Sea. Opposite to the outlet of W. Mujib-Wala, the Dead Sea reaches a maximum depth of −401 m below its surface at a point near its coast midway between the outlets of W. Hasa and W. Zerqa Ma’in to the south and north of W. Mujib-Wala respectively. At this point, the bottom of the Dead Sea is at −815 m below sea level. Beneath much of this northern area, the sea exceeds 300 m in depth [52] . Tectonic activity since the early Miocene, the progressive horizontal movement of the eastern and western blocks of the Rift, and continued uplift of the eastern shoulder of the Rift were accompanied by down-cutting of antecedent gorges of the westward flowing rivers. These processes continued through the Pliocene and Pleistocene (although of prolonged still-stand, free from diastrophic events), thus creating the deep northern sections of the Dead Sea and causing a rapid lowering of its water surface level [59] . With reference to successive sea level change, high magnitude rejuvenation phases occurred and affected the watersheds of the Jordan Rift Valley north of Ghor Al-Ajram (+240 m∙a.s.l, wadi Araba) including the Dead Sea and River Jordan drainage basins. Rejuvenation initiates deeply dissected topography, dense incised drainage, and over steepened and disrupted slopes, but with higher rates characterizing the Dead Sea catchments. Further, all the Rift watersheds undergo high magnitude geomorphic hazards, i.e., slope instability, high sediment yield, flooding, and severe soil erosion loss.
4.2. Hypsometric Integral Values
Recently, it has been argued that hypsometric integral controls the shape of a hypsometric curve, and thereby offers an indicator for geomorphic evolution of drainage basins [31] . In the present investigation, the hypsometric integral values vary from 0.26 (W. Nukhaile, Wadi Araba) to 0.881 (W. Wala, the Dead Sea). Other driving morphometric parameters are also varied among the 22 watersheds (Table 2). Although distinct variation is present in HI values, four main categories of HI can be determined. In the first
Table 2. Hypsometric integrals and other morphometric driving factors for the twenty two watersheds.
category, HI values range from 0.20 - 0.30. This category represents W. Nukhaileh, lower Wadi Araba. The second category (0.40 - 0.59) characterized four catchments in Wadi Araba. A third category of HI values (0.60 - 0.84) is restricted to the watersheds draining to the River Jordan (Figure 8).
Finally, the fourth category of HI values characterize the River Jordan and the Dead Sea catchments and correspond to less eroded “young” landforms where tectonism is a dominant process as compared to erosion. Furthermore, high HI values indicate that high total runoff with subsurface processes constitutes the most significant geomorphic processes. Without exception, all the 22 watersheds are considered of high susceptibility to erosion, incised channel incision and mass movement processes. Examples for the estimated soil erosion loss and annual average sediment yield for different watersheds are: W. Kufranja [55] using RUSLE approach, the Zerqa River [61] using the AGNPS model, and W. Shueib [62] soil erosion susceptibility survey elaborated by van Zuidam [63] [64] , ITC/the Netherland. All these watersheds drain to the River Jordan. Further, it has been concluded that high soil erosion loss was estimated for W. Kerak using the RUSLE model [58] , and for the W. Wala and W. Mujib watersheds using the SWAT model [33] [34] . These studies reported that the rejuvenated belt (the western parts) of W. Kerak, W. Wala, and W. Mujib suffer from high, severe, and extreme soil erosion

Figure 8. HI pattern of the Jordan rift watersheds.
loss, the presence of large old landslide complexes, present active landslides, and flooding. High HI values indicate active tectonics (uplifting, downfaulting, subsidence, and recurrent lowering of the Dead Sea and River Jordan base levels) led to continuous rejuvenation. Here, the average height of base levels is (−400) m∙b.s.l, and (−285.5) m∙b.s.l respectively. The Dead Sea catchments are characterized by high HI values. The youth full status of watersheds makes them the most dynamic and active drainage basins in terms of erosion, as a result of downfaulting, uplifting, and the continuous drop in the Dead Sea base level. Scattered remnants of the Arabia surface are still standing on the eastern margins of these catchments. The sudden change in the directions of streams correlate well with directions of faults and joints, and river capture [65] indicating that fluvial incision has been concentrated along lithological weakness, tectonic lines, and structural discontinuities. The average HI values for the northern W. Araba watersheds is 0.51 (W. Abu Barqa; W. Darba; W. Mulgan and W. Yutm El-Umran), and the average height of base levels is 182.5 m∙a.s.l. These figures denote that these catchments are passing through the mature stage of geomorphic evolution, and their HCs are shaped due to fluvial and slope wash processes [31] . Such watersheds have a slow rate of erosion as is expected [66] unless a high intense rainstorm should occur, resembling heavy rainstorms that occur occasioally in southern Jordan [67] [68] . Such conditions initiate a sudden high runoff peaks, and destructive flash floods associated with large sediment load. Typical landforms which characterized the block-faulted arid depressions are dominant in lower W. Araba such as alluvial fans, scree slopes, and coarse debris materials.
However, Wadi Nukhaileh with it low HI value (0.25), and slight height of base level (115 m∙a.s.l), has a pronounced concave upward curve. Therefore, the drainage basin is considered to be old, with highly eroded landscapes due to its location in a high intensity tectonic zone. Further, the catchment is dissected by a dense network of faults and joints of different order, which displaced the fragile and fragmented masses of carbonate and sandstone rocks towards the lower and the middle reaches of the watershed. Therefore, the catchment has undergone severe erosion and dissection. Although W. Rakiya-Uhemer and W. Yutum are located to the north and south of W. Nukhaileh respectively, the HI values for the two watersheds are high (0.864 and 0.832), and the height of the base levels are 94 m∙a.s.l and 8 m∙a.s.l respectively. By contrast, both watersheds recorded the highest average mean elevation (825 m∙a.s.l) among the 22 Jordan Rift Valley watersheds (Table 2). Consequently, convex upward hypsometric curves were established, and indicated that both watersheds are at the youth-age stage of geomorphic evolution. It is argued elsewhere [16] [19] that in small watersheds the shape of HC is convex and the HI value approaches unity, indicating the prevalence of hillslope processes. Whereas, large catchments show concave curves, and the integral approach zero with fluvial processes prevail. The scale of dependency (i.e. the relation between watershed size and HI value) has also been examined recently by Markose and Jayappa [31] and Farhan et al. [32] using regression analysis. They concluded that HI and size of the basins have a positive relation in small sub-basins, but when the area increases, the relationship becomes negative and weak, which confirms that HI values are controlled by the basin area in the case of small sub-basins rather than larger watersheds. In the present study, variation in drainage basin area is present in the Jordan Rift Valley including the Dead Sea basin. Small and large basins (range from 38 km2 to 6562 km2) exhibit high HI values (range from 0.63 to 0.881) and sharp convex upward curves (Figure 6). The present results are inconsistent with the argument provided above regarding the relation between size of sub-watersheds and HI values. High HI values and sharp convex shapes characterizing the Jordan Rift watersheds are attributed to intense tectonic activity (uplifting and downfaulting), the influence of continuous lowering of the Dead Sea base level during the geomorphic history of the Rift, and rejuvenation. Furthermore, great negative height of the base level (−346 m∙b.s.l) between the plateau and the Dead Sea base level (Table 2) entails high relief energy during rejuvenation phases, thus, resulting in severe erosion, and activates hillslope processes initiating sharp convex upward hypsometric curves and high HI values for both small and large watersheds along the Jordan Rift.
4.3. Regression Analysis: Assessing the Impact of Driving Morphometric Parameters on HI
Hamdouni et al. [69] postulated that high values of HI correspond to youth-stage, active tectonics, whereas, low values of HI pertain to old degraded landscapes that have been more eroded and less influenced by neotectonics and recent tectonic activities. Average HI values for the eastern Rift watersheds (Jordan River, the Dead Sea, and Wadi Araba catchments) are: 0.77, 0.87, and 0.51 respectively. High HI values indicate that these drainage basins are tectonically uplifted, and hillslope processes predominate. Table 2 illustrates the geomorphometric characteristics of the 22 watersheds in order to evaluate their interactive relations. To achieve this purpose, regression analysis was employed to examine the control of the following: steam order, catchment area (km2), height of base level (m), elongation ratio, form factor, and mean height of watersheds on hypsometric integral. Linear regression analysis shows that R2 values (which represent the degree of control of driving parameters on HI) (Table 3, Figures 9(a)-(f)) are positive and generally low (0.026 - 0.224) except for the height of base level (m) parameter, which contributes 0.419 (the F-value is significant at 0.1% level). It is obvious that the
Table 3. R2 values of regression analysis between HI values and morphometric driving.
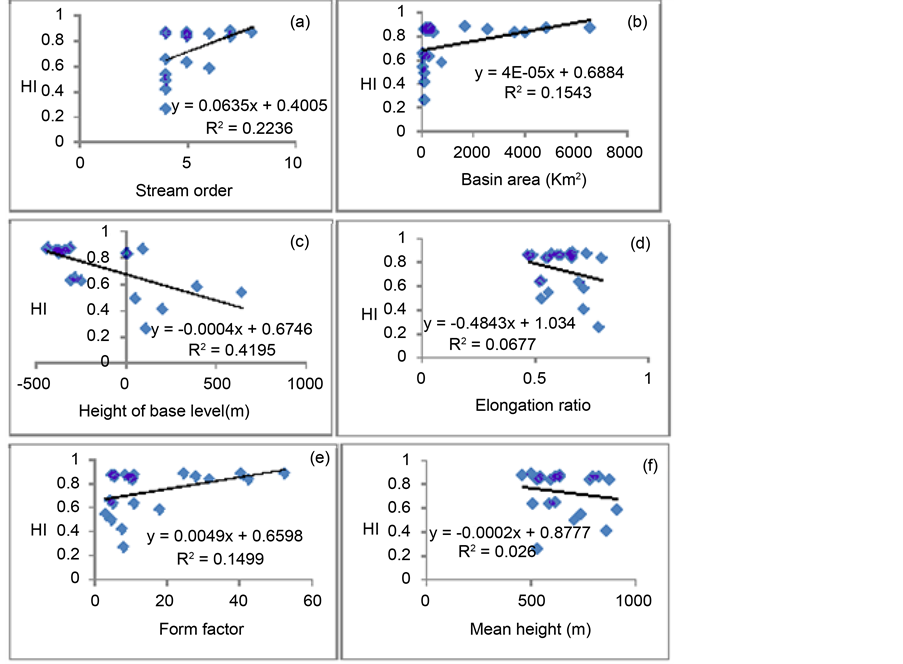
Figure 9. Regression models between the his values and different driving factors (stream order (a), watershed area km2 (b), height of base level m (c), elongation ratio (d), form factor (e), and mean height m (f)).
height of base level (m) for the watershed has a significant control on HI. Whereas other driving parameters show weak relationships, indicating negligible control on HI. The results achieved above have been verified through stepwise regression analysis. In this context, HI parameter is considered the dependent variable, while the other 11 driving parameters are visualized as independent variables. The only variable entered in the analysis was the height of base level (m) of the watershed. The results of stepwise regression show that the total variance explained by this independent variable (R2) is 0.42. The F-value (14.452) is significant at 0.1% level. Thus, 42 percent of variation in HI is explained by the recognized predictor variable (the height of base level (m) Table 4(a) and Table 4(b)).
4.4. Tectonic Control and Geomorphic Development of the Rift Drainage
The geomorphic development of the eastern Jordan Rift drainage systems was ascribed largely to several key factors: tectonic activity that took place along the Rift and its eastern shoulder; the enormous dense faults system and tectonic lineaments affecting the Dead Sea watersheds and eastern Wadi Araba; and intense fluvial erosion following the regional regression of the Tethys late Eocene/Oligocene [70] which resulted in the formation of
(a) (b)
Table 4. Summary of stepwise regression analysis results.
a. Dependent Variable: HI.
a: Dependent Variable HI; b: Predictors: (Constant, height_of_base_level).
the Arabia surface. Remnants of this erosional peneplain (Upper Oligocene age), provide the datum level for reconstructing the phases of geomorphic evolution explaining the role of tectonics (uplifting, and subsidence of the Dead Sea, warping, tilting and faulting) and continued lowering of the base level and progressive rejuvenation of drainage networks. According to Picard [71] , the formation of the modern Rift commenced in the Lower Miocene during the first phase of movement restricted to a horizontal displacement of 62 km, with 3 degrees rotation of the Arabia block relative to the Palestine block. The vertical movement caused warping or faulting of the margins of the blocks at the bulge [59] . Extensive degradation prevailing during the Upper Miocene-Pliocene stripped the Arabia surface from the greater part of the watersheds east of the rift, then replaced by Miocene-Pliocene planation surface. Remnants of the Oligocene peneplain are recognized by the accordance of their summits. It is exposed northeast of W. Wala, and southeast of W. Mujib. Intense erosion associated with rejuvenation during the lower and middle Pleistocene destroyed the Miocene-Pliocene planation surface north of Kerak, but remnants of this surface are still partially preserved south and southeast of W. Kerak and W. Mujib respectively.
The pre-existing drainage system was also disturbed. High tectonic uplift of the eastern Rift shoulder (up to ≈1600 m which represents the height difference between the plateau and the Dead Sea level) produced the plateau landscape which topped up the western part of the watersheds overlooking the Rift. The development of drainage networks encountered tectonic discontinuities (i.e. faults, monoclonal, anticlinal, and synclinal axis) and lineaments. Thus, the directions and abrupt changes indirections of major streams are often controlled by faults and structural joint systems [65] . Furthermore, the deep incision of the canyon system 30 - 50 km east of the Dead Sea (i.e. W. Zerqa Ma’in; W. Mujib-Wala; W. Kerak; W. Hasa) has been possible mainly due to the Zerqa Ma’in fault; Shihan-Siwaqa fault system; the Kerak Al-Fiha fault system; and W. Hasa fault system. However, the incision of W. Mujib canyon is considered to be younger than the Shihan, Shukeik and Dhiban plateau basalt eruptions (Late Miocene/Early Pliocene age, 6 - 8 Ma) as the basalt exposed on the plateau edge of W. Mujib, and did not flow into the canyon. Whereas for the basalt of W. Zerqa Ma’in canyon, and based on the average annual incision rate estimated for the first-order streams (0.33 mm/yr), it is suggested that the incision of W. Zerqa Ma’in canyon is dated to ≈ 4 Ma [65] [72] . The relative age differences between W. Zerqa Ma’in in the north, W. Mujib-Wala, W. Hasa in the south may be attributed to differences in the heights of base level (m) and mean height of watersheds elevation (m). The major canyons of the Dead Sea catchments were probably incised during the time-span between Late Oligocene and the Late Miocene before the second phase of horizontal movement occurred along the Rift. Steinitz and Bartov [72] stated that the proto-main wadi channels of the Dead Sea catchments are probably joined by the great Miocene Hazeva fluvial system to discharge into the Mediterranean Sea through Nahal Besor [73] . Following the development of the Upper Oligocene peneplain until the Middle Miocene, the Dead Sea Rift operates as intermediate basin of the Hazeva drainage system draining the southern and southwestern Levant region [44] . During the Late Miocene intense tectonic activity opened troughs both south of the present Dead Sea and in the Central Jordan Valley, thus previous drainage systems were captured by major streams of the Dead Sea watersheds (i.e. W. Zerqa Ma’in; W. Mujib-Wala; W. Kerak; W. Hasa) and diverted the drainage towards the internal base levels, where large amount of sediments could accumulate. Two stages of Miocene incision were accomplished [65] . Rapid structural and fluvial geomorphic changes took place along the eastern Rift watersheds. The still-stand period of the Middle Pleistocene was interrupted by the second phase of movement in the Late Pleistocene. The horizontal displacement was estimated to be 45 km and the rotation of the Arabia block was  degrees relative to Palestine block [52] [59] . Intense normal faulting during the Pliocene and Pleistocene caused significant differences (up to 1200 m) between the uplifted plateau and subsiding Dead Sea basin. Besides, significant fluvial erosion has resulted in huge quantities of eroded sediments estimated at 113 km3 during the development of the eastern canyon complex. The evidence regarding the second shift along the Rift is illustrated by the configuration of the Dead Sea. It is postulated that the deep northern half of the sea was established during the second phase of movement through the lengthening of the Dead Sea gap by ≈ 45 km. The absence of deltas at the outlets of W. Mujib-Wala and Zerqa Ma’in can only be interpreted by the increase in the Dead Sea length. Following the second movement, the Dead Sea wadis discharged into what is now presents at the southern half of the Dead Sea, south of Lisan Peninsula. All the Dead Sea catchments north of Ghor Al-Ajram supplied a huge bulk of sediments which infilled in this southern portion of the Dead Sea gap. The Lisan Peninsula probably constitutes the detached lower end of the Jordan River floodplain, where the sediments of both geomorphic units are similar. Accordingly, the gap opened across the plain of the Jordan about 20 km from the Dead Sea, the deep northern half of which resulted from its widening.
Wadi Zerqa Ma’in has eroded at least 22.5 km3 of material while forming its gorges, whereas, W. Mujib-Wala excavated a total of 135 km3 of earth material. Since the present volume of the Dead Sea is only 135 km3, where has this immense volume of sediment supply gone? There are no currents to spread them out evenly over the bottom, the absence of subaerial sediments at the outlets is attributed to the Upper Pleistocene and Holocene down faulting along the eastern Rift fault. Khalil [74] concluded that several 100 m of post-Lisan down faulting had commenced. Tectonic analysis carried out by Enzel et al. [75] and Gerson et al. [76] on alluvial fans in Wadi Araba suggest that the surveyed minor fault scarps and terrace risers can be attributed to paleo-earthquakes. Moreover, the pressure exerted by thick deposits over the Dead Sea floor, neotectonics, and seismic activity are possibly causing a gradual sinking of the eastern margins of the Dead Sea at a rate equal to, or even exceeding that of continuous sedimentation at the outlets of the Dead Sea watersheds. Progressive opening and down movement of the Jordan Rift has lowered the base level of the Dead Sea basin, and rejuvenated the streams draining into this tectonic depression, thus, allowing them to erode further and further eastward into the plateau and capturing additional drainage to the Dead Sea. The maximum eastward extension of the rejuvenated drainage, and deep canyon development have been taken place opposite the Dead Sea. North and south of the Dead Sea, head ward erosion towards the east is less and has infringed (but little) on the plateau inland drainage towards the Azraq and El-Jafr depressions. Eastward lower erosion rate may have accounted for less rainfall in the east, a higher base level in Wadi Araba, or, a stronger eastern drainage established by great tilting of the plateau to the east [52] . All the material eroded through incised and rejuvenated drainage dissecting the old erosion surfaces of the plateau has been deposited to form a partial infilling of the Rift Valley. The equilibrium between erosion over the watersheds of the rejuvenated zone and deposition in the Rift has not been accomplished yet, and this is verified by the exposure of solid rock in the floors of the main wadis (i.e. the Yarmouk River; W. Zerqa Ma’in; W. Mujib-Wala; and W. Hasa) draining into the Dead Sea basin. However, in some other wadis grade has been attained in the lower reaches although head ward erosion is still active in cutting back into the plateau. At present, rapid decline in the Dead Sea level has resulted in upstream progressive incision and prominent down cutting of the main wadi channels, and upstream migration of the knickpoints [47] . To conclude, the second phase of movement is still continuous.
The Jordanian Rift aligns the Dead Sea Transform (DST), a major left lateral strike- slip fault, which runs parallel to the eastern fault scarp. The fault has been active since the middle Miocene, and has caused cumulative displacement of 107 km according to Quennell [59] . Various investigations verify tectonic activity, uplifting and minor landform deformation along the Jordan Rift. Examples of alluvial fan and drainage basin offsets were reported in northern Wadi Araba [77] . The deposition of several generations of overlapping, superimposed and dissected alluvial fans in lower Wadi Araba is an indicator of continuous uplifting of the eastern granitic horst and the overlying Paleozoic-Mesozoic sedimentary succession, and active intermountain wadis, whose outlets at the horst front were upraised continuously above the floor of Wadi Araba [78] . Nevertheless, it has been claimed that alluvial fans are considered here an irreplaceable record of neotectonic seismic (earthquake) along the Wadi Araba-Dead Sea Transform DST [79] , where several minor fault scarps and terrace risers are recorded and attributed to paleo earthquakes [75] [76] . The increment of fan slope towards fan head is assigned to sediment buildup and the occurrence of steep normal fault scarps at mountain fronts, which constitutes an indicator of recent uplift in the watershed area. Besides, the alluvial fans were dislocated apart from drainage basins as a result of strike- slip movement along the Dead Sea Transform (DST) and its subsidiary faults [80] . Le Boen et al. [81] estimated the fault slip rate along the Wadi Araba fault to be 5 - 7 mm/yr. On the western part of Wadi Araba, Ginat et al. [82] substantiate incidence of a 15 km left-lateral strike slip displacement along the Dead Sea Transform (DTC) in the Late Pliocene to early Pleistocene. Therefore, dislocation of the western alluvial fan system away from its original location is evident.
Although the Jordan Rift is arid in the past and present, El-Isa and Mustafa [83] reported that slumping in the upper part of the Lisan series is attributed mainly to paleo-earthquakes. The old terrace platforms, and surface of depositions were examined along with reconstructed longitudinal and projected profiles (Figure 10). Seven low- level surfaces were recognized at 650 - 500 m, 300 m, 180 m, 100 m, −20 m, −100 m, and −290 m that had developed in connection with the first movement. Also, it is postulated that continuous lowering of base level was more significant that uplift of the plateau. The longitudinal profiles for major rivers/wadis represent watersheds of the Jordan River, the Dead Sea and Wadi Araba, showing that streams are far from attaining grade, where major discontinuities are portrayed along these profiles (Figure 10(a)). Often a slightly short concave, or long straight segment was observed at the head section of the profile, but no clear concave element exists, which reveals that these wadis do not approach equilibrium status of a profile, or “grade” as suggested by Davis [84] . All watersheds draining into the Jordan Rift Valley do not follow this rule. Thus, it can be demonstrated that age has no influence on the form of the longitudinal profiles, due to successive opening and downward movement of the Rift, associated with progressive lowering of the Dead Sea base level, and the resultant rejuvenation of streams opposite to the Dead Sea, where base level is now the lowest.
Some of the knickpoints displayed frequently represent local variation in rock resistance against erosion, and at least four major knickpoints are accepted as rejuvenation heads (7000 m, 450 m, −100 m, and −250 m), since they coincide with at least three other wadi profiles pertaining to the River Jordan, the Dead Sea, and Wadi Araba watersheds. It is observed that the upper two breaks between 700 m and 450 m are knickpoints truncating the Upper Miocene-Pliocene surface, and they may have developed during early Pleistocene tectonics before the second phase of movement. By contrast, the other lower two knickpoints (−100 m and −250 m) are probably assignable to the Upper Pleistocene tectonics, during the second phase of movement. This conclusion has been supported by major interruptions appearing on the projected profiles illustrating the area opposite the Dead Sea (Figure 10(b) and Figure 10(c)). Here, upland remnants of erosion surfaces, valley-in-valley, benches and terrace phenomena are portrayed. The distribution of major discontinuities on valley-side slopes and longitudinal
 (a)
(a) (b)
(b) (c)
(c)
Figure 10. Longitudinal profiles of selected watersheds (a); projected profiles along the dead sea looking from west to east (b); and from east to west (c).
profiles, are considered to be the product of tectonic downfaulting, uplifting, and subsequent rejuvenation, which resulted in a “poly-cyclic” catchment as proposed by Chorely [85] .
5. Conclusions
Hypsometric analysis for the Jordan Rift watersheds was conducted to decide the age and evolution of landforms, and to identify type of geomorphic processes acting over the watersheds. 12 morphometric parameters related to 22 watersheds were measured using GIS and ASTER DEM. The degree of control of driving parameters on HI values was examined using regression analysis. The role of tectonic activity, uplifting, and rejuvenation processes in determining HI values and other characteristics of the Rift watersheds was assessed. Twenty two watersheds show varied, and high HI values (0.41 - 0.88), with sharp upward convex hypsometric curves. Wadi Nukhaileh (Lower Wadi Araba) as an exception, reveals pronounced low HI value (0.26) and prominent concave upward hypsometric curves. Thus, the wadi is considered as old and highly eroded landscape due to its location in a high intensely tectonic zone, dissection of the watershed by a dense network of faults and joints of different orders, and the exposure of soft carbonate rocks at the middle lower reaches of the catchment. The other 21 watersheds are classified at the youth-age stage of geomorphic development. Thus they are liable to high susceptibility to surface runoff, landsliding, soil erosion loss and flooding. Hillslope processes are encouraged by the presence of soft rock, and structural lineaments/discontinuities across the western parts of the watersheds close to the escarpment overlooking the Rift. Dislocation of alluvial fans, initiation of minor fault scarps and terrace risers, accelerated east head ward erosion of 30 - 50 km, and stream captures are evidences of tectonic uplift and thus, high HI values. Progressive tectonic uplift and subsidence of the base level at the Dead Sea are the main causes of extensive and high rate of Pliocene-Pleistocene fluvial incision along the deep canyons and main wadi courses of the Rift watersheds. Significant fluvial erosion has resulted in large quantities of eroded sediments estimated at 113 km3 during the development of eastern gorge complexes. The eastern Rift drainage basins exhibit a remarkable variation in measured driving parameters, i.e., stream order hierarchy, size of watershed (km2), mean height (m), height of base level (m) and shape factor (elongation ratio, form factor, and circularity ratio). Positive R2 values, but weak relations were achieved through regression analysis which indicates no significant control of driving parameters on hypsometric integral values, whereas, the height of base level (m) is the only important parameter as indicated by R2 value (0.42).
Therefore, the height of base level (m) has a perceivable control on HI. The present results have been verified through stepwise regression analysis. In this context, HI values are considered the dependent variable, while the other 11 driving parameters are treated as independent variables. Again the results show that R2 value is 0.42, and the F-value (14.452) is significant at 0.1% level. Therefore, 42 percent of variation in HI is explained by the recognized predictor variable, or the height of base level (m) parameter. Spatial distribution of HI values does not correlate with the specific type of lithology and climate; instead, high HI values correspond with regional active structures along the Dead Sea Transform (DST) and the associated lowering of the Dead Sea base level. Further, high HI values correspond strongly to neotectonic activity recorded in different parts of the Rift, historical and instrumental seismicity, and the present continuous decline of the Dead Sea level. HI analysis in this regard enables to recognize zones of tectonic activity, uplifting and structural/landforms deformation along the Jordan Rift-Dead Sea Transform. The highest HI values are characteristic of the eastern Jordan River and Dead Sea watersheds; thus, total runoff is expected to be higher, with sub-surface runoff as major process. The estimated average annual sediment yield and soil erosion loss are found to be the highest opposite the Dead Sea and the Jordan River watersheds. Tectonic and erosional processes are both interactive in shaping the landforms over these watersheds. The present rapid decline in the Dead Sea base level has caused upstream progressive incision and down cutting of the main wadi channels, and upstream migration of the knickpoints. The impact of active tectonics, uplifting, base level changes, and rejuvenation has been verified through field observations, statistical evaluation, and cartographic analysis of longitudinal profiles and projected profiles. The old terrace platforms, and surface of deposition were examined earlier [59] along with reconstructed longitudinal and projected profiles, so as to recognize ultimately seven low-level surfaces (at 650 - 500 m, 300 m, 180 m, 11 m, −20 m, −100 m, −290 m) developed in connection with the first tectonic movement. The longitudinal profiles representing major eastern streams of the Jordan Rift show that streams are far from attaining grade, where major breaks are portrayed along these profiles, and no concave element observed at the head segment of the profile. Such conditions indicate that these wadis do not approach equilibrium status of a profile, or “grade” state as suggested earlier by Davis. Thus, it can be demonstrated that age has no influence on the form of the longitudinal profiles, due to progressive opening and downward movement of the Rift, associated with continuous lowering of the Dead Sea base level and retained intense rejuvenation.
Although several observed knickpoints represent local variation in rock resistance against erosion, at least four major knickpoints are accepted as rejuvenation heads (at 700 m, 450 m, −100 m, and −250 m), since they coincide with at least three other stream profiles. The upper two discontinuities (700 m and 450 m) were initiated during early Pleistocene tectonics before the second phase of movement. By contrast, the other two lower knickpoints (−100 m and 250 m) are probably attributed to the Upper Pleistocene tectonics during the second phase of movement. However, high soil erosion loss rates and high average annual sediment yield estimated recently for six watersheds (Zerqa River, W. Kufranja, W. Kerak, W. Shueib, W. Mujib, and W. Wala) opposite the Dead Sea and Jordan River, confirms the fact that the higher HI values denoting the youthful age stage of geomorphic evolution of the catchments, caused higher soil erosion rates and sediment load. Furthermore, the measured HI values have a strong impact on erosion status of a watershed. The related information is helpful in planning for watershed prioritization in order to undertake appropriate decisions regarding the construction of soil and water conservation measures to achieve proper integrated watershed management.
Cite this paper
Farhan, Y., Mousa, R., Dagarah, A. and Shtaya, D. (2016) Regional Hypsometric Analysis of the Jordan Rift Drainage Basins (Jordan) Using Geographic Information System. Open Journal of Geology, 6, 1312-1343. http://dx.doi.org/10.4236/ojg.2016.610096
References
- 1. Strahler, A.N. (1952a) Hypsometric (Area-Altitude) Analysis of Erosional Topography. Geological Society of America Bulletin, 63, 1117-1141.
http://dx.doi.org/10.1130/0016-7606(1952)63[1117:HAAOET]2.0.CO;2 - 2. Lifton, N.A. and Chase, C.G. (1992) Tectonic, Climatic and Lithologic Influences on Landscape Fractal Dimension and Hypsometry: Implications for Landscape Evolution in the San Gabriel Mountain, California. Geomorphology, 45, 77-114.
http://dx.doi.org/10.1016/0169-555X(92)90059-W - 3. Weissel, J., Pratson, L. and Malinverno, A. (1994) The Length-Scaling Properties of Topography. Journal of Geophysical Research, 99, 13997-14012.
http://dx.doi.org/10.1029/94JB00130 - 4. Moglen, G.E. and Bras, R.L. (1995) The Effect of Spatial Heterogeneities on Geomorphic Expansion in a Model of Basin Evolution. Water Resources Research, 31, 2613-2623.
http://dx.doi.org/10.1029/95WR02036 - 5. Masek, J.G., Isacks, B.L. Gubbels, T.L. and Fielding, E.J. (1994) Erosion and Tectonics at the Margins of Continental Plateau. Journal of Geophysical Research, 99, 13941-13956.
http://dx.doi.org/10.1029/94JB00461 - 6. Chen, Y.C., Sung, Q. and Cheng, K.Y. (2003) Along-Strike Variations of Morphotectonic Features in the Western Foothills of Taiwan: Tectonic Implications Based on Stream— Gradient and Hypsometric Analysis. Geomorphology, 56, 109-137.
http://dx.doi.org/10.1016/S0169-555X(03)00059-X - 7. Walcott, R.C. and Summerfield, M.A. (2008) Scale Dependence of Hypsometric Integrals: An Analysis of South African Basins. Geomorphology, 96, 174-186.
http://dx.doi.org/10.1016/j.geomorph.2007.08.001 - 8. Rutlege, A.N. and Christensen, P.R. (2010) Hypsometry of Lobate Debris Aprons on the Eastern Rim of Hellas Basin, Mars: Implications for Climate Variations. American Geophysical Union, Fall Meeting, Abstract No. P5IB-1426.
- 9. Dowling, T.I., Richardson, D.P., Sullivan, A.O., Summerell, G.K. and Walker, J. (1998) Application of Hypsometric Integral and other Terrain Based Metrics as Indicators of the Catchment Health: A Preliminary Analysis. Technical Report 20/98. CSIRO, Land and Water, Canberra.
- 10. Langbein, W.B. (1947) Topographic Characteristics of Drainage Basins. USGS Water Supply Paper, 947-C, 157 p.
- 11. Strahler, A.N. (1952b) Dynamic Basis of Geomorphology. Geological Society of American Bulletin, 63, 923-938.
http://dx.doi.org/10.1130/0016-7606(1952)63[923:DBOG]2.0.CO;2 - 12. Strahler, A.N. (1957) Quantitative Analysis of Watershed Geomorphology. Transactions, American Geophysical Union, 138, 913-938.
http://dx.doi.org/10.1029/TR038i006p00913 - 13. Strahler, A.N. (1964) Quantitative Geomorphology of Drainage Basins and Channel Networks. In: Chow, V.T., Ed., Handbook of Applied Hydrology, McGraw–Hill, New York, 4-39/4-76.
- 14. Miller, V. (1953) A Quantitative Geomorphic Study of Drainage Basin Characteristics in the Clinch Mountain Area, Virginia and Tennessee. Project NR 389-402, Technical Report 3, Columbia University, Department of Geology, ONR, New York.
- 15. Schumm, S. (1956) Evolution of Drainage Systems and Slopes in Badlands at Perth Amboy, New Jersey. Geological Society of America Bulletin, 67, 597-646.
http://dx.doi.org/10.1130/0016-7606(1956)67[597:EODSAS]2.0.CO;2 - 16. Hurtrez, J.E., Sol, C. and Lucazeau, F. (1999) Effect of Drainage Area on Hypsometry Form Analysis of Small Scale Drainage Basins in the Swalik Hills (Central Nepal). Earth Surface Processes and Landforms, 24, 799-808.
http://dx.doi.org/10.1002/(SICI)1096-9837(199908)24:9<799::AID-ESP12>3.0.CO;2-4 - 17. Bishop, M., Shroder, J., Bonk, R. and Olsenholler, J. (2002) Geomorphic Change in High Mountains: A Western Himalayan Perspective. Global Planetary Change, 32, 311-329.
http://dx.doi.org/10.1016/S0921-8181(02)00073-5 - 18. Harrison, C.G., Miskell, K.J., Brass, G.W., Saltzman, E.S. and Sloan II, J.L. (1983) Continental Hypsography. Tectonics, 2, 357-377. http://dx.doi.org/10.1029/TC002i004p00357
- 19. Willgoose, G.R. and Hancock, G. (1998) Revisiting the Hypsometric Curve as an Indicator of Form and Process in Transport Limited Catchment. Earth Surface Processes and Landforms, 23, 611-623.
http://dx.doi.org/10.1002/(SICI)1096-9837(199807)23:7<611::AID-ESP872>3.0.CO;2-Y - 20. Huang, X.L. and Niemann, J.O. (2006) An Evaluation of the Geomorphically Effective Event for Fluvial Processes Over Long Periods. Journal of Geophysical Research, 111, 1-17.
http://dx.doi.org/10.1029/2006JF000477 - 21. Siddiqui, S. and Soldati, M. (2014) Appraisal of Active Tectonics Using Dem-Based Hypsometric Integral and Trend Surface Analysis in Emilia-Romagna Apennines, Northern Italy. Turkish Journal of Earth Sciences, 23, 277-292.
http://dx.doi.org/10.3906/yer-1306-12 - 22. Singh, O. and Sarangi, A. (2008) Hypsometric Analysis of Lesser Himalayan Watersheds Using Geographical Information System. Indian Journal of Soil and Water Conservation, 36, 148-154.
- 23. Singh, T. (2008) Hypsometric Analysis of Watersheds Developed on Actively Deforming Mohand Anticline Ridge, NW Himalaya. Geocarto International, 23, 417-427.
http://dx.doi.org/10.1080/10106040801965821 - 24. Singh, O. (2009) Hypsometry and Erosion Proneness: A Case Study in the Lesser Himalayan Watersheds. Indian Journal of Soil and Water Conservation, 8, 53-59.
- 25. Kusre, B.C. (2013) Hypsometric Analysis and Watershed Management of Diyung Watershed in North Eastern India. Journal of Geological Society of India, 82, 262-270.
http://dx.doi.org/10.1007/s12594-013-0148-x - 26. Sarangi, A. and Bhattacharya, A. (2000) Use of Geomorphological Parameters for Sediment Yield Prediction from Watersheds. Journal of Soil and Water Conservation, 44, 99-106.
- 27. D'Alessandro, L., Dd Monte, M., Fredi, P., Lupia Palmieri, E. and Peppoloni, S. (1999) Hypsometric Analysis in the Study of Italian Drainage Basin Morphoevolution. Transactions, Japanese Geomorphological Union, 20, 187-202.
- 28. Luo, W. (1998) Hypsometric Analysis with a Geographic Information System. Computer Geosciences, 24, 815-821.
http://dx.doi.org/10.1016/S0098-3004(98)00076-4 - 29. Luo, W. (2000) Quantifying Groundwater-Sapping Landforms with a Hypsometric Technique. Journal of Geophysical Research, 105, 1685-1694.
http://dx.doi.org/10.1029/1999JE001096 - 30. Luo, W. (2002) Hypsometric Analysis of Margaritifer Sinus and Origin of Valley Network. Journal of Geophysical Research, 107, 50-75.
http://dx.doi.org/10.1029/2001JE001500 - 31. Markose, V.J. and Jayappa, K.S. (2011) Hypsometric Analysis of Kali River Basin, Karnataka, India, Using Geographic Information System. Geocarto International, 26, 553-568.
http://dx.doi.org/10.1080/10106049.2011.608438 - 32. Farhan, Y., Elgaziri, A., Elmaji, I. and Ali, I. (2016a) Hypsometric Analysis of Wadi Mujib– Wala Watershed (Southern Jordan) Using Remote Sensing and GIS Techniques. International Journal of Geosciences, 7, 158-176.
- 33. Ijam, A. and Al-Mahamid, M. (2012) Predicting Sedimentation at Mujib Dam Reservoir in Jordan. Jordan Journal of Civil Engineering, 6, 448-463.
- 34. Ijam, A. and Tarawneh, E. (2012) Assessing of Sediment Yield for Wala Dam Catchment Area in Jordan. European Water, 38, 43-58.
- 35. Bleacher, J.E. and Greeley, R. (2008) Relating Volcano Morphometry to the Development Progression of Hawaiian Shield Volcanoes through Slope and Hypsometric Analysis of SRTM Data. Journal of Geophysical Research, 113, B09208.
http://dx.doi.org/10.1029/2006JB004661 - 36. Mark, R.K. and Moore, J.G. (1987) Slopes of the Hawaiian Ridge. In: Decker, R.W., Ed., Volcanism in Hawaii. U.S., Geological Survey Professional Paper, 1350, 101-108.
- 37. Moore, J.G. and Mark, R.K. (1992) Morphology of the Island of Hawaii. GS4 Today, 2, 257-262.
- 38. Rowland, S.K. and Garbeil, H. (2000) Slopes of Oceanic Basalt Volcanoes. In: Mouginis– Mark, P.J., Crisp, J. and Fink, J., Eds., Remote Sensing of Active Volcanism, Geophysical Monograph, American Geophysical Union, Washington DC.
http://dx.doi.org/10.1029/gm116p0223 - 39. Harlin, J.M. (1984) Watershed Morphometry and Time to Hydrograph Peak. Journal of Hydrology, 67, 141-154.
http://dx.doi.org/10.1016/0022-1694(84)90238-5 - 40. Yunus, A.P. (2016) Geomorphic and Lithologic Control on Bedrock Channels in Drainage Basins of the Western Arabian Peninsula. Arab Journal of Geosciences, 9, 133-146.
http://dx.doi.org/10.1007/s12517-015-2179-7 - 41. Garfunkel, Z. (1970) Tectonics of the Western Margins of the Southern Arava. Doctoral Dissertation, Hebrew University of Jerusalem, Jerusalem.
- 42. Freund, R., Garfunkel, Z., Zak, I., Goldberg, M., Weissbrod, T. and Derin, B. (1970) The Shear along the Dead Sea Rift. Philosophical Transactions of the Royal Society of London, A267, 107-130. http://dx.doi.org/10.1098/rsta.1970.0027
- 43. Wdowinski, S. and Zibermann, E. (1997) Systematic Analysis of the Large-Scale Topography and Structure across the Dead Sea Rift. Tectonics, 16, 409-424.
http://dx.doi.org/10.1029/97TC00814 - 44. Horowitz, A. (1987) Palynological Evidence for the Age and Rate of Sedimentation along the Dead Sea Rift, and Structural Implications. Tectonophysics, 141, 107-115.
http://dx.doi.org/10.1016/0040-1951(87)90178-8 - 45. Kashai, E.L. and Croker, P.F. (1987) Structural Geometry and Evolution of the Dead Sea– Jordan Rift System as Deduced From New Sub-Surface Data. Tectonophysics, 141, 33-60.
http://dx.doi.org/10.1016/0040-1951(87)90173-9 - 46. Ten Brink, U.S., Ben-Avraham, Z., Bell, R.E., Hassouneh, M., Coleman, D.F., Anreasen, G., Tibor, G. and Coakley, B. (1993) Structure of the Dead Sea Pull—A Part Basin from Gravity Analysis. Journal of Geophysical Research, 98, 21877-21894.
http://dx.doi.org/10.1029/93JB02025 - 47. Hassan, M.A. and Klein, M. (2002) Fluvial Adjustment of the Lower Jordan River to a Drop in the Dead Sea Level. Geomorphology, 45, 21-33.
http://dx.doi.org/10.1016/S0169-555X(01)00187-8 - 48. Begin, B.Z., Meyer, D.F. and Schumm, S.A. (1981) Development of Longitudinal Profiles of Alluvial Channels in Response to Base Level Lowering. Earth Surface Processing and Landforms, 6, 49-68.
http://dx.doi.org/10.1002/esp.3290060106 - 49. Bonneau, P.R. and Snow, S.T. (1992) Character of Headwater Adjustment to Base Level Drop, Investigated by Digital Modeling. Geomorphology, 5, 475-487.
http://dx.doi.org/10.1016/0169-555X(92)90019-K - 50. Summerfield, M.A. (1991) Global Geomorphology. Longman, Essex.
- 51. Al Rawashdeh S., Ruzouq, R., Al-Fugara, A., Pradhan, B., Abu-Hamatteh Ziad, S.H. and Abu Rumman, G. (2013) Monitoring of Dead Sea Water Surface Variation Using Multi- Temporal Satellite Data and GIS. Arab Journal of Geosciences, 6, 3241-3248.
- 52. Burdon, D. (1959) Handbook of the Geology of Jordan. Benham and Co., Colchester.
http://dx.doi.org/10.1007/s12517-012-0630-6 - 53. Beaumon, P. and Atkinson, K. (1969) Soil Erosion and Conservation in Northern Jordan. Journal of Soil and Water Conservation, 24, 144-147.
- 54. Fisher, W., Atkinson, K., Beaumont, P., Coles, A. and Gilchrist-Shirlaw, D. (1966) Soil Survey of Wadi Zeqlab, Jordan. University of Durham, Durham.
- 55. Farhan, Y., Zregat, D. and Farhan, I. (2013) Spatial Estimation of Soil Erosion Risk Using RUSLE Approach, RS and GIS Techniques: A Case Study of Kufranja Watershed, Northern Jordan. Journal of Water Resources and Protection, 5, 1247-1261.
http://dx.doi.org/10.4236/jwarp.2013.512134 - 56. Oroud, I. (2015) Water Budget Assessment for a Typical Watershed in the Karak Plateau, Jordan. Jordan Journal of Earth and Environmental Sciences, 7, 109-117.
- 57. Pike, R.J. and Wilson, S.E. (1971) Elevation-Relief Ratio, Hypsometric Integral and Geomorphic Area—Altitude Analysis. Geological Society of America Bulletin, 82, 1079-1084.
http://dx.doi.org/10.1130/0016-7606(1971)82[1079:ERHIAG]2.0.CO;2 - 58. Farhan, Y. and Nawaysa, S. (2015) Spatial Assessment of Soil Erosion Risk Using RUSLE and GIS Techniques. Environmental Earth Sciences, 74, 4649-4669.
http://dx.doi.org/10.1007/s12665-015-4430-7 - 59. Quennell, A. (1958) The Structure and Geomorphic Evolution of the Dead Sea Rift. Quarterly Journal of the Geological Society, 114, 1-24.
http://dx.doi.org/10.1144/gsjgs.114.1.0001 - 60. Farhan, Y., Anaba, O. and Salim, A. (2016) Morphometric Analysis and Flash Floods Assessment for Drainage Basins of the Ras En Naqb Area, South Jordan Using GIS. Journal of Geosciences and Environmental Protection, 4, 4-33.
- 61. Al-Sheriadeh, M.S., Malkawi, A.H., Al-Hamdan, A. and Abderahman, N. (2000) Evaluating Sediment Yield at King Talal Reservoir from Landslides along Irbid-Amman Highway. Engineering Geology, 56, 361-372.
http://dx.doi.org/10.1016/S0013-7952(99)00119-2 - 62. Farhan, Y. and Anaba, O. (2016) A Remote Sensing and GIS Approach for Prioritization of Wadi Shueib Mini Watersheds (Central Jordan) Based on Morphometric and Soil Erosion Susceptibility Analysis. Journal of Geographic Information System, 8, 1-19.
http://dx.doi.org/10.4236/jgis.2016.81001 - 63. Van Zuidam, R. (1979) Terrain Analysis and Classification Using Aerial Photographs: A Geomorphological Mapping. Smits Publishers, The Hague.
- 64. Van Zuidam, R. (1985) Aerial Phgoto-Interpretation inTerrain Analysis and Geomorphological Mapping. Smits Publishers, The Hague.
- 65. de Jaegar, C. and de Dapper, M. (2002) Tectonic Control in the Geomorphic Development of the Wadi el-Mujib Canyon (Jordan). EGU Stephan Mueller Special Publication Series, 2, 83-94.
http://dx.doi.org/10.5194/smsps-2-83-2002 - 66. Ritter, D.F., Kochel, R.Ce. and Miller, J.R. (2011) Process Geomorphology. 5th Edition, Long Grove, IL.
- 67. Farhan, Y. (2014) Geomorphological Evaluation for Urban Development Using Remote Sensing and GIS. Southern Coast of Aqaba, Jordan. Journal of Environment and Earth Sciences, 4, 104-118.
- 68. Farhan, Y. and Anbar, A. (2014) Fragile Landscape: Impact and Consequences of May 2014 Flash-Flood Disaster in the Aqaba Area, Southern Jordan. Research Journal of Environment and Earth Sciences, 6, 451-465.
- 69. El Hamdouni, R., Irigaray, C., Fernandes, T., Chacon, J. and Keller, E. (2007) Assessment of Relative Active Tectonics, Southwest Border of Sierra Nevada (Southern Spain). Geomorphology, 96, 150-173.
http://dx.doi.org/10.1016/j.geomorph.2007.08.004 - 70. Barjous, M. and Mikbel, S. (1990) Tectonic Evolution of the Gulf of Aqaba-Dead Sea Transform Fault System. Tectonophysics, 180, 49-59.
http://dx.doi.org/10.1016/0040-1951(90)90371-E - 71. Picard, L. (1943) Structure and Evolution of Palestine. Bulletin of the Geology Department, Hebrew University, 4, 1-35.
- 72. Steinitz, G. and Bartov, Y. (1992) The Miocene-Pleistocene History of the Dead Sea Segment of the Rift in light of K-Ar Ages of Basalts. Israel Journal of Earth Sciences, 38, 199- 208.
- 73. Zak, I. and Freund, R. (1980) Asymmetry and Basin Migration in the Dead Sea Rift. Tectoniophysics, 80, 27-38.
http://dx.doi.org/10.1016/0040-1951(81)90140-2 - 74. Khalil, B. (1992) The Geology of the Ar Rabba Area—Maps Sheet No. 3152 IB. Geology Directorate NRA, Geological Mapping Division, Amman, 22.
- 75. Enzel, Y., Amit, R., Bruce, H., Harrison, J. and Porat, N. (1994) Morphologic Dating of Fault Scarps and Terrace Risers in the Southern Arava, Israel: Comparison to Other Age- Dating Techniques and Implications for Paleoseismicity. Israel Journal of Earth Sciences, 43, 91-103.
- 76. Gerson, R., Grossman, S., Amit, R. and Greenbauim, N. (1993) Indicators of Faulting Events and Periods of Quiescence in Desert Alluvial Fans. Earth Surface Processes and Landforms, 18, 181-202.
http://dx.doi.org/10.1002/esp.3290180303 - 77. Klinger, Y., Avouac, J.P., Abu Karaki, N., Dorbath, L., Bourles, D. and Reyss, L. (2000) Slip rate on Dead Sea Transform Fault in Northern Araba Valley (Jordan). Geophysics Journal International, 142, 755-768.
http://dx.doi.org/10.1046/j.1365-246x.2000.00165.x - 78. Makhlouf, I.M., Amireh, B.S. and Abed, A.M. (2010) Sedimentology and Morphology of Quaternary Alluvial Fans in Wadi Araba, Southwest Jordan. Jordan Journal of Earth and Environmental Sciences, 3, 79-98.
- 79. Garfunkel, Z., Zak, I. and Freund, R. (1981) Active Faulting in the Dead Sea Rift. Tectonophysics, 80, 1-26.
http://dx.doi.org/10.1016/0040-1951(81)90139-6 - 80. Saqqa, W.A. and Atallah, M.Y. (2013) Tectonic Geomorphology of Alluvial Fans East of the Wadi Araba Fault (Dead Sea Transform), Jordan. Jordan Journal of Earth and Environmental Sciences, 5, 79-86.
- 81. Le Beon, M., Klinger, Y., Meriaux, A.S., Al-Qarioti, M., Finkel, R.C., Mayyas, O. and Tapponier, P. (2012) Quaternary Morphotectonic Mapping of the Wadi Araba and Implications for the Tectonic Activity of Southern Dead Sea Fault. Tectonics, 31, TC 5003.
- 82. Ginat, H., Enzel, Y. and Avni, Y. (1998) Translocated Plio-Pleistocens Drainage Systems Along the Arava Fault of the Dead Sea Transform. Tectonophysics, 284, 151-160.
http://dx.doi.org/10.1016/S0040-1951(97)00165-0 - 83. El-Isa, Z. and Mustafa, H. (1986) Earthquake Deformations in the Lisan Deposits and Seismotectonic Implication. Geophysical Journal of the Royal Astronomy Society, 86, 413- 424.
http://dx.doi.org/10.1111/j.1365-246X.1986.tb03835.x - 84. Davis, W.M. (1909) Geographical Essays, Ginn (Reprinted 1954). Dover, Boston.
- 85. Chorely, R. (1958) Aspects of the Morphometry of a “Polycyclic” Drainage Basin. The Geographical Journal, 124, 370-374.
http://dx.doi.org/10.2307/1790789