Optics and Photonics Journal
Vol.2 No.3A(2012), Article ID:23306,4 pages DOI:10.4236/opj.2012.223037
Photonic Crystal Based Direct and Inverse Heterostructures by Colloidal Self-Assembly
1Department of Physics, Indian Institute of Technology Bombay, Mumbai, India
2Theoretical Physics Division, Physical Research Laboratory, Ahmedabad, India
3IITB-Monash Research Academy, IIT Bombay, Mumbai, India
4Department of Physics, Indian Institute of Technology Kanpur, Kanpur, India
Email: *rvijaya@iitk.ac.in
Received June 18, 2012; revised July 16, 2012; accepted July 26, 2012
Keywords: Photonic Crystal; Heterostructure; Self-Assembly; Sol-Gel; Inverse Photonic Crystal; Dual Stop Bands
ABSTRACT
Photonic crystal heterostructures containing two materials and/or two lattice constants are synthesized using the colloids of polystyrene and polymethyl methacrylate by a self-assembling technique. These direct heterostructures with double stop band are infiltrated with zinc oxide by sol-gel method, followed by the removal of the original polymer template by a wet-etching process to result in inverse heterostructures made of zinc oxide. A red shift in the wavelength of stop bands is observed when the crystal is infiltrated with zinc oxide and a blue shift after inversion, in concurrence with the changes in the effective index of the structure. The stop band is also calculated to extract the number of layers and the extinction co-efficient contributing to the heterostructure. This structure made by a room-temperature low-cost technique produces a sparsely-filled zinc oxide crystal with a single refractive index but containing two different periodicities in a layered arrangement that can be used as a lab-on-a-chip for dualor multi-wavelength sensing applications.
1. Introduction
Colloidal photonic crystals (PhCs) with their spatially periodic variation of refractive index forbid a certain range of wavelength of electromagnetic waves from propagating along a particular direction through the structure. If this transmission stop band is engineered to be in an appropriate wavelength range of the electromagnetic spectrum, applications such as miniaturized optical filters, low-threshold lasers [1] and optical switches/sensors [2] become possible. The scope of utility of these structures can be further increased if two or more wavelength ranges can be controlled simultaneously with the help of multiple stop bands within a single structure such as in PhC heterostructures (HS). Twoand three-dimensionally (2- D and 3-D) ordered HS made of PhCs have been used for different applications such as low-loss waveguides, wavelength selective mirrors, high-efficiency add-drop filters [3], polarization beam splitters [4], and nanocavities with high quality factor [5].
A minimum of two lattice constants or two refractive index contrasts within a periodic structure constitute a HS. In the fabrication method of colloidal self-assembly, the lattice constant variation is possible by using a material with two different colloidal diameters, while the refractive index can be changed by using two different colloidal materials during fabrication or by infiltrating with different dopants. Earlier work has demonstrated the capability to fabricate non-polymeric and polymeric PhC HS by different techniques [6-8]. In contrast to these works, we discuss the fabrication and characterization of a porous structure containing periodically-arranged air spheres connected by a fine solid skeleton made of ZnO and possessing two different lattice constants by a simple roomtemperature technique.
Throughout this work, inexpensive techniques have been used in the growth and subsequent inversion of the PhCs. The ease of fabrication of these direct and inverse HS as well as the clarity provided by the characterization results establish the possibility of obtaining devices such as a broadband reflective filter and wavelength-selective spectrometer proposed in [9,10]. The PhC HS can also serve as a lab-on-a-chip template, since the porous structure can be infiltrated with a variety of materials for further studies. It is especially useful for those materials that cannot be processed as colloids or grown in an ordered arrangement independently by self-assembly.
2. Experimental Details
Colloidal particles of poly methyl methacrylate (PMMA) with average sphere diameters of 287 nm (referred to as A1) and 411 nm (A2) as well as polystyrene (PS) spheres with average diameters of 264 nm (B1), 277 nm (B2), 306 nm (B3) and 803 nm (B4) are used in the fabrication of PhC, using the inward growing self-assembly technique [11]. In this method, the colloidal globules arrange themselves in a face-centered cubic (fcc) lattice geometry and contain tetrahedral and octahedral interconnected voids. The second type of PhC is grown on the top of the first PhC after it is heated in an oven at 50˚C for 2 h to ensure complete drying and then cooled down to the room temperature. The resulting composite structure is a direct HS.
Five different direct HS with three types of stacking are fabricated and characterized. In the first structure, PMMA 411 nm PhC is grown on the top of a PS 264 nm PhC (named as B1A2). This contains two different materials and two different lattice constants. In the second case, PMMA 411 nm PhC is grown on the top of PMMA 287 nm PhC (A1A2), PMMA 287 nm crystal is grown on PMMA 411 nm PhC (A2A1) and PS 306 nm PhC is grown on PS 277 nm PhC (B2B3). In these cases, the materials are the same but the lattice constants are different. In the third combination, PS 803 nm PhC is grown on PMMA 287 nm PhC (A1B4). This is similar to the first case but more complicated due to the large difference in colloidal diameters.
One may note that the set of five HS studied here includes PS on PMMA, PMMA on PS, as well as the two different cases of large/small diameter colloids on the top. The voids of HS are then infiltrated with ZnO prepared by sol-gel method and the polymer is removed by wet-chemical technique to result in inverse HS. Details of the sol preparation, infiltration and inversion procedure have been reported earlier [12]. Other than these techniques, the inverse PhC can also be fabricated using a variety of templates by different infiltration and inversion methods [13]. In the present work, the infiltration of the ZnO sol into the voids of the HS is carried out after growing both layers of the PhC unlike the case in [14].
3. Results and Discussion
Images are recorded on scanning electron microscope (SEM) for the individual PhCs and the HS, both in their direct and inverse forms. In the individual PhC, the hexagonal arrangement on the top surface parallel to the substrate (Figure 1(a)) and square arrangement in the cross-section of the crystal perpendicular to the substrate (Figure 1(b)) represent the  and
and  planes of the fcc lattice, respectively [15]. In Figures 1(c) and (d), the SEM images of ZnO inverse PhC obtained from PMMA 287 nm and PS 264 nm respectively are shown. The ZnO net surrounding the air spheres is clearly visible in both the pictures. The original lattice arrangement of the direct PhC is not disturbed during infiltration and inversion process. The underlying layer of the crystal is also visible in these images. The average diameter of the air spheres in the case of Figures 1(c) and (d) are 277 nm and 234 nm respectively as measured from the SEM images. These values are nearly equal to the diameters of the polymer spheres before inversion.
The SEM images of the direct and inverse HS are shown in Figures 1(e) and (f) respectively. The SEM image of B1A2 direct HS is shown in Figure 1(e). The lower PhC is seen on the left and the upper PhC is seen on the right of the image. The hexagonal arrangement of the spheres in both the layers of the HS is noticeable and the colloidal diameter of the lower PhC is lesser than that of the upper PhC. Figure 1(f) is the ZnO inverse HS obtained from A2A1 with the lower crystal on the left and the upper crystal on the right of the image. The hexagonal arrangement of air spheres with ZnO skeleton in the two layers of the PhC can be seen. The sphere diameter
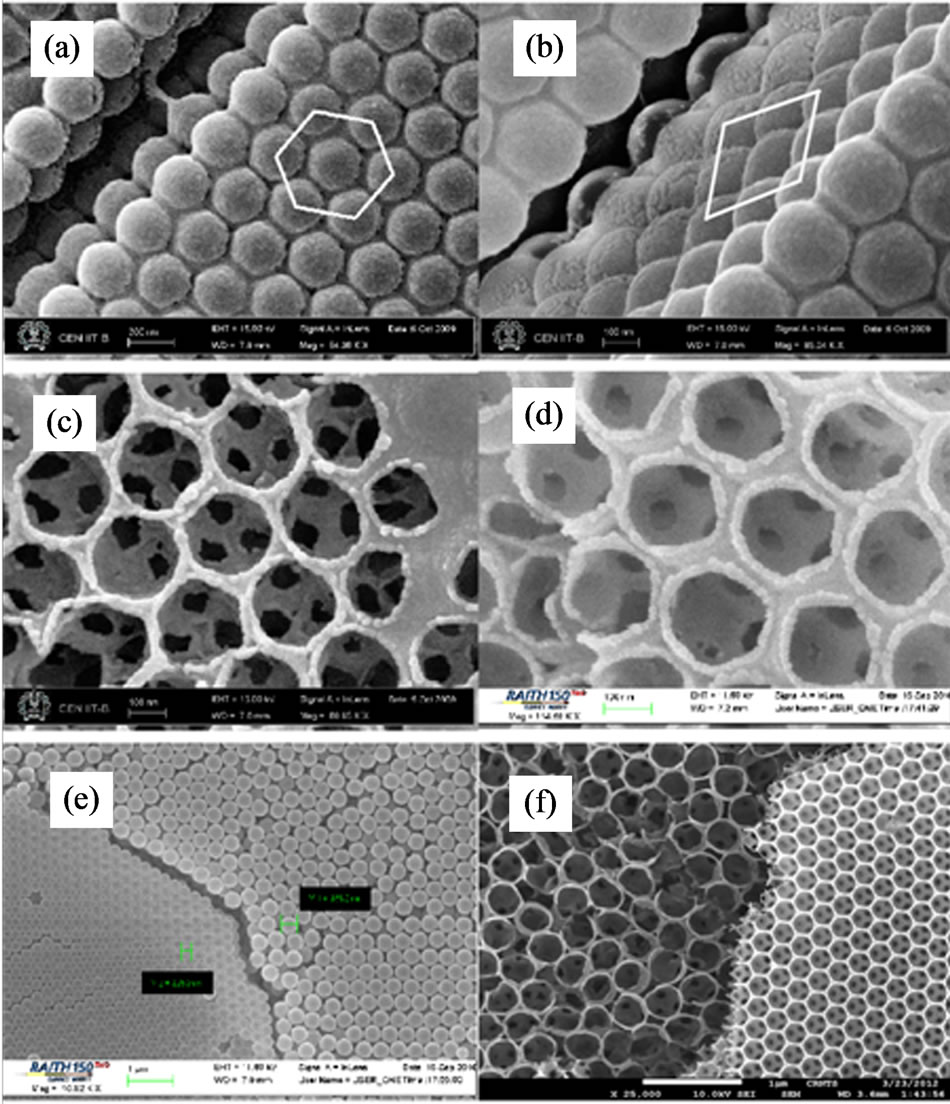
Figure 1. SEM images of (1) ZnO infiltrated PS 264 nm PhC where the (a)  plane is seen on the top (scale bar is 200 nm) and (b) the
  plane is seen in the cross-section (scale bar is 100 nm), (2) ZnO inverse PhC obtained from (c) PMMA_287 nm PhC and (d) PS_264 nm PhC (scale bar is 100 nm) and (3) direct B1A2 HS is seen in (e) (scale bar is 1 µm) while inverse HS obtained from A2A1 is seen in (f) (scale bar is 1 µm).
of the lower part is more than of the upper part as required for A2A1.
The reflection spectrum of the crystal is recorded using a spectrophotometer (Perkin-Elmer Lambda-950 UV-Vis-NIR) attached with a universal reflectance accessory for angle-dependent specular reflectance measurements. The beam from the spectrophotometer covers an area of (12.5 × 5) mm2 on the crystal surface, thus illuminating multiple single-crystalline domains. These domains have an average area of (300 × 300) mm2. This measurement gives the quantitative information about the photonic stop band wavelength, its dependence on the effective refractive index of the crystal, and the number of ordered layers present, as well as a qualitative indication of disorder. The effective refractive index is , where e is the dielectric constant and f is the fill fraction, while 1 and 2 refer to the sphere and the background, respectively. The inter-planar distance (d) for
  plane of the fcc lattice is given by
  while
while , where a is the lattice constant and D is the diameter of the colloidal sphere. The modified Bragg’s law for first-order diffraction from the
  plane gives
  where lo is the wavelength of maximum reflectance and q is the angle of incidence.
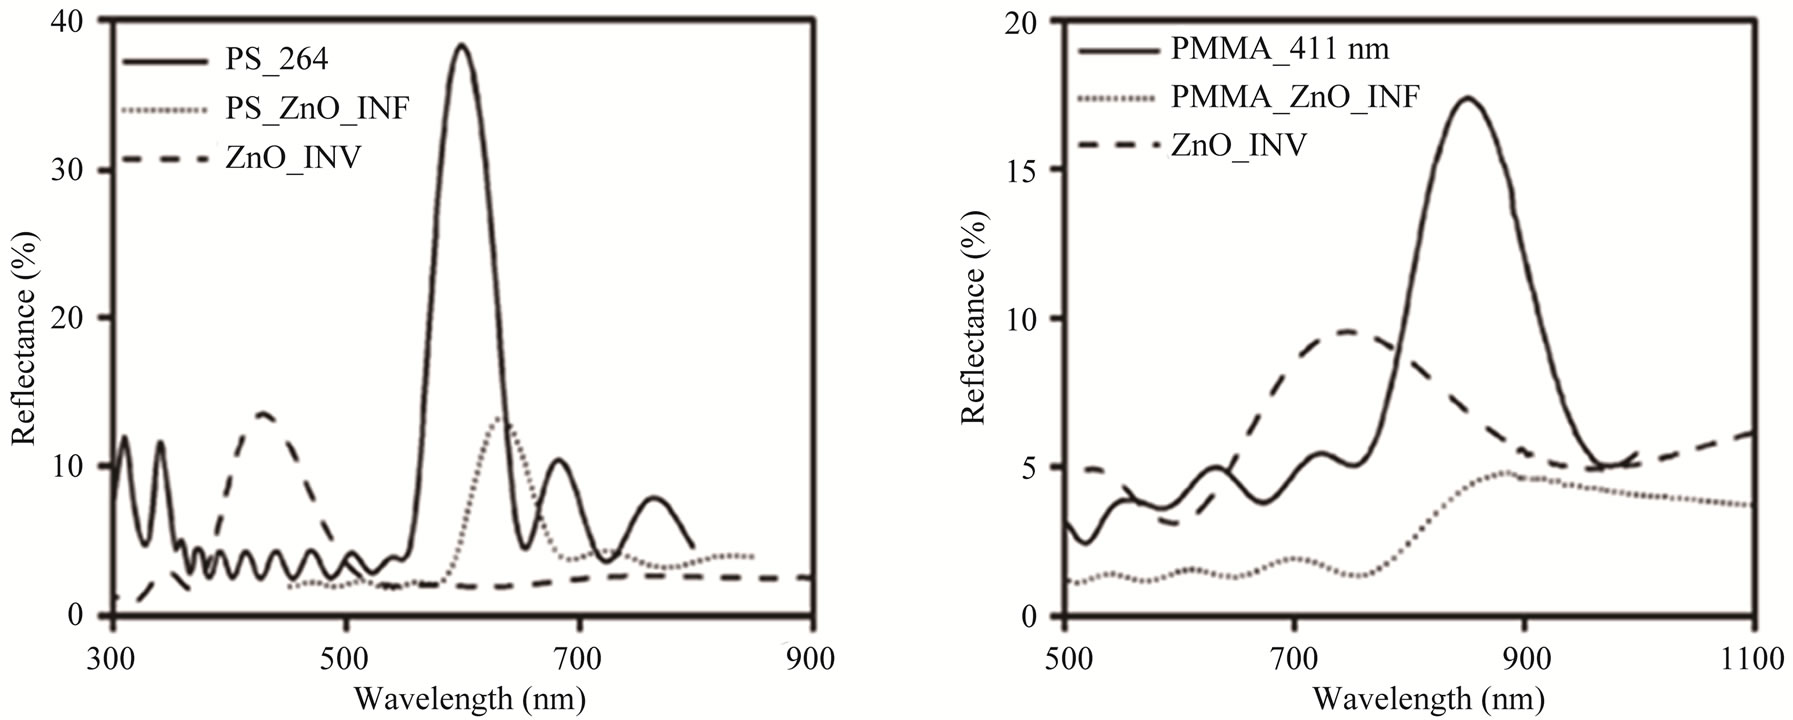
The variation of specular reflectance (R) as a function of wavelength (l) is shown in Figure 2. The single PhC gives predictable results. The solid line in Figure 2(a) is the reflection spectrum of PS 264 nm PhC showing a maximum of 38% reflectance at 598 nm. Considering the refractive indices of PS, PMMA, ZnO and air to be 1.59, 1.49, 2.00 and 1.00 respectively, and assuming the ideal fill fraction (of 0.74 for the sphere) in an fcc lattice, the neff of the PhC increases from 1.46 to 1.70 when the crystal is infiltrated with ZnO. As a result, the reflection maximum is observed to shift to 634 nm (dotted line),
 (a)
(a)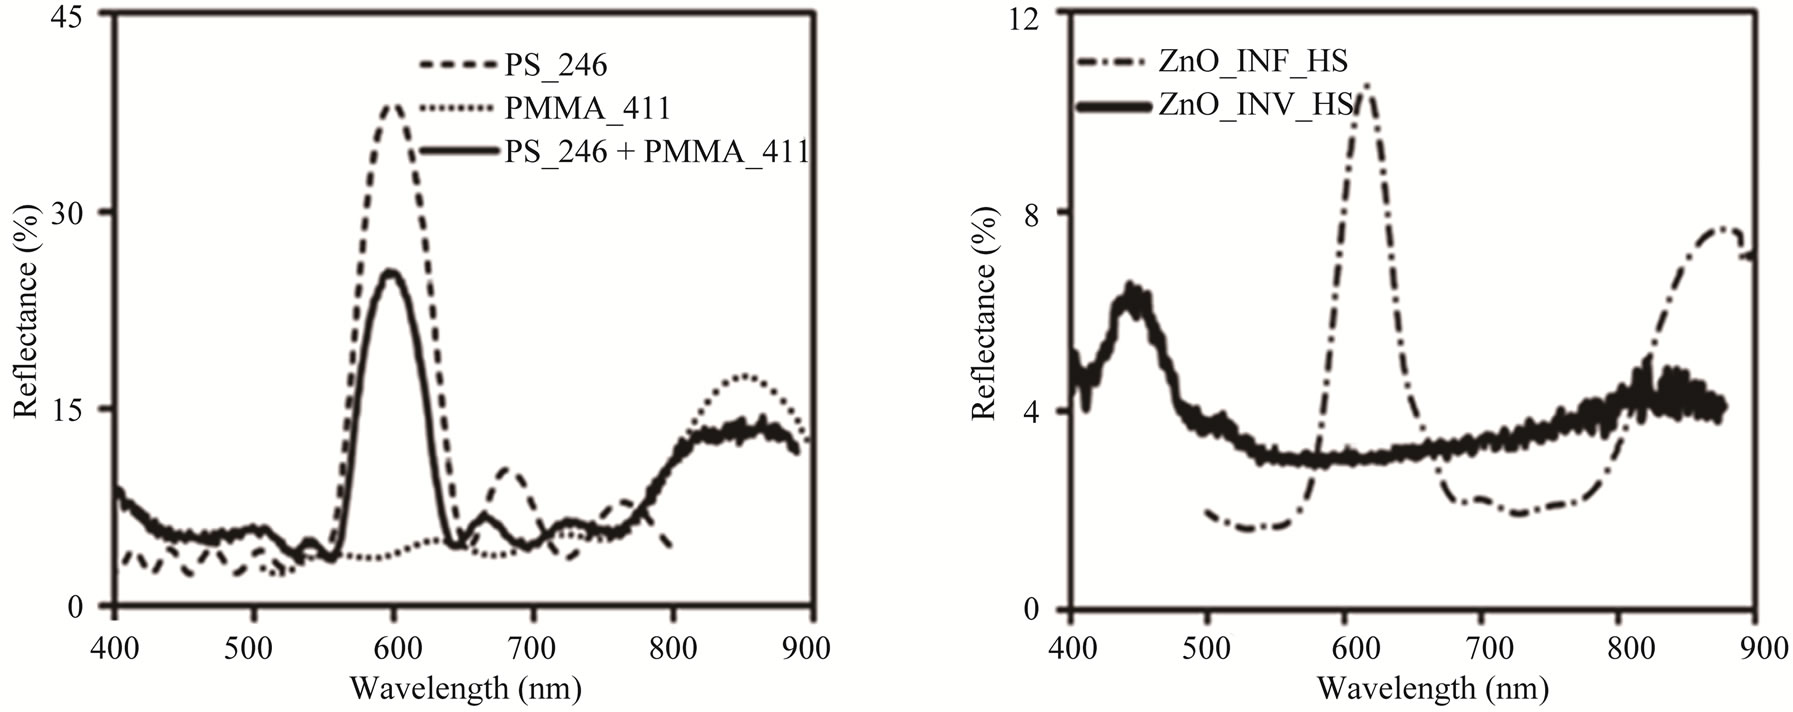 (b)
(b)
Figure 2. Reflection spectra of (1) direct PhC (solid line), ZnO infiltrated PhC (dotted line) and ZnO inverse PhC (dashed line) fabricated from (a) PS 264 nm and (b) PMMA 411 nm. (2) PS 264 nm (dashed line), PMMA 411 nm (dotted line), and B1A2 HS (solid line) shown in (c) and (3) ZnO infiltrated HS (dashed-dotted line) and ZnO inverse HS (thick line) obtained from B1A2 shown in (d) (All at 8˚ incidence angle). INF: infiltrated, INV: inverse.
which is a red shift of 36 nm. The index contrast, which is the difference between the refractive index of the sphere and the background, is decreased from 0.59 to 0.41 after infiltration. The peak reflectance of the infiltrated crystal is significantly lower than the peak reflectance of PS 264 nm PhC. This is because a layer of ZnO is left on the top surface of the PhC after the infiltration which affects the reflectance measurement.
The reflection maximum is shifted to 428 nm, a decrease of 206 nm, when the PS spheres are removed from the structure after inversion (dashed line). In the case of inverse PhC, the refractive index contrast increases to 1.00 but neff decreases to 1.33 because of the lower filling fraction of higher index material (ZnO) in the structure. Similar shifts are observed in the case of PMMA 411 nm PhC (Figure 2(b)). For this case, neff of PMMA PhC increases from 1.37 to 1.63 after infiltration and reduces to 1.33 after inversion, resulting in the stop band peak at 851 nm, 887 nm and 746 nm for direct (solid line), infiltrated (dotted line) and inverse (dashed line) PhCs, respectively.
Subsequent to the single PhC, the reflection spectra of the HS are recorded to obtain their two different stop bands and to understand the extent of ordering present in the two constituent structures. The thin solid line in Figure 2(c) is the reflection spectrum of B1A2 for 8˚ incidence angle. Two well-resolved stop bands with peaks at 598 nm and 851 nm are observed. The two bands arise because the Bragg planes of the individual PhCs made of PS and the PMMA respond to two different ranges of electromagnetic waves. The lattice constants of lower and upper layers are 373 nm and 581 nm respectively, and neff is 1.46 and 1.37 for PS and PMMA PhC respectively. The peak positions of both these stop bands match with the wavelength of the peaks in the stop bands of individual PS 264 nm and PMMA 411 nm PhCs, as shown in the figure with dashed and dotted lines, respectively.
When the HS is infiltrated with ZnO, the reflection peaks (Figure 2(d), dashed-dotted line) shift towards larger wavelengths to 617 nm and 875 nm. The peaks have shifted by 19 nm for PS and 24 nm for PMMA after infiltration. The slight difference in the shifting range may be due to the smaller size of the voids in the case of PS 264 nm PhC as compared to PMMA 411 nm PhC, allowing lesser volume of infiltration of ZnO in the former and the interface between the two PhCs leading to incomplete infiltration in the lower layer PhC. However, the second reason is unlikely in view of the results on the inverse HS that follow. The infiltrated HS is inverted by chemical method and the photonic stop bands shift to lower wavelength region with peaks at 449 nm and 838 nm, shown with thick solid line in Figure 2(d). The inverse HS has a single neff of 1.33 throughout the thickness. But the lattice constant of the top layers (579 nm) is different from the lattice constant of the lower layers (372 nm) resulting in two stop bands.
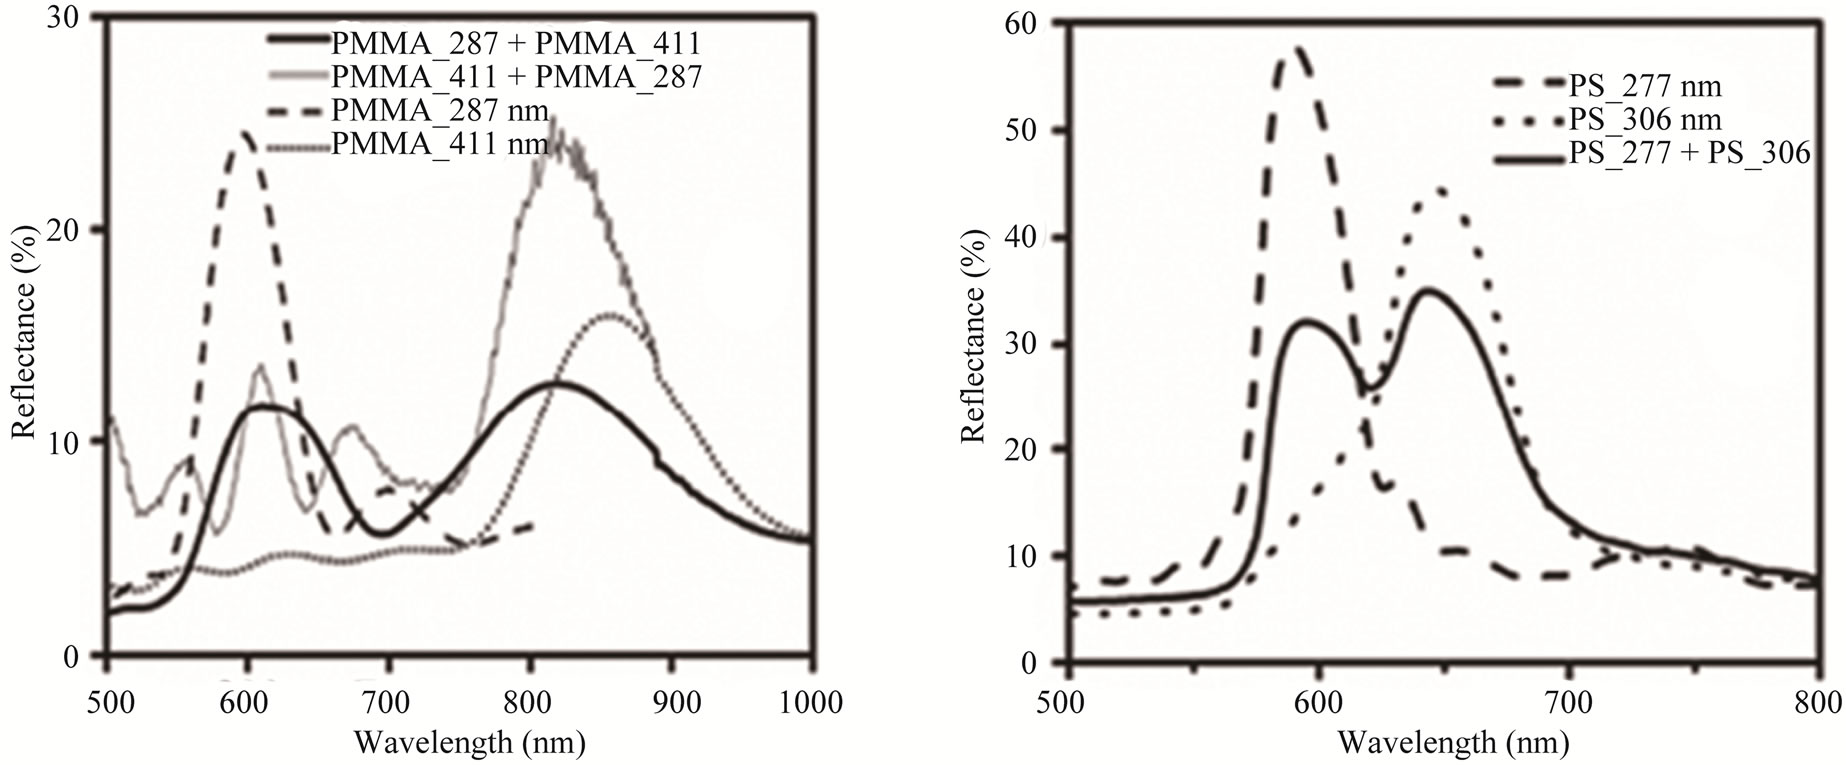
In order to understand the versatility of fabrication of HS by this method, other combinations of materials/colloidal diameters are also discussed. While the results on direct HS are presented below in view of their larger absolute reflectance values, they can be inverted by the same techniques discussed above. In Figure 3, the reflection spectrum of direct HS is shown with a solid line while that of individual PhC is shown with dashed or dotted lines. In Figure 3(a), the reflectance spectrum of A1A2 HS is shown with a thick line. Here, the PhC containing larger colloids (411 nm) is grown on the PhC with smaller colloids (287 nm). The lattice constant of the lower and upper layers are 404 nm and 579 nm respectively. Two stop bands are observed for this HS at 611 nm and 819 nm with the reflectance from both the layers being nearly equal. The thin line in the figure is the reflection spectrum of HS when the crystal is grown in the reverse order, namely A2A1. While the stop bands of the two types of HS match with each other as well as with that of the individual PhCs fairly well in terms of the stop band wavelength, the peak reflectance from PMMA 287 is significantly lower in comparison to the peak reflectance from PMMA 411 in A2A1. The full width at half maximum (FWHM) of the reflection spectrum associated with PMMA 287 and PMMA 411 in A1A2 are 82 nm and 133 nm, respectively. On the other hand, the FWHM in the case of A2A1 are 29 nm and 97 nm corresponding to PMMA 287 and PMMA 411, respectively. The significance of these values is discussed later.
The peak reflectance of the two stop bands in B2B3 HS is nearly equal in Figure 3(b). A broader reflection band with two peaks due to the two stop bands is obtained in this case. The two peaks are at 595 nm and 643 nm which correspond to PS 277 and PS 306, respectively. For this HS, the material used in both the layers is the same and their diameters are also comparable. As a result, one may notice that the peak reflectance value is relatively large in this case. The reflection spectra measured for the individual PS PhCs with sphere diameter of 277 nm and 306 nm are shown in the figure with dashed and dotted lines, respectively. Liu et al. reported fabrication of binary PhC HS by modified self-assembly method [16]. In that work, PS particles with three different diameters were used to fabricate the HS and the reflectance corresponding to top layer was less compared to bottom layer when larger particles were grown on smaller particles. In the present work, the reflectance of both the layers are found to be nearly equal (thick solid line in Figures 3(a) and (b)) when larger particles are deposited on smaller particles.
 (a)
(a)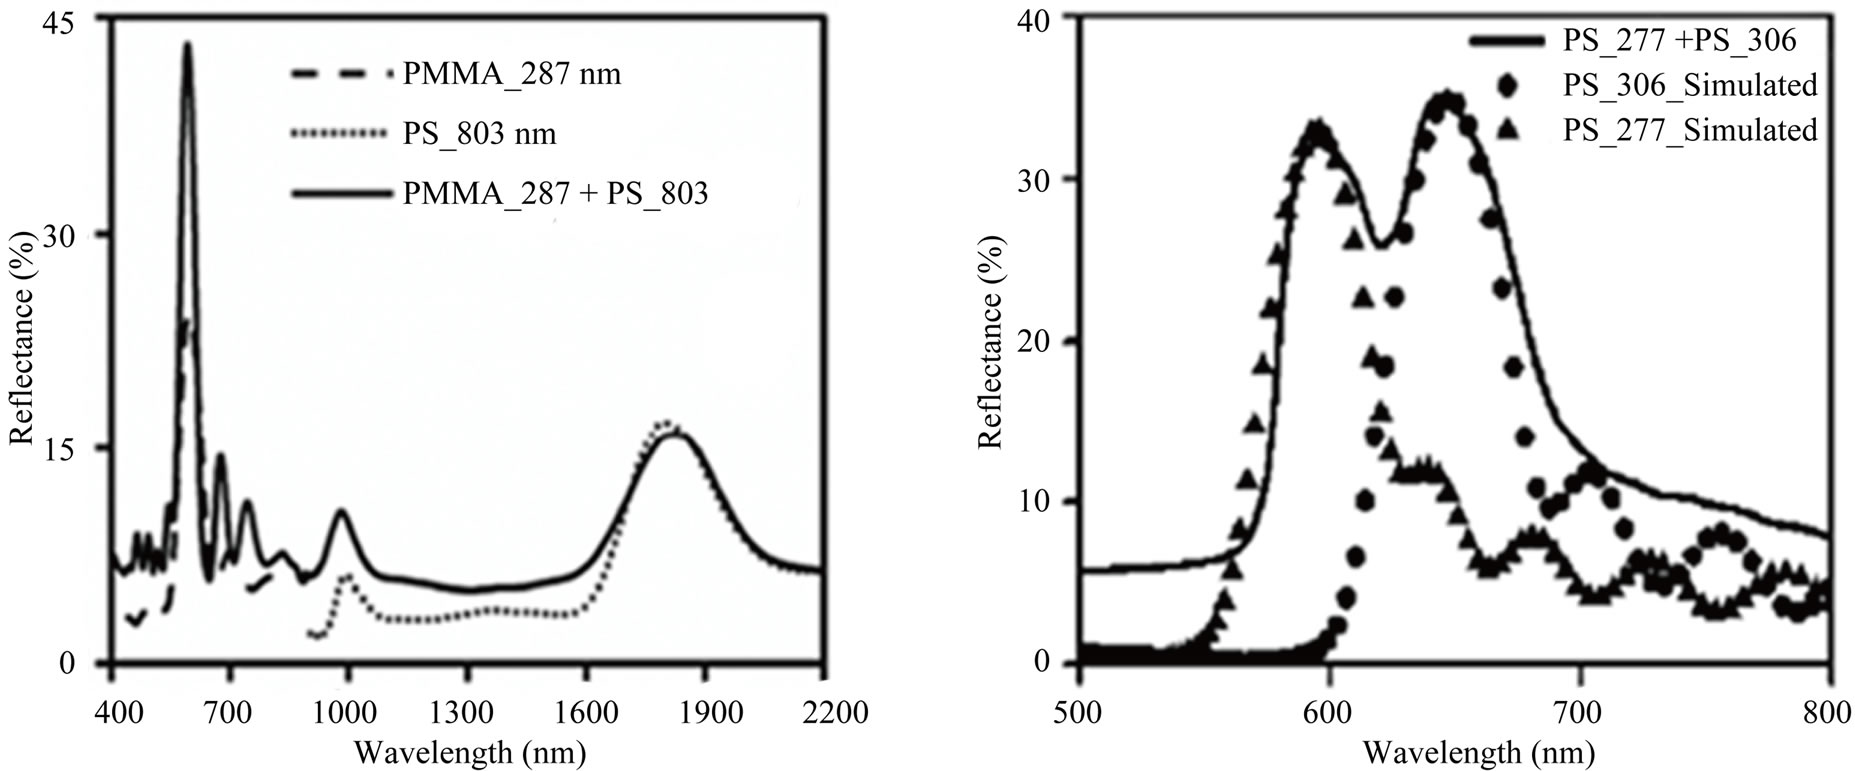 (b)
(b)
Figure 3. Measured reflection spectra of (a) A1A2 HS (thick line), A2A1 HS (thin line), PMMA 287 nm (dashed line) and PMMA 411 nm (dotted line); (b) B2B3 HS (solid line), PS 277 nm (dashed line) and PS 306 nm (dotted line); (c) A1B4 HS (solid line), PMMA 287 nm (dashed line) and PS 803 nm (dotted line); and (d) Measured reflectance spectrum (solid line) of B2B3 HS shown along with the calculated reflectance spectrum of the constituent PhCs (symbols). (All the measurements are done at 8˚ incidence angle).
Figure 3(c) is the reflection spectrum of HS made of two different materials, namely PMMA 287 nm and PS 803 nm, termed as A1B4. The lattice constant of the lower layer (404 nm) is very less as compared to the upper layer (1132 nm). The growth of HS is possible in spite of such a large lattice mismatch. As expected, two peaks are observed in the reflection spectrum of the PhC HS at 591 nm and at 1824 nm, with one stop band in the visible range and the other in the near-IR range. The reflection spectrum of the individual PMMA PhC with sphere diameter of 287 nm and PS PhC with sphere diameter of 803 nm are shown in the figure with dashed and dotted lines, respectively.
Amongst the several insights that these results provide, there are three issues to be analyzed. One is to do with the reduction of peak reflectance of light emerging from the lower layer due to scattering losses at a mismatched interface. The second is the extent of growth (number of layers as well as the ordering within the layers) possible for the upper layer, in the two cases of larger colloids on the top as against smaller colloids on the top. The third is to do with the growth of two different materials (with equal or disparate diameters) over each other as against the growth of the same material with two different diameters.
Peak reflectance from both the constituent PhCs in the case of HS is reduced as compared to individual crystals in Figure 3, in spite of similar growth conditions such as the volume and concentration of the colloidal solution. Light scattering losses at the mismatched lattice interface between the two PhCs in the HS can explain the lowering in peak reflectance for the lower PhC but not the upper PhC. A lowering of peak reflectance from the upper PhC is possible only if the number of well-ordered layers is lesser than the expected number. From the result in Figure 3(c), it is clear that the peak reflectance due to the lower-lying PMMA 287 remains large (and unaffected) when the lattice mismatch is significantly large with the upper layer being PS 803.
The FWHM of the reflectance band is directly proportional to the index contrast and the extent of disorder, and inversely proportional to the number of layers. Since the two constituents are of the same material in Figure 3(a), the larger FWHM in A1A2 can be attributed to fewer layers and/or more disorder. When the upper and lower PhCs are both made of PS (colloids of comparable diameters) as shown in Figure 3(b), larger and nearly equal peak reflectance is obtained for the two stop bands. The value of peak reflectance is directly proportional to the number of ordered layers and inversely proportional to the extent of disorder.
PS PhC grows better on another PS PhC as seen in Figure 3(b) but this does not apply to two PMMA PhCs grown over each other (Figure 3(a)) and PS grown on PMMA (Figure 3(c)). Liu et al. reported that the optical property of HS formed by depositing bigger particles on smaller ones was found to be superior to the HS grown in the reverse order [8]. To analyze if this is supported in the present study, one may consider the cases shown in Figures 3(a) and (b). PMMA 287 has a peak reflectance of more than 40% when grown as the lower PhC in Figure 3(c), but gives only 12% as peak reflectance when grown as the lower PhC in Figure 3(a). While the second result could be due to larger interface losses, it cannot be confirmed and the ease of growth of larger colloids on smaller ones cannot be established conclusively.
It is possible to calculate the reflectance spectra of the two constituents of the HS by choosing an appropriate number of layers and including the effect of extinction coefficient in the refractive index to account for the interface losses [17,18]. The experimentally measured reflectance spectra of the individual PhCs are shown in Figure 3(b) as dashed and dotted lines, while the calculated reflectance spectra of the individual PhCs that match the composite HS are shown in Figure 3(d). The calculated reflection spectra of independent PhCs (not shown here) that match the spectra in Figure 3(b) gave the number of layers and extinction as 20 and 0.06 for PS 277, and 16 and 0.06 for PS 306. These are the lower and upper PhCs respectively in the composite HS. The number of layers and extinction for these two PhCs in the composite structure required to obtain the solid line in Figure 3(d) are 20 and 0.13 for the PS 277 (shown by triangles), and 16 and 0.12 for the PS 306 (shown by circles) respectively. This indicates that the extinction is distinctly increased for both the PhCs in the composite HS while the number of layers that grow in a well-ordered manner is not affected.
Lastly, it may be noted that during the process of inversion by the wet-chemical method, any crystalline region of the original polymeric structure that has not been infiltrated by ZnO will get washed out by toluene. Since the adhesion of the crystalline structure to the substrate is through the lower layers, infiltration of ZnO into the lower layers is essential to retain a structured crystal after inversion. Even though the infiltration was carried out after growing the complete structure in the present work, its success is proven through the optical studies on the inverted HS and the wavelength range of the dual stop bands. From the present work on HS that contain two PhCs made of two different polymer colloids, one may state that ordered heterstructures are possible in spite of material mismatch and lattice mismatch. Berdosova et al. fabricated the HS using SiO2 and PS colloids, where the diameter of the SiO2 colloids was just double the diameter of PS colloids [19]. In the present work, the relative size of the colloidal spheres used for the fabrication of upper layer in the HS is even larger.
The variants obtained by growing HS with the help of PhCs have the ultimate goal of simpler applications. In this connection, one may refer to [9,10] for two novel and simple devices. The ease of fabrication of the direct and inverse HS discussed in the earlier sections establish the possibility of obtaining such devices in combination with the advantages of HS, such as short times of fabrication and versatility of using different materials and/or lattice constants. More importantly, these inverse HS can serve as lab-on-a-chip templates, since the porous structure can be infiltrated with a variety of materials (especially those that cannot be processed in colloidal form) in a sequential manner for further studies on multiwave-length sensing.
4. Conclusion
The fabrication and characterization of 3-D HS with multiple combinations of polymeric colloidal particles is demonstrated with all the processes carried out at room temperature. The stop band wavelengths of the HS match exactly with the peak positions of individual PhCs. Particles with very large sphere diameter (almost three times) could also be grown successfully on the surface of PhC having smaller particles. The extent of disorder resulting due to stacking of colloids of unequal size in a HS arrangement is estimated by calculating the reflectance spectrum using an extinction coefficient for the medium. The five types of HS discussed here bring out the success of the method in a variety of combinations through a comprehensive approach. The results indicate the freedom of choice of various polymeric colloids of any diameter to form HS. Multiple stacking of different PhC layers with appropriate stop band positions followed by inversion can result in an interesting single-solid PhC with multiple lattice constants suitable for specialized applications with a variety of materials (that can not be processed in colloidal form) by in-filling them in the skeletal structure, to understand their properties in a photonic crystalline environment. Thus, these low-cost crystalline structures made by room-temperature techniques within a few hours can serve as lab-on-a-chip templates for sensing applications.
5. Acknowledgements
SK acknowledges financial support from the Board of Research in Nuclear Sciences. The authors acknowledge the SEM facilities at CEN and SAIF of IIT Bombay, and Prof. S. S. Major from the Department of Physics, IIT Bombay for the use of the Spectrophotometer.
REFERENCES
- S. H. Kim, S. H. Kim, W. C. Jeong and S. M. Yang, “Low-Threshold Lasing in 3D Dye-Doped Photonic Crystals Derived from Colloidal Self-Assemblies,” Chemical Materials, Vol. 21, No. 20, 2009, pp. 4993-4999. doi:10.1021/cm9026144
- A. Di Falco, L. O’Faolain and T. F. Krauss, “Chemical Sensing in Slotted Photonic Crystal Heterostructure Cavities,” Applied Physics Letters, Vol. 94, No. 6, 2009, Article ID: 063503. doi:10.1063/1.3079671
- B.-S. Song, T. Asano, Y. Akahane, Y. Tanaka and S. Noda, “Multichannel Add/Drop Filter Based on In-Plane Hetero Photonic Crystals,” Journal of Lightwave Technology, Vol. 23, No. 3, 2005, pp. 1449-1455. doi:10.1109/JLT.2004.841458
- E. Schonbrun, Q. Wu, W. Park, T. Yamashita and C. J. Summers, “Polarization Beam Splitter Based on a Photonic Crystal Heterostruture,” Optics Letters, Vol. 31, No. 21, 2006, pp. 3104-3106. doi:10.1364/OL.31.003104
- B. S. Song, S. Noda, T. Asano and Y. Akahane, “UltraHigh-Q Photonic Double-Heterostrucure Nanocavity,” Nature Materials, Vol. 4, No. 3, 2005, pp. 207-210. doi:10.1038/nmat1320
- R. Rengarajan, P. Jiang, D. C. Larrabee, V. L. Colvin and D. M. Mittleman, “Colloidal Photonic Superlattices,” Physical Review B, Vol. 64, No. 20, 2001, Article ID: 205103. doi:10.1103/PhysRevB.64.205103
- K. Wostyn, Y. Zhao, G. de Schaetzen, L. Hellemans, N. Matsuda, K. Clays and A. Persoons, “Insertion of a TwoDimensional Cavity into a Self-Assembled Colloidal Crystal,” Langmuir, Vol. 19, No. 10, 2003, pp. 4465-4468. doi:10.1021/la0341916
- G. Q. Liu, Z. S. Wang, Y. B. Liao, H. H. Hu and Y. Chen, “High-Quality Photonic Crystal Heterostructures Fabricated by a Modified Self-Assembly Method,” Applied Optics, Vol. 48, No. 3, 2009, pp. 2480-2484. doi:10.1364/AO.48.002480
- Q. Yan, X. S. Zhao and Z. Zhou, “Fabrication of Colloidal Crystal Heterostructure Using a Horizontal Deposition Method,” Journal of Crystal Growth, Vol. 288, No. 1, 2006, pp. 205-208. doi:10.1016/j.jcrysgro.2005.12.028
- S.-H. Kim, H. S. Park, J. H. Choi, J. W. Shim and S.-M. Yang, “Photonic Crystals: Integration of Colloidal Photonic Crystals towards Miniaturized Spectrometers,” Advanced Materials, Vol. 22, No. 9, 2010, pp. 946-950. doi:10.1002/adma.200902456
- Q. Yan, Z. Zhou and X. S. Zhao, “Inward-Growing SelfAssembly of Colloidal Crystal Films on Horizontal Substrates,” Langmuir, Vol. 21, No. 7, 2005, pp. 3158-3164. doi:10.1021/la047337p
- S. Kedia, R. Vijaya, A. K. Ray and S. Sinha, “Photonic Stop Band Effect in ZnO Inverse Photonic Crystal,” Optical Materials, Vol. 33, No. 3, 2011, pp. 466-474. doi:10.1016/j.optmat.2010.10.020
- O. D. Velev and E. W. Kaler, “Structured Porous Materials via Colloidal Crystal Templating: From Inorganic Oxides to Metals,” Advanced Materials, Vol. 12, No. 7, 2000, pp. 531-534. doi:10.1002/(SICI)1521-4095(200004)12:7<531::AID-ADMA531>3.0.CO;2-S
- Z. Zhou and X. S. Zhao, “Opal and Inverse Opal Fabricated with a Flow-Controlled Vertical Deposition Method,” Langmuir, Vol. 21, No. 10, 2005, pp. 4717-4723. doi:10.1021/la046775t
- B. Cheng, P. Ni, C. Jin, Z. Li, D. Zhang, P. Dong and X. Guo, “More Direct Evidence of the fcc Arrangement for Artificial Opal,” Optics Communications, Vol. 170, No. 1-3, 1999, pp. 41-46. doi:10.1016/S0030-4018(99)00434-4
- G. Q. Liu, Y. H. Ji, Y. Y. Nie, Y. Chen and H. H. Hu, “Structural and Optical Quality of Binary Photonic Crystal Heterostructures Fabricated by the Modified SelfAssembly Method,” Journal of Modern Optics, Vol. 56, No. 15, 2009, pp. 1643-1648. doi:10.1080/09500340903267827
- N. Stefanou, V. Yannopapas and A. Modinos, “Heterostructures of Photonic Crystals: Frequency Bands and Trans-Mission Coefficient,” Computer Physics Communication, Vol. 113, No. 1, 1998, pp. 49-77. doi:10.1016/S0010-4655(98)00060-5
- N. Stefanou, V. Yannopapas and A. Modinos, “MULTEM 2: A New Version of the Program for Transmission and Band-Structure Calculations of Photonic Crystals,” Computer Physics Communication, Vol. 132, No. 1-2, 2000, pp. 189-196. doi:10.1016/S0010-4655(00)00131-4
NOTES
*Corresponding author.