Stem Cell Discovery
Vol.3 No.1(2013), Article ID:26951,9 pages DOI:10.4236/scd.2013.31008
Senescence and longevity in amniotic fluid derived cells
![]()
1Department of Obstetrics & Gynecology, New York University, New York, USA; *Corresponding Author: bruce.young@nyumc.org
2Department of Pathology, New York University, New York, USA
3Department of Animal Medicine, Foshan University, Foshan, China
Received 26 September 2012; revised 27 October 2012; accepted 29 November 2012
Keywords: Amniotic Fluid; Stem Cells; Senescence; Longevity; Telomeres; Genes
ABSTRACT
Amniotic fluid stem cells (AFSC) are noncontroversial and abundant potentially transplantable cells. They are derived from fetal and amniotic sources and show osteogenic, neuronal, and adipogenic differentiation in culture. Clinical material must be expanded in culture and sorted if clinical use is desired. Cellular senescence and replicative potential for AFSC cultures has had limited study, with scant data on gene expression over time. We report changes in samples from 17 patients over multiple passages form 10 to 81 population doublings. Longevity was unrelated to telomere length in these cells. It was related to upregulation of TWIST1, which is highly expressed in stem cells, and downregulation of genes associated with apoptosis.
1. INTRODUCTION
Amniotic fluid stem cells (AFSC) are of particular interest in regenerative medicine as a noncontroversial and potentially “abundant” source of stem cells. Amniotic fluid (AF) contains a heterogeneous population of undifferentiated and differentiated cells that were classified in three major groups on the basis of morphological, biochemical and growth characteristics: epithelioid, amniotic and fibroblastic cells. These cells are derived from the amniotic epithelium and from developing fetal tissue. These cells express OCT4 mRNA, are positive for mesenchymal markers such as CD90, CD105 (SH2), CD73 (SH3/4), CD166 but are negative for hematopoietic markers such as CD45, CD34, CD14. They have osteogenic, adipogenic, and neuronal differentiation potential. These data suggest that human AF contains a stem cell population that may belong to an intermediate stage of development between embryonic stem cells and lineage-restricted adult progenitor cells [1]. Thus there may be a potential clinical use of AFSC for transplantation in humans.
Cellular senescence has been observed in many adult stem cells isolated from several tissues including bone marrow, brain, fat, skin and skeletal muscle. Cellular senescence denotes a cellular response to their environment that results in irreversible growth arrest, alterations of the gene expression profile, epigenetic modifications, and an altered secretome, all of which eventually impair the reparative properties of primitive cells, adding a layer of complexity to the field of regenerative medicine [2]. The regulation of stem cell senescence has potential importance in different therapeutic strategies: one is cell therapy; the other is inhibition of expansion of the cancer stem cell population. For cell therapies such as cell transplantation in regenerative medicine, stem cell senescence must be prevented in order to acquire enough cells to achieve transplantation in sufficient number for subsequent differentiation into specialized cell types. Conversely, for cancer therapy, stem cell senescence must be induced to prevent the proliferation and differentiation of transformed cancer stem cells [3,4] .
Telomere shortening is believed to be the major cause of senescence in human fibroblasts, whereas mouse fibroblasts undergo senescence that is independent of telomere shortening and probably mediated by oxidative stress. Diverse senescence-inducing stimuli can trigger the senescence response through multiple genetic pathways. However, these pathways seem to converge on p53 and pRb, and inactivation of both the p53 and pRb pathways is often required to prevent the activation of sensecence. As a cyclin-dependent kinase inhibitor, up-regulation of p21 in senescent cells leads to inhibition of pRb phosphorylation, which controls cell cycle progression. In parallel to p21, p16INK4a (p16) is another cyclindependent kinase inhibitor that leads to pRb hypophosphorylation [2,5,6] , preventing senescence.
There is limited data regarding the effect of multiple passage and cellular senescence of stem cell lines on gene expression changes in amniotic fluid derived cells. We sought to investigate differences in gene expression between longevity and senescence in cultured amniotic fluid (AF) derived cells. We studied AF cells in culture using microarray technology and a cellular senescence PCR Array to evaluate changes in gene expression over the time interval between obtaining mid-trimester amniotic fluid samples and clonal replication of multipotent cell populations for up to 81 passages, in 17 different patients.
2. MATERIALS AND METHODS
2.1. Cell Isolation and Culture
AF samples were obtained from 17 patients undergoing amniocentesis for routine prenatal diagnosis at 15 - 22 weeks of pregnancy approved by the New York University School of Medicine Institutional Review Board. Fresh amniotic fluid (4 - 6 ml) samples were centrifuged at 300 g (4˚C) for 5 minutes to harvest cells and cultured in a-MEM medium (Gibco, Invitrogen) containing 15% ES-FBS, 1% glutamine and 1% penicillin/streptomycin (Gibco), supplemented with 18% Chang B and 2% Chang C (Irvine Scientific). Cells from the same patient were also used, after they had been maintained in culture for 2 - 3 weeks in the cytogenetics lab in 11 patients. The cell culture were incubated under 5% CO2 at 37˚C and sub-cultured at 70% - 80% confluence.
2.2. Magnetic Bead (Invitrogen) Cell Sort
At passage 2 or 3, after assessing that an adequate number of cells were available, amniotic fluid cells were sorted using magnetic bead technique to obtain a CD117 + AFSC initial isolate. These CD117 positive cells were divided into 2 parts: one half was used to isolate the mRNA noted as early samples, the other was maintained in culture and subcultured for 4 - 5 passages. At that time, these cells were sorted again and a high concentration of CD117 positive cells was obtained and noted as late samples.
2.3. RNA Isolation and cDNA Synthesis
Total RNA was extracted using the RNeasy Plus Mini Kit (Qiagen, #74134) according to the manufacturer’s instructions. After DNase digestion, RNA samples were quantified, aliquoted and stored at –80˚C until use. For quality control, RNA purity and integrity were evaluated by denaturing gel electrophoresis, OD 260/280 ratio, and analysis on an Agilent 2100 Bioanalyzer (Agilent Technologies, Palo Alto, CA). Total RNA was amplified and purified using the standard Affymetrix 3’IVT express Kit to yield biotin-labeled cDNA according to the manufacturer’s instructions.
2.4. Microarray Analysis
The NYU Genome Technology Center was utilized for both microarray and Q-PCR technologies (Affymetrix and ABI 7900 HT SDS, respectively). The labeled cDNA hybridization to the Affymetrix U133 2.0 arrays, array fluidics processing and scanning were performed under standardized conditions as recommended by Affymetrix. Analysis of the microarray expression profile was performed using Genespring Multiomics software suite under the NYU institutional license in consultation with NYU Center for Health Informatics and Bioinformatics.
2.5. Cellular Senescence PCR Array
Cellular senescence PCR Array plates (Qiagen, PHAS- 050) were used to assay the 84 genes related to cellular senescence expression. Following the manual we purified RNA from each sample using the RNeasy Plus Mini Kit (Qiagen 74134), prepared cDNA from purified RNA using RT2 Strand Kit (Qiagen 330401) and added cDNA to RT2 SYBR Green Mastermix (Qiagen330513), aliquoting the mix into RT2 Profile PCR Arrays plates. PCR for each plate consisted of the following sequence: 95˚C, 10 sec for initial denaturation, and 40 cycles of 95˚C for 10 sec and 60˚C for 45 sec. To determine primer specificity, three stages (95˚C for 15 s, 60˚C for 20 s, and 95˚C for 15 s, with a ramping time of 20 min) were added at the end of the PCR to obtain melt curves for each gene. All realtime PCR reactions were performed using a Bio-Rad iCycler optical module system. Analysis data were obtained by PCR Array analysis software provided by SABioscience. The housekeeping genes used in PCR array were average of 5 genes including ACTB, B2M, GAPDH, HPRT1 and RPLP according to SABioscience guide.
2.6. Telomere Measurement by Quantitative Real-Time PCR
Genomic DNA of cells was prepared using DNeasy Blood & Tissue Kit (Qiagen, Valencia, CA, USA). Average telomere length was measured from total genomic DNA using a real-time PCR assay, as described [7] . PCR reactions were performed on the iCycler iQ real-time PCR detection system (Bio-Rad, Hercules, CA, USA), using telomeric primers, and primers for the reference control gene (human 36B4 single copy gene). For each PCR reaction, a standard curve was made by serial dilutions of known amounts of DNA. The telomere signal was normalized to the signal from the single copy gene to generate a T/S ratio indicative of relative telomere length. Equal amounts of DNA (35 ng) were used for each reaction, with at least three replicates for each specimen.
2.7. Data Mining Analysis
Genespring Muti-omics Software Suite was used for microarray analysis and processed to normalized intensive values for comparison of early and late passages. Principal component analysis was done with 3 components for comparison of early and late passages of expression of senescence genes. Data mining analysis using the NIH DAVID base was performed in the 1685 gene probes of interest using functional annotation analysis. Calculation of p-values from a large dataset with a low 1.33 fold threshold increases the chance of random false discovery. Therefore Benhamini-Hochberg multiple comparison testing was used to eliminate false discovery. It is used extensively for microarray analysis. Where applicable, student t-test was employed.
3. RESULTS
3.1. Life Span of AF Derived Cells
Sixteen samples from 15 patients at 15 - 22 weeks were assayed for population doubling (Table 1). In early (1 - 4) passage of fresh samples and (1 - 3) passage of cytogenetics samples, the generation doubling time could be determined as 30 to 40 hours, but in the late passages the doubling time would prolong gradually. Every sample could be passaged more than 6 times and yield more than 10 doublings. The range of population doublings was from 10 to 81, the average doubling of AF cells was 24. However one sample from a 15 week patient had 81 population doublings and was maintained in culture for 150 days. By the late passage these cells stopped proliferating at which time their morphology was flat and large, which is one of the characteristics of cellular senescence observed after at least 10 passages. This is distinct from the morphology of the early passage human AF derived cells.
3.2. Shift of Gene Expression Profile of CD117 Positive Stem Cells Sorted from AF Cells after in Culture
To identify gene expression shift in culture, we performed microarray chip assays using AF derived cells sorted by CD117 conjugated microbeads at early passage and late passage from 5 different patients. Differentially expressed genes were grouped according to their expression profiles. Of the 54675 genes on the chip, at fold change threshold of 1.33 fold and p value of <0.05, a total of 1685 gene probes showed differential expression from early to late passage. This represents 3.08% of the
Table 1. Life span of human amniotic stem cells.
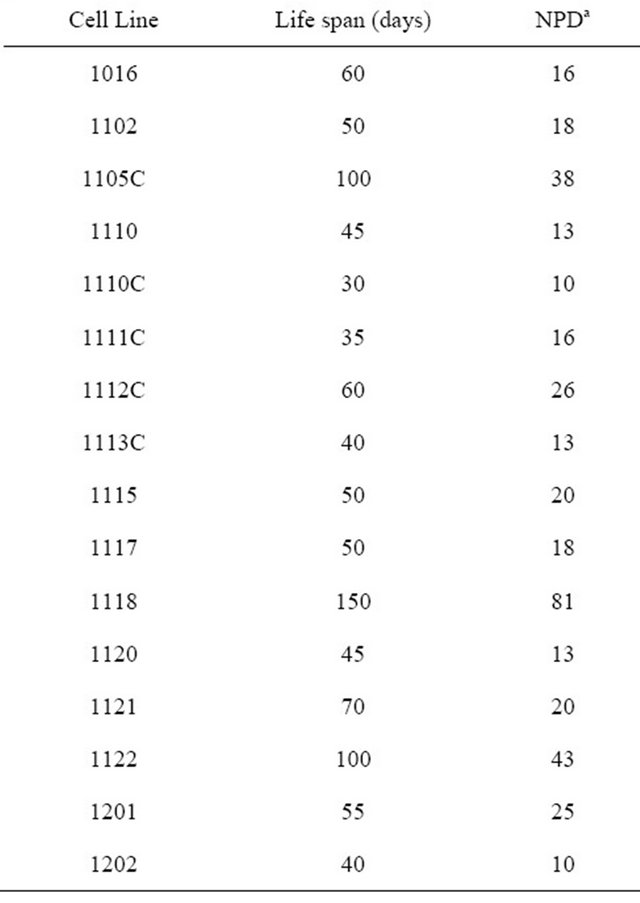
aNPD = Number of Population Doublings.
total gene probes showing statistically significant change from early to late passage. The 1.33 fold threshold was chosen to maximize detection of small changes in gene expression which might be missed at the usual 2 fold level. Using more than one appropriate statistical analysis was relied on to correct for potential false positives.
Functional annotation analysis of 1685 genes of interest revealed that most of the genes belonged to several biological processes (Table 2). The genes with molecular function in binding, cellular organization, and catalytic activity were the most differentially expressed.
3.3. Expression Patterns of Senescence Related Genes between Early and Late Passage Assayed by Microarray
To investigate senescence of AF derived cells, the differentially expressed genes were compared with gene set known to influence cellular senescence. Expression was analyzed before the cells became obviously senescent in an attempt to identify the markers that would be useful as predictors of the onset of senescence. Out of 1685 investigated, only 8 known to influence cellular senescence were differentially expressed genes (Table 3). This represents 0.47% of differentially expressed genes and 0.02% of all genes investigated in the study. Of the 8 differen-
Table 2. Gene annotation summary of differentially expressed genes in AFSC culture.
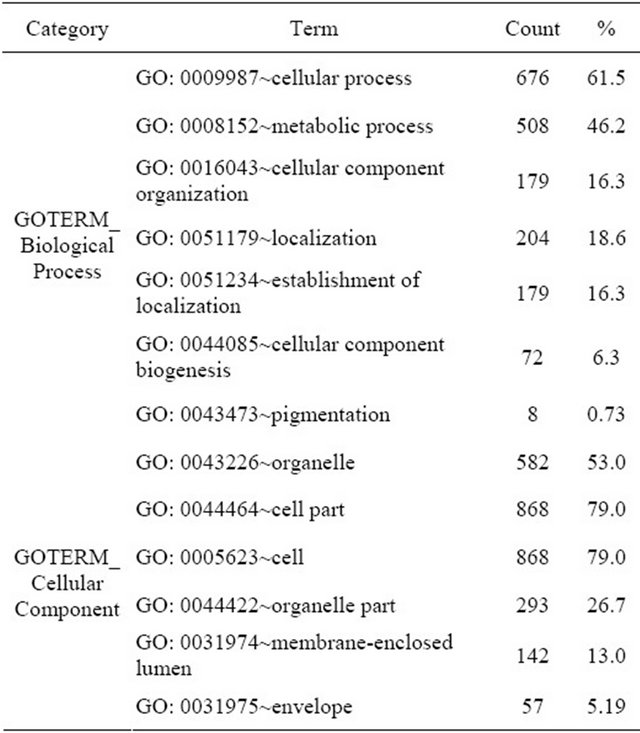
Table 3. Differentially expressed senescence related genes in AFSC during in-vitro culture.
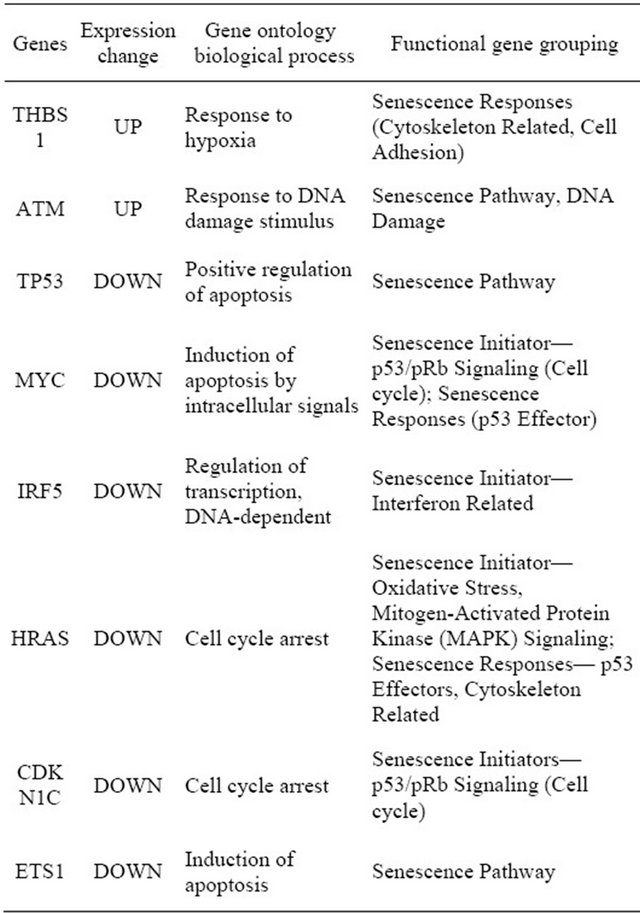
tially expressed genes, only THBS1 and ATM genes were up-regulated, while the majority of the differentially regulated genes were down-regulated in early passage compare to late passage. The results suggest effective down regulation of apoptotic genes in the early cells, which would be consistent with their potential for longevity and regeneration. It is important to note that the majority of senescence related genes did not show a statistically significant change from passage 2 - 3 to passage 4 - 5.
3.4. Expression Patterns of Cellular Senescence Related Genes during the Process of Senescence Measured by PCR Array
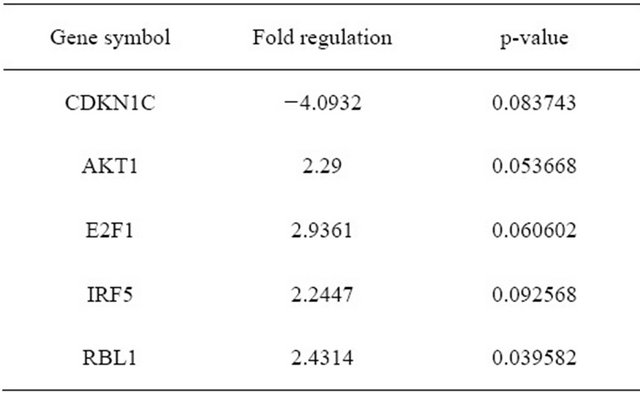
In 5 patients, 84 genes whose expression is known to be related to cellular senescence were measured between cultures early (P1-3) and onset of senescence (P11-29) as shown by the change in morphology as well as prolongation of doubling time and/or arrest of growth. Both early and senescent cultures express the telomerase gene at a level below detection in the Cellular Senescence PCR Array. Early passage cells (n = 5) had higher expression of AKT1, E2F1, IRF5 and RBL1 compared to senescent cells, and less expression in CDKN1C if the P value was set at <0.1 (Figure 1 and Table 4). There is significantly higher expression in early passage for AKT1 and RBL1 at P ≤ 0.05. Both of them belong to the senescence initiators in p53/pRB signaling pathway.
3.5. Differential Expression of Cellular Senescence Related Genes in Longevity Cells Compare to Short Lifespan Cells
One cell line (11 - 18), with 81 doublings over 150 days, was established by AF derived cells. These cells revealed homogenous small spindle-shape morphology and clone formation. They continued growing and not in islands or in cell groups, as found in the other AF cell lines. The 11 - 18 cells were maintained with 81 population doublingsTable 4. Gene expression of AF cells at early passage (n = 5) compare to late passage (n = 5).
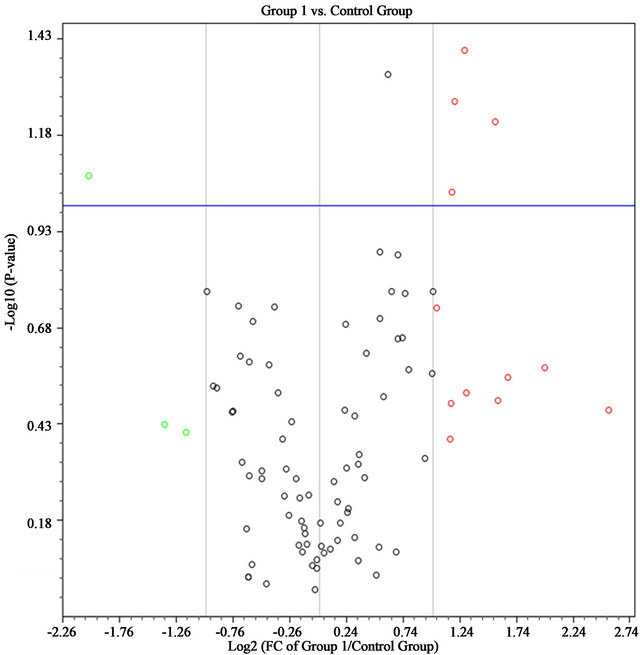
Red dots are the genes whose expression increase more than 2 fold while green dots are decrease more than 2 fold and the dots upward the blue horizontal line are the genes whose p-value < 0.1. Genes whose expression changes and p-values beyond the selected boundaries are listed in the right table. The arrows indicate more than 2 fold change and p < 0.10.
Figure 1. Volcano plot of AF cells at early passage (group 1, n = 5) compare to late passage (control group, n = 5).
far more than the other cell lines whose average doubling was 20.
The longevity cell line 11 - 18 compared with short lived cell lines showed a greater gene expression difference than that seen when senescent and early passage cells were compared for gene expression. 11 - 18 cells had significant up-regulation in 6 genes and down-regulation in 3 genes compared to short lived lines (n = 6) when cellular-senescence related gene expression was tested in early passage (P1-6) cell lines (Figure 2 & Table 5). All the AF cells were compared at early passages (P1-3) to see if longevity as predictable. Significant up-regulated genes include CDC25C (Cell division cycle 25 homolog C S. pombe), CDKN2C (Cyclin-dependent kinase inhibitor 2C, p18, inhibits CDK4), CDKN2C (Cyclin-dependent kinase inhibitor 2D, p19, inhibits CDK4), COL3 A1 (Collagen, type III, alpha 1), TBX2 (T-box 2) and TWIST (Twist homolog 1 Drosophila). Significant downregulated genes include IGFBP7 (Insulin-like growth factor binding protein 7), CREG1 (Cellular repressor of E1A-stimulated genes 1) and IRF3 (Interferon regulatory factor 3).
3.6. Relative Telomere Length Measurement in Longevity and Short-Lived Cells
There was minimal telomerase gene expression when tested by microarray and cellular senescence PCR Array as the signal was not detected. Using relative telomere length assay by T/S Ratio by quantitative PCR, following the method of Cawthon [7] , the results showed that short telomere length was present, consistent with the minimal telomerase mRNA expression by PCR data and by its absence on the microarray data. Longevity cell line 11-18 did not have longer telomere length than the short lived lines and all were shorter than tumor cells (Figure 3). Single cell telomere length measurement also showed 11 - 18 had shorter telomere length than the tumor cell. The other 2 cell lines were in the normal life span rangeTable 5. Gene expression of longevity cell line versus shortlifespan cells.
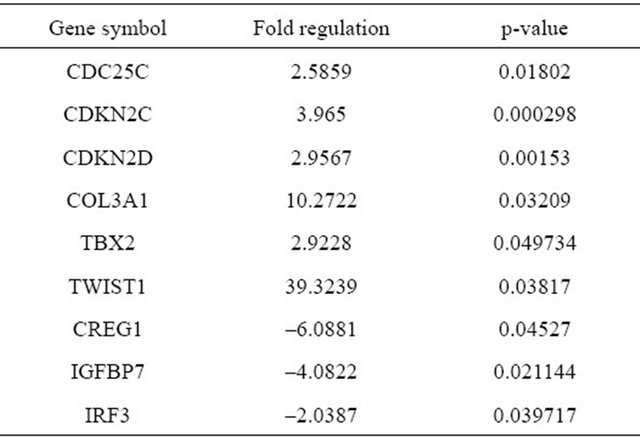
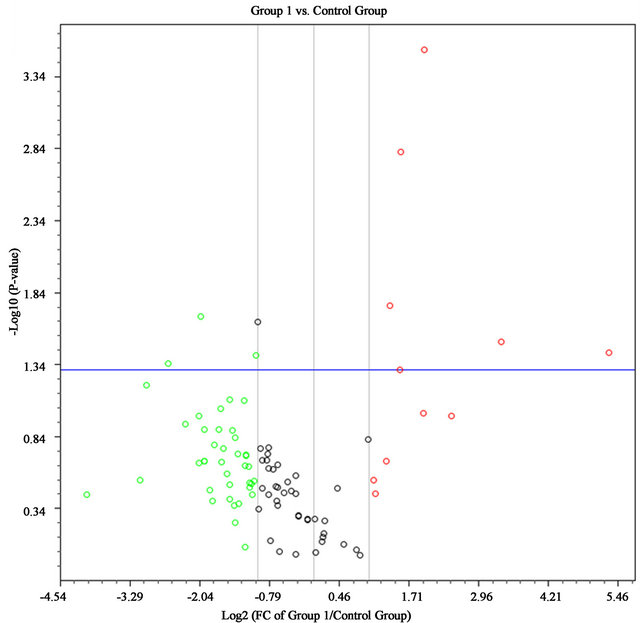
Red dots are the genes whose expression increased more than 2 fold while green dots decreased more than 2 fold. The dots above the blue horizontal line are the genes with p < 0.05. Genes whose fold expression changes and p-values exceeded the boundaries are seen in the table.
Figure 2. Volcano plot of senescence related genes expression in longevity cell line (group1) versus short-lifespan cells (control group).
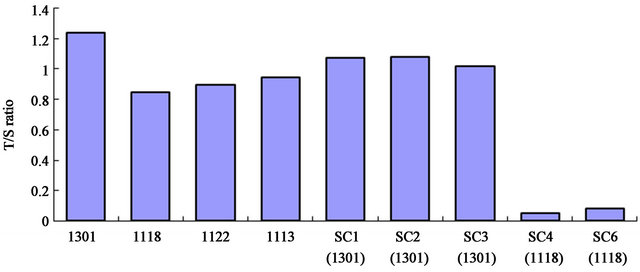
The first four poles obtained from different cell populations, showed no significant difference between long-lived cells 1118 and short-lived cells 1122,1113, but they are all have shorter telomeres than the tumor cell line 1301. SC1-6 are single cell telomere length assays, confirming that 1118 telomeres are significantly shorter than 1301 telomeres.
Figure 3. Telomere length measurement of longevity cell and short lifespan cell.
11 - 22 with 40 doublings, and 11 - 13 with 13.
4. DISCUSSION
AF derived cells show senescence and longevity changes unrelated to telomere length. Therefore AF derived cells are most likely undergoing stress induced premature senescence and not normal replicative senescence in culture.
Senescence is currently considered as a general stress response to various types of stressors and to cellular damage in normal cells. There are thought to be two mechanisms of senescence: stress-induced premature senescence and replicative senescence. Adult stem cells including MSC, HSC and NSC generally are known to have a limited life span. But the mechanism of senescence for these cell lines is poorly understood. Stressinduced premature senescence, unlike replicative senescence, is largely independent of the telomere length or the number of cell divisions [3]. Human mesenchymal stem cells (MSC) have no detectable telomerase activity, and hematopoietic stem cells (HSC) from human and mouse have low levels of telomerase activity [8,9] . It is known that the cell contact induced accelerated senescence of MSCs is telomere shortening and p53 independent [10] . But oxygen stress will decrease the proliferation of MSC and HSC and result in premature senescence [11,12] . AF derived cells also lack telomerase activity as our data shows, and the telomeres are also short as demonstrated by T/S ratio. These results indicated that the amniotic fluid derived cells have a culture lifespan regulated independently from telomere length.
The final outcome of both replicative senescence and stress-induced premature senescence is remarkably similar in that they share common changes in cell cycle regulation and morphological properties. Although gene expression pattern can vary depending on the specific types of tissues and cells or the specific stimuli to trigger the senescence response, senescent cells display a unique pattern of gene expression that differs from proliferating cells or quiescent cells. Gene expression is generally altered during replicative and premature senescence for cell cycle regulatory genes, the expression of DNA damage checkpoint genes, inflammation and stress-associated genes, genes encoding extracellular matrix proteins and extracellular matrix-degrading enzymes, cytoskeletal genes and metabolic genes [13]. Results from microarray and PCR array comparison between early passage and late passage showed consistent data: the majority of down-regulated genes are apoptosis related and those up-regulated are cell cycle related genes in early passages. The same down-regulation of CDKN1C in early passage seen by both microarray and qPCR senescence panel assay indicate that this Cyclin-dependent kinase inhibitor probably is the major regulator of proliferation in cultured amniotic cells. This factor is also found have important function in adult stem cells growth regulation [14-16] .
The 11 - 18 cell line derived from AF has a telomere independent mechanism to extend its lifespan compared to the other AF cell cultures. The 11 - 18 cells have telomere length similar to the short lifespan cell lines, indicating that there is another mechanism to maintain this cell line with a longer lifespan. Depending on cell types, culture conditions, and the extent of stress, inactivation of either p53-p21-pRb or p16-pRb pathway individually, or both pathways together, are thought to be required to prevent senescence [13]. However, in 11 - 18, the longlived cells, these 3 key genes do not have significant changes in expression. Thus, a third mechanism must be acting in cells from 11 - 18 to prevent senescence.
TWIST1 gene up-regulation in PCR Array results may provide a clue to explain the longevity of this cell line. There is increasing evidence that TWIST1, with critical roles in cell growth and survival, is highly expressed in stem cell populations [17] . The senescence of MSC can be abrogated by overexpression of TWIST mediated through direct down-regulation of E2A-p21 by the hypoxiainducible factor-1alpha (HIF-1alpha)-TWIST axis [18, 19] . COL3A1 is highly expressed in 11-18 and is a mesenchymal lineage marker. So, the high expression of TWIST1 in the 11 - 18 longevity cell line probably acts to block premature senescence through this pathway to extend the life span in culture.
IGFBP7 and CREG are down-regulated in the longevity cell line and are part of the insulin like growth factor family of genes. Although insulin/insulin-like growth factor signaling is critical for nutrient homeostasis, growth, and survival, experimental evidence shows that reduced insulin/insulin-like growth factor signaling is able to decrease apoptosis, cell cycle arrest, differentiation, resistance to oxidative stress, and autophagy. In animals this is associated with life extension [3]. IGFBP7 and CREG all belong to this pathway. They promote the proliferation of 11 - 18, and likely are also part of the longevity of these cells. Thus longevity in cultured AF derived cells appears to be regulated more by epigenetic factors such as stress and nutrient homoeostasis than by telomere length.
It is interesting to speculate from our results and the animal studies, that the known improved survival and longevity in lean humans, might be related to similar mechanisms co-existing with the telomere pathway.
5. ACKNOWLEDGEMENTS
The authors thank Dr. Liu Lin for the many challenging discussions and continuous encouragement.
![]()
![]()
REFERENCES
- Dobreva, M.P., Pereira, P.N., Deprest, J. and Zwijsen, A. (2010) On the origin of amniotic stem cells: Of mice and men. The International Journal of Developmental Biology, 54, 761-777. doi:10.1387/ijdb.092935md
- Zhang, J. and Ju, Z. (2010) Telomere, DNA damage, and oxidative stress in stem cell aging. Birth Defects Research. Part C, Embryo Today: Reviews, 90, 297-307.
- Beltrami, A.P., Cesselli, D. and Beltrami, C.A. (2012) Stem cell senescence and regenerative paradigms. Clinical Pharmacology and Therapeutics, 91, 21-29. doi:10.1038/clpt.2011.262
- Liu, L. and Rando, T.A. (2011) Manifestations and mechanisms of stem cell aging. The Journal of Cell Biology, 193, 257-266. doi:10.1083/jcb.201010131
- Allen, N.D. and Baird, D.M. (2009) Telomere length maintenance in stem cell populations. Biochimica et Biophysica Acta, 1792, 324-328. doi:10.1016/j.bbadis.2009.02.004
- Kim, Y.W., Kim, H.J., Bae, S.M., Kim, Y.J., Shin, J.C., Chun, H.J., Rhie, J.W., Kim, J., Kim, H. and Ahn, W.S. (2010) Time-course transcriptional profiling of human amniotic fluid-derived stem cells using microarray. Cancer Research and Treatment: Official Journal of Korean Cancer Association, 42, 82-94.
- Cawthon, R.M. (2002) Telomere measurement by quantitative PCR. Nucleic Acids Research, 30, e47. doi:10.1093/nar/30.10.e47
- Gannon, H.S., Donehower, L.A., Lyle, S. and Jones, S.N. (2011) Mdm2-p53 signaling regulates epidermal stem cell senescence and premature aging phenotypes in mouse skin. Developmental Biology, 353, 1-9. doi:10.1016/j.ydbio.2011.02.007
- Ksiazek, K. (2009) A comprehensive review on mesenchymal stem cell growth and senescence. Rejuvenation Research, 12, 105-116. doi:10.1089/rej.2009.0830
- Ho, J.H., Chen, Y.F., Ma, W.H., Tseng, T.C., Chen, M.H. and Lee, O.K. (2011) Cell contact accelerates replicative senescence of human mesenchymal stem cells independent of telomere shortening and p53 activation: Roles of Ras and oxidative stress. Cell Transplantation, 20, 1209- 1220. doi:10.3727/096368910X546562
- Tsai, C.C., Chen, Y.J., Yew, T.L., Chen, L.L., Wang, J.Y., Chiu, C.H. and Hung, S.C. (2011) Hypoxia inhibits senescence and maintains mesenchymal stem cell properties through down-regulation of E2A-p21 by HIF-TWIST. Blood, 117, 459-469. doi:10.1182/blood-2010-05-287508
- Shao, L., Li, H., Pazhanisamy, S.K., Meng, A., Wang, Y. and Zhou, D. (2011) Reactive oxygen species and hematopoietic stem cell senescence. International Journal of Hematology, 94, 24-32. doi:10.1007/s12185-011-0872-1
- Kong, Y., Cui, H., Ramkumar, C. and Zhang, H. (2011) Regulation of senescence in cancer and aging. Journal of Aging Research, 2011, 963172. doi:10.4061/2011/963172
- Matsumoto, A., Takeishi, S., Kanie, T., Susaki, E., Onoyama, I., Tateishi, Y., Nakayama, K. and Nakayama, K.I. (2011) p57 is required for quiescence and maintenance of adult hematopoietic stem cells. Cell Stem Cell, 9, 262- 271. doi:10.1016/j.stem.2011.06.014
- Zou, P., Yoshihara, H., Hosokawa, K., Tai, I., Shinmyozu, K., Tsukahara, F., Maru, Y., Nakayama, K., Nakayama, K.I. and Suda, T. (2011) p57(Kip2) and p27(Kip1) cooperate to maintain hematopoietic stem cell quiescence through interactions with Hsc70. Cell Stem Cell, 9, 247- 261. doi:10.1016/j.stem.2011.07.003
- Ullah, Z., Kohn, M.J., Yagi, R., Vassilev, L.T. and DePamphilis, M.L. (2008) Differentiation of trophoblast stem cells into giant cells is triggered by p57/Kip2 inhibition of CDK1 activity. Genes & Development, 22, 3024- 3036. doi:10.1101/gad.1718108
- Menicanin, D., Bartold, P.M., Zannettino, A.C. and Gronthos, S. (2010) Identification of a common gene expression signature associated with immature clonal mesenchymal cell populations derived from bone marrow and dental tissues. Stem Cells and Development, 19, 1501- 1510. doi:10.1089/scd.2009.0492
- Isenmann, S., Arthur, A., Zannettino, A.C., Turner, J.L., Shi, S., Glackin, C.A. and Gronthos, S. (2009) TWIST family of basic helix-loop-helix transcription factors mediate human mesenchymal stem cell growth and commitment. Stem Cells, 27, 2457-2468. doi:10.1002/stem.181
- Yang, D.C., Yang, M.H., Tsai, C.C., Huang, T.F., Chen, Y.H. and Hung, S.C. (2011) Hypoxia inhibits osteogenesis in human mesenchymal stem cells through direct regulation of RUNX2 by TWIST. PloS One, 6, e23965. doi:10.1371/journal.pone.0023965