American Journal of Molecular Biology
Vol. 2 No. 4 (2012) , Article ID: 24037 , 9 pages DOI:10.4236/ajmb.2012.24038
Chimeric oncogenic interferon regulatory factor-2 (IRF-2): Degradation products are biologically active
![]()
1Recombinant DNA Technology Laboratory, Centre for Biological Science, Central University of Bihar, Patna, India
2Radiation and Cancer Biology Laboratory, School of Life Sciences, Jawaharlal Nehru University, New Delhi, India
3Molecular Biology Laboratory, School of Life Sciences, Jawaharlal Nehru University, New Delhi, India
Email: *kpmolbio@gmail.com
Received 2 August 2012; revised 20 September 2012; accepted 28 September 2012
Keywords: Recombinant Interferon Regulatory Factor-2 (IRF-2); DNA Binding Domain (DBD); C-Terminus of IRF-2; EMSA
ABSTRACT
Interferon Regulatory Factor-2 (IRF-2) belongs to IRF family, was identified as a mammalian transcription factor involved in Interferon beta (IFNβ) gene regulation. Besides that IRF-2 is involved in immunomodulation, hematopoietic differentiation, cell cycle regulation and oncogenesis. We have done molecular sub-cloning and expression of recombinant murine IRF-2 as GST (Glutathione-S-Transferase)- IRF-2 fusion protein in E. coli/XL-1blue cells. Recombinant IRF-2 with GST moiety at N-terminus expressed as GST-IRF-2 (~66 kd) in E. coli along with different low molecular mass degradation products revealed approximately 30, 42, 60 and 62 kd by SDSPAGE and Western blot, respectively. We further confirm that degradation takes place at C-terminus of the fusion protein not at N-terminus as anti-GST antibody was detecting all bands in the immunoblot. The recombinant IRF-2 was biologically active along with their degradation products in terms of their DNA binding activity as assessed by Electrophoretically Mobility Shift Assay (EMSA). We observed three different molecular mass DNA/protein complexes (1 - 3) with Virus Response Element (VRE) derived from human Interferon IFNβ gene and five different molecular mass complexes (1 - 5) with IRF-E motif (GAAAGT)4 in EMSA gel. GST only expressed from empty vector did not bind to these DNA elements. To confirm that the binding is specific, all complexes were competed out completely when challenged with 100-X fold molar excess of IRF-E oligo under cold competition. It means degradation products along with full-length protein are able to interact with VREβ as well as IRF-E motif. This means degradation products may regulate the target gene (s) activation/repression via interacting with VRE/ IRF-E.
1. INTRODUCTION
IRF-2 is a transcription regulator of virusand IFNinduced signalling pathways, which plays a critical role in antiviral defence, immune response, cell growth regulation and oncogenesis [1]. IRF-2 belongs to IRF family whose ten members are known so far. They are namely IRF-1, IRF-2, IRF-3, IRF-4 (Pip/PU.1/LSIRF/ICSAT), IRF-5, IRF-6, IRF-7, IRF-8 (ICSBP), IRF-9 (P48/ISGF- 3g). All members having pentad tryptophan in their DNA binding Domain (DBD) present at N-terminus of the protein. The diversity in function(s) among family members are due to presence of diverse C-terminus, for instance, IRF-1, IRF-3, IRF-7, IRF-9 and IRF-10 is transcriptional activator whereas IRF-2 and IRF-8 is transcriptional repressor/activator [1].
Mutational analysis has shown that IRF-2 protein has N-terminal DNA binding domain (DBD) and C-terminal Repression domain (RD) [2]. A variety of agents like type-1-IFN, IRF-1, viruses, dsRNA and other agents stimulate IRF-2 mRNA expression [2]. IRF-2 participates in regulation of IFN signaling by binding on ISRE (IFN Stimulated Response Element) sequence. IRF-2 attenuates IRF-1-mediated gene expression by competitively binding on interferon stimulated response element (ISRE) sequence of the gene [3]. Moreover, IRF-2 regulates cell cycle progression by inducing expression of H4 gene [4]. Thus, IRF-2 is a very important transcription factor, having both repression as well as activation function. IRF-2 DNA binding domain is almost similar to DBD of rest of the members and regulates repression as well as activation. Thus, binding pattern of IRF-2 is crucial for its functions. The carboxyl terminus of IRF-2 contains a repression domain, the deletion of which converts IRF-2 to a transcriptional activator [5]. With regard to the regulatory modifications of IRF-2 proteins, it undergoes inducible proteolytic processing. IRF-2 is cleaved in carboxyl terminal region following viral infection or double-stranded RNA treatment, resulting in its conversion to either an activator or a strong repressor [6].
Several studies have suggested that IRF-2 is oncogenic in nature. IRF-2 causes cancer when abnormally over expressed or mutated. In Pancreatic tumor, this gene is found to be over expressed [7]. Apart that, in vivo study from pancreatic tumour samples showed that IRF-2 gene is point mutated lead to inactivation of this gene product [8]. Although the exact mechanism underlying this cell transformation is still unknown, it is possible that IRF-2 exerts its oncogenic function through mediation of IRF-1 and/or other IRF family members. This possibility supported by the finding that NIH 3T3 cells expressing only the DBD of IRF-2 were also transformed. On the other hand, alteration of IRF-1/2 expression may occur in breast cancer tissues [9]. Moreover, IRF-2 makes the cancerous esophageal cells refractory to INFg action via suppressing IFNGR1 in order to develop cancer. In this condition, IRF-2 level goes up that down regulate the IFNGR1 expression and makes esophageal cancer cells resistance to antitumour cytokine IFNg [10]. This supports the conclusion that IRF-2 is an oncogene.
In the present study, we have done molecular subcloning and expression of recombinant IRF-2 as a GST (Glutathione-S-Transferase)-IRF-2 fusion protein. We demonstrated four different lower molecular mass degradation products along with full length recombinant protein. Furthermore, we have shown that degradation took place at C-terminus. These degradation products are capable for bind with VREβ and IRF-E motif. This means degradation products are biologically active in terms of DNA binding and may influence the target gene(s) expression.
2. MATERIALS AND METHODS
2.1. Plasmids, Escherichia coli Cells, Antibodies and Reagents
Mouse IRF-2 cDNA (pIRF2.5 Plasmid), pGEM®-T Vector Systems (Promega), pGEX2TK expression plasmid, E. coli DH5α- and XL-1Blue cells for IRF-2 sub-cloning and expression, respectively, forward primer (IRF-2P1: 5’AAGGATCCATGCCGGTGGAACGGATGCGA 3’) and reverse primer (IRF-2P2: 5’AAGGATCCTTAACAGCTCTTGACACGGGC 3’), anti-GST (G7781, Sigma-aldrich, USA) and anti-rabbit IgG-HRP antibodies (A9169, Sigma-aldrich, USA), antiIRF-2 antibody (H-229: sc-13042, Santa Cruz Biotech, USA), Taq DNA polymerase (Stratagene), restriction enzymes, T4 DNA ligase and T4 polynucleotide kinase (New England Biolabs, MBI Fermentas) and molecular biology grade reagents (Sigma Chemicals Co.). The most commonly used molecular biology methods were adopted from the reference [11] and suitably modified.
2.2. TA-Cloning and Sequencing
The PCR products were separated on a 1% agaroseethidium bromide gel, cut out from the gel and purified (Gel Extraction Kit, Qiagen). Two microliters of purified PCR product (~25 ng) was ligated into pGEM-T easy vector (Promega) in the following mix: 2 µl of gel purified IRF-2 ORF, 2 µl pGEMT easy vector (25 ng/µl), 1 µl T4 DNA Ligase (3U/µl), 5 µl ligation buffer (2X) (30 mM Tris-HCl pH 7.8, 10 mM MgCl2, 10 mM DTT, 10 mM ATP, 5% polyethylene glycol). Four microlitres of a ligation mix were added to 200 µl of E. coli/DH5α competent cells and plated onto 100 µg/ml ampicillin containing LB agar plates. White colonies were picked and checked for the presence of the insert by PCR. PCR-positive colonies were grown overnight in 5 ml of 100 µl/ml ampicillin containing LB medium. Plasmids were extracted from bacteria, purified (Miniprep purification Kit, Qiagen) and its insert sequenced commercially on an ABI 377 Automated Sequencer (TCGA, New Delhi) using M13 reverse and forward primers. Chromatograms were then analysed with Chromas software.
2.3. pGEX-2TK Cloning
The IRF-2 ORF fragment was sub-cloned into pGEX2TK vector at BamHI site after digesting pGEMT-IRF-2 clone with BamHI restriction endonuclease followed by gel purification. Ligation reaction was set up as follows: 5 µl IRF-2 ORF gel purified insert (~ 50 ng), 7 µl pGEX2TK vector (150 ng) BamHI digested, dephosphorylated and gel purified, 1 µl of T4 DNA Ligase (NEB) (400 U/µl), 3 µl ligation buffer (5X) (30 mM Tris-HCl pH 7.8, 10 mM MgCl2, 10 mM DTT, 200 mM ATP, 5% polyethylene glycol). Four microliters of a ligation mix were added to 200 µl of E. coli/ XL-1 blue competent cells and plated onto 100 µl/ ml Ampicillin Containing LB agar plates. Colonies were picked and checked for the presence of the insert by BamHI Restriction digestion.
2.4. Expression of GST-IRF-2
Five milliliter LB medium containing ampicillin (100 mg/ml) was inoculated with a single colony of pGEXIRF-2 /E. coli XL-1 and grown overnight at 37˚C. 100 ml of the overnight grown culture was used to inoculate another 10 ml LB with appropriate ampicillin and grown for 3 - 4 hours at 37˚C until O.D600 nm reached between 0.6 to 0.8. IPTG (0.5 mM) induction was carried out at 37˚C for 3 hours along with the control (E. coli XL-1 blue cells containing pGEX-2TK vector). Extracts from the equal number of cells (~1.0 O.D600 nm) was prepared and used to assess GST-IRF-2 expression. Cell pellet from 1.0 O.D. volume of each culture was resuspended in 150 ml of water and 50 ml of 4X loading dye (0.06 M Tris Cl, pH.8.0, 2% SDS, 10% Glycerol, 0.025% Bromophenol blue) and subjected to boil in a water bath at 95˚C for 10 minutes. The samples were given a spin at 10 K rpm, RT for 30 seconds and resolved in 10% SDS-PAGE at 100 V for 6 hrs. The gel was stained with Coomassie brilliant blue R250.
2.5. Western Immunoblotting
IPTG-induced and uninduced E. coli/XL-1blue cells expressing recombinant IRF-2 cell extracts were resolved on 10% SDS-PAGE, electroblot to nitro-cellulose filters, blocked by 5% milk in PBST (PBS with Tween-20), washed by PBST and incubated with anti-GST (1:2000) antibody, washed by PBST, further incubated with antirabbit IgG-HRP secondary antibody (1:3000), washed by PBST and developed by DAB (3,3’-diaminobenzidine)- staining.
2.6. E. coli Extract for EMSA
Fifty milliliter of the IPTG-induced culture were centrifuged at 5 k rpm for 5 minutes at 4˚C. The cell pellet was washed with 5 ml PBS and resuspended in 5 ml of lysis buffer (10 mM HEPES, pH 7.9; 2 mM EDTA, pH 8.0; 1 mM EGTA 400 mM KCl; 0.1% Triton X-100; 10% glycerol; 1 mM DTT; 1 mM PMSF and 1mg/ml of the protease inhibitors: Aprotinin, Leupeptin and Benzamidine), sonicated on ice at 15 micron amplitude for 15 seconds, repeated six times with intervals of one minute. The extract was clarified by centrifugation at 12 krpm for 5 minutes at 4˚C. The supernatant was aliquoted and stored at –80˚C for further use. Protein concentration of the extract was estimated by Bradford’s reagent.
2.7. Electrophoretic Mobility Shift Assay
One picomole of (GAAAGT)4 and VREβ
(5’-GGGAGAAGTGAAAGGGGGAAATTCCTCTGA ATAGAGAGAGGAC-3’) oligonucleotides were
32P-labeled at the 5’ end by using g [32P] ATP and T4 polynucleotide kinase; the labeled oligonucleotide was separated from the free label by Sephadex G-50 spin column. The 32P-labeled oligonucleotide was annealed into the double-stranded oligonucleotide by mixing it with nine pmol of the complementary oligonucleotide. A typical DNA binding reaction contained 2.0 mg of bacterial cell extract, 50 fmol of double stranded 32P(GAAAGT)4 or 32PVREβ (specific activity: 2 – 3 × 10⁶ cpm/pmol) in the reaction buffer (20 mM HEPES, pH 7.9, 0.4 mM EDTA, pH 8.0, 0.4 mM DTT, 5% glycerol) containing 2.0 mg of calf thymus DNA and was incubated at 37˚C for 30 minutes. In cold-competition assay 100 X-fold molar excess of the double stranded (GAAAGT)4 competitors was added in addition. The sample was mixed with loading dye and resolved in 7.5% native polyacrylamide gel ran at 150 V for four hours. The gel was dried on 3-mm filter paper at 80˚C for 1 h, exposed to the phosphor screen and the image was developed in a fujifilm FLA 5000 phosphoimager and pixels per DNAprotein complex and free label were quantitated from the primary TIFF-image by image gauge V2.54 software.
3. RESULTS
3.1. Amplification of IRF-2 ORF by PCR and Construction of pGEMT-IRF-2 Clones
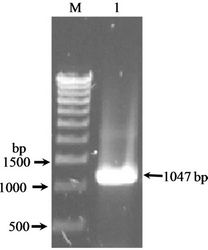
Figure 1(a) shows the 1047 bp IRF-2 ORF (atg to tag) was PCR amplified from IRF-2 cDNA containing plasmid pIRF2.5 by using forward primer (IRF-2P1) and reverse primer (IRF-2P2) primers. The IRF-2 ORF amplicon was sub-cloned into the multiple cloning site of pGEMT vector (T-A cloning). Figure 1(b) shows map of pGEMTIRF-2 vector showing arrangement of IRF-2 ORF. Furthermore, recombinancy of pGEMT-IRF-2 vector was confirmed by BamHI restriction digestion. Figure 1(c) shows release of IRF-2 fragment (~1 kbp) after BamHI digestion (lanes 5 and 7). On that basis, two clones namely, pGEMT-IRF-2 (2.2 and 2.3) were selected for subsequent work.
3.2. Construction of Expression Vector of IRF-2 Gene of Murine
Figure 1(d) shows the prokaryotic pGEX-IRF-2 plasmid map. pGEMT-IRF-2 clone 2.2 was subjected to BamHI digestion to release of IRF-2 ORF fragment, which was sub-cloned at BamHI site of pGEX2TK vector plasmid. The recombinancy of pGEX-IRF-2 clones was confirmed by BamHI restriction digestion. We have selected four clones namely, pGEX-IRF-2 (X2.12, X2.19, X2.21 and X2.29) (lane 1, 4, 6 and 8). Figure 1(e) shows four clones (pGEX-IRF-2 X2.12, X2.19, X.2.21 and X2.29) plasmid. Furthermore, orientation was checked by EcoRI digestion. Figure 1(f) shows three positive clones. They were X2.12, X2.19 and X2.21 (lanes 4, 6 and 8) and one negative oriented clone X2.29 was also obtained showing release of ~250 bp fragment in lane 10. Furthermore, DNA sequencing of the clones was carried out to confirm that there is no mutation(s) in the IRF-2 ORF. We have not observed any mutation in all the clones (X2.12, X219 and X2.21) (Data not shown). We then moved to check the expression of this gene in E. coli/XL-1 blue strain.
 (a)
(a)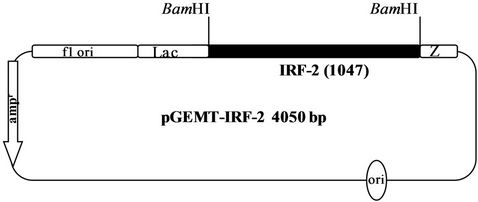 (b)
(b)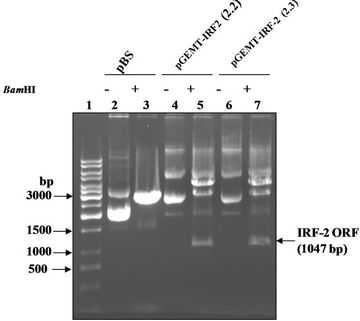 (c)
(c)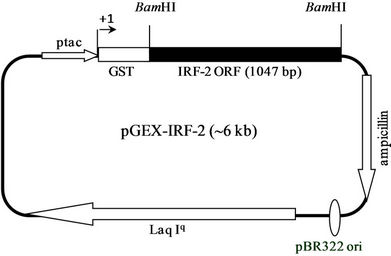 (d)
(d)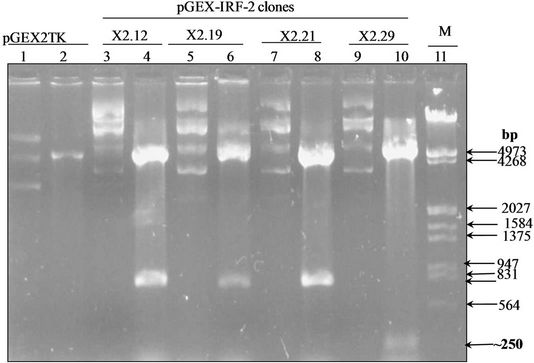 (e)
(e)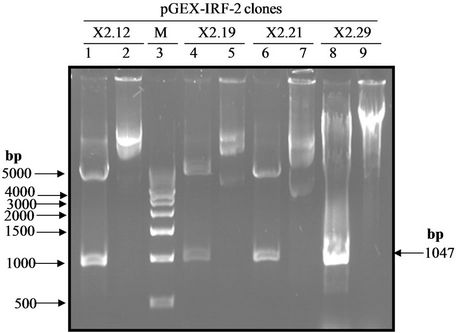 (f)
(f)
Figure 1. PCR amplification of IRF-2. (a) 1% TAE agarose gel showing Lane 1, PCR amplified IRF-2 ORF (1047 bp); M: Marker 0.5 Kb ladder. (b) Sub-cloning of IRF-2 ORF in pGEMT vector. pGEMT-IRF-2 recombinant plasmid map. (c) 1% TAE agarose gel showing plasmid DNA of pGEMT-IRF-2 clones 2.2 and 2.3. Lane 1, Marker 1 kb ladder; 2, pBluescript Plasmid DNA; 3, pBSIISK/BamHI; 4, pGEMT-IRF-2(2.2) plasmid DNA; 5, pGEMT-IRF-2 (2.2)/BamHI digestion showing release of ~1Kb IRF-2 fragment; 6, pGEMT-IRF-2(2.3) Plasmid DNA and 7, pGEMT-IRF-2 (2.3)/BamHI digestion showing release of ~1kb IRF-2 fragment. (d) pGEX-IRF-2 expression Plasmid. pGEX-IRF-2 expression cassette showing arrangement of IRF-2 ORF in pGEX2TK expression vector. (e) BamHI digestion of pGEX-IRF-2 clones X2.12, X2.19, X2.21and X2.29 clones are showing release of IRF-2 insert DNA (1047 bp) fragment. Lanes 1, X2.12/BamHI; 2, X2.12 Plasmid DNA; 3, Marker 0.5 kb DNA ladder; 4, X2.19/BamHI; 5, X2.19 Plasmid DNA; 6, X2.21/BamHI; 7, X2.21 plasmid DNA; 8, X2.29/BamHI and 9, X2.29 Plasmid DNA. Arrow indicates the release of 1047 bp IRF-2 fragment. (f) Orientation check of clones: 1% TAE agarose gel showing Lane 1, pGEX2TK plasmid DNA; 2, pGEX2TK/EcoRI; 3, pGEX-X2.12 plasmid DNA; 4, pGEX-X2.12/EcoRI; 5, pGEX-X2.19 Plasmid DNA; 6, pGEX-X2.19/EcoRI; 7, pGEX-X2.21 plasmid DNA; 8, pGEX-X2.21/EcoRI; 9, pGEX-X2.29; 10, pGEX-X2.29/EcoRI and 11, l DNA/HindIII-EcoRI marker. Positive clones (pGEX-X2.12, pGEX-X2.19 and pGEX-X2.21) are showing release of ~800 bp fragment (arrow). Negative clone pGEX-X2.29 showing release of ~250 bp fragment.
3.3. Expression of the IRF-2 Gene of Murine in E. coli/XL-1 Blue
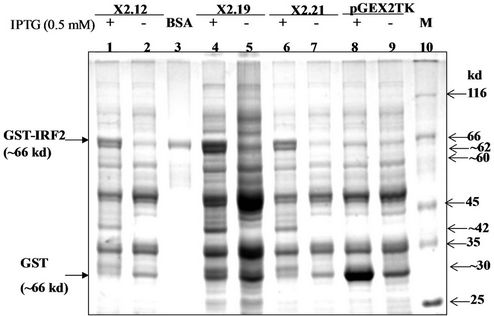
The 1047 bp IRF-1 DNA sequence represents the complete 349 amino acid (~39.4 kd) murine IRF-2. It is preceded by a 201 a.a. (26 kd) GST fusion at its N-terminus. GST is expressed from the pGEX-2TK vector after IPTG-induction. The three pGEX-IRF-2/E. coli XL-1 blue clones, i.e., {pGEX-IRF-2 (X2.12), pGEX-IRF-2 (X2.19) and pGEX-IRF-2 (X2.21)} were screened for expression of GST-IRF-2 after 0.5 mM IPTG induction for three hours at 37˚C (Figure 2(a)). The IPTG-induced band corresponded to the calculated size of ~66 kd for the GST-IRF-2 as judged by the protein standards used (lane 3). The pGEX-IRF-2 clones: X2.12, X2.19 and X2.21 showed the correct (~66 kd) size IPTG-induced band (Lane 1, 4 and 6). The induced band for GST (26 kd) corresponded with the 30 kd band of the standard. Empty vector pGEX2TK is showing induction of 26 kd band after 0.5 mM IPTG induction for three hours at 37˚C was used as a control (Lane 8). Four additional bands of lower molecular mass of approximately 62, 42, 32 and 30 kd were also induced by IPTG in these clones (lanes 1, 4 and 6).
3.4. Immunoblot of Recombinant IRF-2
Immunoblot analysis of the GST-IRF-2 was carried out by anti IRF-2 and anti-GST antibodies to find immunization of the recombinant protein (s) against the antibodies. This may indicate properties of the proteins similar to the native IRF-2. Western blot analysis using the polyclonal anti-IRF-2 antibody detected three specific GST-IRF-2 bands at approximately 60, 62 and 66 kd only in the IPTG-induced pGEX-IRF-2 clone (X2.12) extract (Data not shown). The 66 kd band corresponds to GST-IRF-2 while the ~62, ~42, ~32 and ~ 30 kd bands may be degradation products of the GST-IRF-2. To detect whether the degraded GST-IRF-2 products are retaining N-terminal GST or not, immunoblot with anti-GST antibody was carried out. We detected four bands of lower molecular mass approximately 30, 32, 42 and 62 kd along with 66 kd band corresponds to GST-IRF-2 (Figure 2(b)).
3.5. Optimization of IPTG Concentration and time Course Study of Recombinant IRF-2
Figure 2(c) shows the optimization of the IPTG-concentration for induction. The pGEX-IRF-2 (X2.12)/E. coli XL-1 blue cells were induced at 0.5 O.D.600 nm with IPTG at: 0, 0.1, 0.2, 0.3, 0.4, 0.5, 0.6 and 0.7 mM for three hours at 37˚C. Induction of GST-IRF-2 were observed at as low as 0.1 mM IPTG (lane 4). The vector control (pGEX-2TK/E. coli) was induced with 0.5 mM IPTG and pronounced induction of GST (26 kd) was observed (lane 2). BSA (66 kd) was used as a standard to assess the size of the induced GST-IRF-2 band and its amount (lane 11). A time course experiment for the expression of GST-IRF-2 on induction with 0.5 mM IPTG was carried out (Figure 2(d)) at following time points: 0, 15, 30, 60, 120 and 180 minutes. Induction of GST-IRF-2 and its degradation products were observed as early as 15 minutes, and it gradually increased up to 3 h (lanes 4 - 15). The vector control showed expression of GST (lane 2).
3.6. EMSA Study of pGEX-IRF-2 Clones
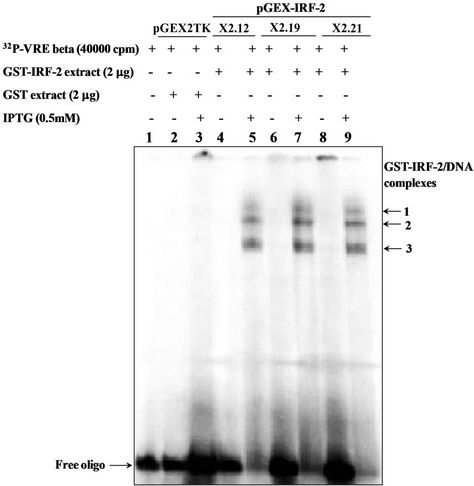
Two microgram of IPTG-induced cell extracts from pGEX-IRF-2 clones (X2.12, X2.19, X2.21) were assessed for its DNA binding activity with 32P (VREβ) as well as with 32P (GAAAGT)4 by EMSA. Three different molecular mass DNA-protein complexes 1-3 were observed shown in Figure 3(a) by all clones (X2.12, X2.19 and X2.21) under IPTG-induced condition (Lanes 5, 7 and 9). There were no complex formations observed with GST expressing clone, i.e., from empty vector (Lane 3) and from IPTG-uninduced pGEX-IRF-2 clones extract (Lanes 4, 6 and 8). Quantification of the complexes is shown in Figure 3(b), where the complex 3 pixel intensity was maximum and complex 1 pixel intensity was minimum in all clones.
Two mg of IPTG-induced extracts from the pGEXIRF-2 clones (X2.12, X2.19) and (X2.21) were assessed for its DNA binding activity of chimeric IRF-2 with 50 fmole of 32P (GAAAGT)4 by EMSA. Figure 4 shows five different molecular mass DNA-protein complexes (1 - 5) with IRF-E motif P32(GAAAGT)4. Complexes 1 - 5 (lanes 3, 5 and 7) indicating sequence specificity for IRF-2. Competition by 100-X fold molar excess of (GAAAGT)4 (cold competition) inhibited formation of complexes 1, 2, 3, 4 and 5 completely (lanes 4, 6 and 8) showing specificity of IRF-2 to interact with IRF-E motif. There was no complex formation observed with the pGEX-IRF-2 clone IPTG uninduced extract means complexes were specific to IRF-2.
4. DISCUSSION
Biologically, IRF-2 plays an important role in cell growth regulation, and it has been shown as a potential oncogene. Recently, two novel co-repressor molecules have been recognized namely IRF-2BP1 and IRF-2BP2. They are nuclear proteins and have the properties of IRF-2 dependent transcriptional co-repressor that can inhibit basal transcription in a manner that is not dependent on histone deacetylation [12]. An interesting question is how a single transcription factor can be involved in all of these different functions? Function of IRF-2 apparently differs with cell type, presumably due to the presence or absence of cell-type-specific factors that direct IRF-2 to particular set of promoters or that require IRF-2 for their
 (a)
(a)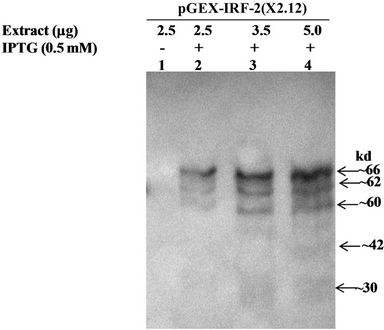 (b)
(b)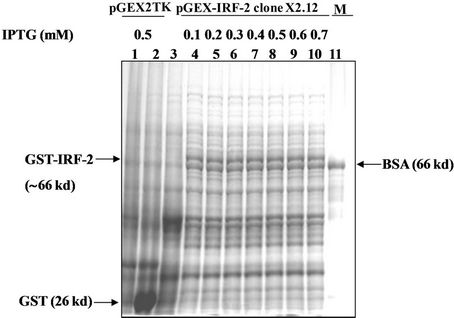 (c)
(c)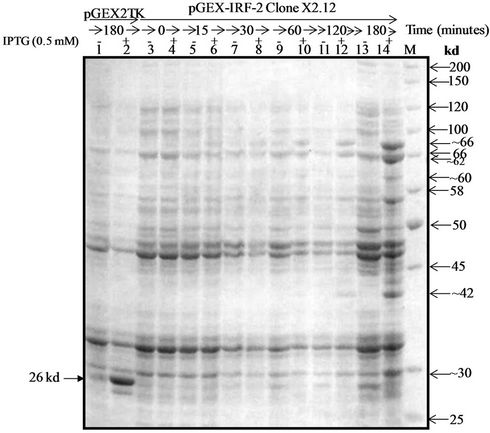 (d)
(d)
Figure 2. (a) 10 % SDS-PAGE showing IPTG (0.5 mM) induced and uninduced IRF-2 clones and pGEX2TK clone protein profiles. Lane 1, Clone X2.12 IPTG-induced; 2, Clone X2.12 IPTG-uninduced; 3, BSA (66 kd); 4, Clone X2.19 IPTG-induced; 5, Clone X2.19 IPTG-uninduced; 6, Clone X2.21 IPTG-induced; 7, Clone X2.21 IPTG-uninduced; 8, pGEX2TK vector IPTG-induced; 9, pGEX2TK vector IPTG-uninduced and 10, M is the marker (MBI fermentas; molecular weight range 14 kd - 116 kDa); (b) Western blot of recombinant IRF-2. Soluble fraction of sonicated bacterial extracts containing GST-IRF-2 protein from clone X2.12 was used for the western blot analysis probed by anti GST antibody. Lane 1, 2.5 mg IPTG uninduced (–), Lane 2, 2.5 mg IPTG induced (+), Lane 3, 3.5 mg IPTG induced (+) and Lane 4, 5 mg IPTG induced (+); (c) Expression of GST-IRF-2 after induction of X2.12 clone with increasing concentration of IPTG (0.1, 0.2, 0.3, 0.4, 0.5, 0.6, 0.7 mM) for three hours. Expression of GST was observed by induction of vector (pGEX2TK) with 0.5 mM IPTG. Expression of GST-IRF-2 was observed after induction with 0.1 mM IPTG for three h. BSA: Marker; (d) Expression of GST-IRF-2 in relation to time course of IPTG induction. GST-IRF-2 was observed in clone X2.12 after induction with 0.5 mM IPTG at 0, 15, 30, 60, 120 and 180 minutes. Induction of GST by the vector (V) is shown at 180 minutes. BSA (66 kd) was used as a standard for size.
own function [13]. Post-translational modification and chromatin remodeling by interaction with histone acetylases like PCAF or p300 binding protein (CBP) may also influence its function [14]. Despite extensive information regarding its involvement in diverse cellular processes, very little is known about the mechanism(s) by which its structural domains function. IRF-2 is a typical modular protein comprising of different individual domains like DNA binding domain, transcriptional repression domain, IRF-association domain, transcriptional activation domain.
The pGEX-IRF-2 clones (X2.12), (X2.19) and (X2.21) showed the IPTG-induced bands ~66 kd for GST-IRF-2, 26 kd for GST (corresponded to 30 kd) and four additional bands of approximately ~62 kd, ~60 kd, ~42 kd and ~30 kd, as proteolytic degradation products of GST-
 (a)
(a)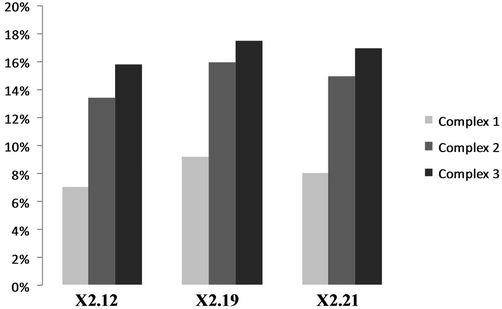 (b)
(b)
Figure 3. (a) DNA binding activity of recombinant GST-IRF-2 on natural promoter Interferon-b VRE beta by electrophoretic mobility shift assay. 2 mg IPTG-induced pGEX-IRF-2 clone (X.212), (X2.19) and (X2.21) extract produced three IRF-2 specific complexes 1-3 (lanes 5, 7 and 9) with 32P labeled VREβ. IPTG-induced pGEX2TK/XL1 E. coli extracts GST did not show any complex with 32P labeled VREβ (lane 3). Lane 1, Free oligo; 2, pGEX2TK Uninduced; 3, pGEX2TK IPTG-induced; 4, (X2.12) uninduced; 5, (X2.12) IPTG-induced; 6, (X2.19) uninduced; 7, (X2.19) IPTG-induced; 8, (X2.21) uninduced and 9, (X2.21) IPTG induced. (b) Quantitation of the IRF-2-DNA complexes from the EMSA gel by a phosphoimager. The amount of DNA-protein complexes was expressed as % pixel intensity of the free oligo. IRF-2-DNA complexes were quantified from the gel in Figure 3(a).
IRF-2. The GST-IRF-2 and its degradation products were observed as early as 15 minutes after induction. The host cell machinery developed a mechanism that brings about proteolysis of the recombinant protein. Such degradation products may be prevented at lower temperatures, e.g. 25˚C or below needs to be studied.
Four mg of BSA (Figure 2(a), lane 3) was used to assess the GST-IRF-2 protein amount per band in approximation. The vector control showed pronounced expression of the 26 kd GST. About 60 mg of GST-IRF-2 was produced from a 10 ml culture yielding up to 5% of the total cellular protein. Since the cell extract was prepared by lysis followed by sonication and centrifugation to yield the supernatant, the recombinant GST-IRF-2 fusion protein was expressed as a 66 kd soluble protein.
The expressed fusion protein GST-IRF-2 was further subjected to immunoblot analysis. Anti-IRF-2 immunoblot showed expression of IRF-2 protein as a 66 kd protein. Besides the full-length fusion protein, three degradation products were also observed (approximately 62 kd, 60 kd and 42 kd). Since IRF-2, antibody is C-terminus specific, and it recognizes only IRF-2 epitope amino acid number from 121 - 349. So, IRF-2 antibody failed to recognize 30 kd degradation product of recombinant IRF-2 (Data not shown). However, recognizing approximately 62 kd, 60 kd and 42 kd degradation products along with full-length fusion protein (~66 kd). The degradation may take place at C-terminus or N-terminus. To address this issue, immunoblot with anti-GST was carried out and four different low molecular mass approximately 30 kd, 42 kd, 60 kd and 62 kd degradation products were observed with anti-GST immunoblot (Figure 2(b)). Therefore, fusion protein was degraded at C-terminus not at N-terminus because the GST is fused with IRF-2 at N-terminus.
Induction of GST-IRF-2 was observed at a concentration of IPTG as low as 0.1mM. At higher concentrations of IPTG i.e., 0.6 and 0.7 mM, although the 66 kd GSTIRF-2 band was induced, the E. coli protein profile from the equal number of cells was quantitatively low. Therefore, 0.5 mM IPTG was considered as optimal for the induction. Clone X2.12 started expression of recombinant IRF-2 after 15 minutes of induction by 0.5 mM IPTG at 37˚C. This result was an agreement with the result of paper entitled “Expression and DNA binding activity of recombinant IRF-1 from mouse.” In this paper author has sub-cloned and expressed the recombinant mouse IRF-1 as a GST-IRF-2 fusion protein and observed three different low molecular mass degradation bands (~62 kd, ~42 kd and ~32 kd) along the full length GST-IRF-1(~65 kd) [15].
Moreover, we have also studied GST-IRF-2 binding
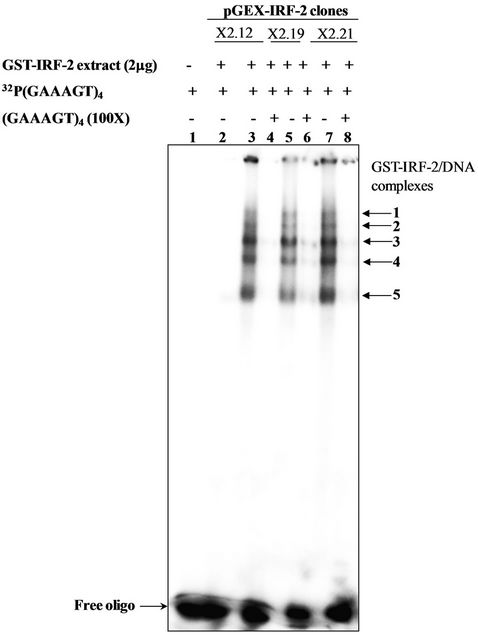
Figure 4. Study of interaction of recombinant IRF-2 with IRF-E motif by EMSA. Lane 1, Free oligo; Lane 2, X2.12 IPTG-uninduced; Lane 3, X2.12 clone extracts IPTG induced; Lane 4, X2.12 clone extracts IPTG induced 100X cold competition; Lane 5, X2.19 clone extracts IPTG-induced; Lane 6, X2.19 clone extracts 100× cold competition; Lane 7, X2.21 clone extracts IPTG-induced and 8, Clone X2.21 extract 100× cold competition.
on a natural promoter, i.e., the virus response element (–39 to –79) of the human interferon-b (VREb) promoter. There is a report of IRF-2 protein binds with the enhanceosome of IFNb gene in order to attenuate the gene transcription. IFNb gene promoter has IRF-E, through which IRF-2 mediates its function [16]. Formation of more than one complex with recombinant protein is proving that degradation products are also taken part in complex formation. We have also proved that the low molecular mass degradation products are retaining DNA binding domain and forming complex. This means the degradation products are also biological active and may influence the target gene(s) activation/repression.
Next we checked the binding capacity of degradation products along with full-length protein on IRF-E motif. Five DNA-protein complexes (complex 1-5) in the IPTGinduced extract of the pGEX-IRF-2 clones (X2.12, X2.19, and X2.21) with 32P(GAAAGT)4 indicating specificity of (GAAAGT)6 sequences for IRF-2. Furthermore, cold competition with 100-X fold molar excess inhibited the complex formation completely. This means the binding specificity lies at the GT di-nucleotide of the IRF-E motif. Thus, GST-IRF-2 as well as its different low molecular mass (~30, ~42, ~60 and ~62) degradation products were biologically active in terms of DNA binding. It would be interesting further to explore the biological function (s) of these degradation products in vitro as well as in vivo in terms of gene expression.
5. ACKNOWLEDGEMENTS
The kind gift of pIRF-2.5 plasmid from Prof. Taniguchi, Japan, and Council of Scientific and Industrial Research fellowship to Krishna Prakash and capacity Build-up grants to PCR are gratefully acknowledged.
REFERENCES
- Mamane, Y., Heylbroeck, C., Genin, P., Algarte, M., Servant, M.J., LePage, C., DeLuca, C., Kwon, H., Lin, R. and Hiscott, J. (1999) Interferon regulatory factors: The next generation. Gene, 237, 1-14. doi:10.1016/S0378-1119(99)00262-0
- Taniguchi, T., Ogasawara, K., Takaoka, A. and Tanaka, N. (2001) IRF family of transcription factors as regulators of host defense. Annual Review of Immunology, 19, 623- 655. doi:10.1146/annurev.immunol.19.1.623
- Harada, H., Fujita, T., Miyamoto, M., Kimura, Y., Maruyama, M., Furia, A., Miyata, T. and Taniguchi, T. (1989) Structurally similar but functionally distinct factors, IRF- 1 and IRF-2, bind to the same regulatory elements of IFN and IFN-inducible genes. Cell, 4, 729-739. doi:10.1016/0092-8674(89)90107-4
- Aziz, F., van Wijnen, A.J., Stein, J.L. and Stein, G.S. (1998) HiNF-D (CDP-cut/CDC2/cyclin A/pRB-complex) influences the timing of IRF-2-dependent cell cycle activation of human histone H4 gene transcription at the G1/S phase transition. Journal of Cell Physiology, 3, 453-464. doi:10.1002/(SICI)1097-4652(199812)177:3<453::AID-JCP8>3.0.CO;2-F
- Yamamoto, H., Lauphier, M.S., Taniguchi, T. and Harada, H. (1994) The oncogenic transcription factor IRF-2 possess a transcriptional repression and a activation domain. Oncogene, 9, 1423-1428. http://www.ncbi.nlm.nih.gov/pubmed/8152803
- Palombella, V.J. and Maniatis, T. (1992) Inducible processing of interferon regulatory factor-2. Molecular and Cellular Biology, 12, 3325-3336. http://mcb.asm.org/content/12/8/3325.long
- Cui, L., Deng, Y., Rong, Y., Lou, W., Mao, Z., Feng, Y., Xie, D. and Jin, D. (2012) IRF-2 is over-expressed in pancreatic cancer and promotes the growth of pancreatic cancer cells. Tumour Biology, 1, 247-255. doi:10.1007/s13277-011-0273-3
- Xi, H. and Blanck, G. (2000) Interferon regulatory factor-2 point mutations in human pancreatic tumors. International Journal of Cancer, 87, 803-808. doi:10.1002/1097-0215(20000915)87:6<803::AID-IJC7>3.0.CO;2-E
- Doherty, G.M., Boucher, L., Sorenson, K. and Lowney, J. (2001) Interferon regulatory factor expression in human breast cancer. Annals Surgery, 5, 623-629. http://www.ncbi.nlm.nih.gov/pmc/articles/PMC1421301/
- Wang, Y., Liu, D., Chen, P., Koeffler, H. P., Tong, X. and Xie, D. (2008) Negative feedback regulation of IFNgamma pathway by IFN regulatory factor 2 in esophageal cancers. Cancer Research, 4, 1136-1143.
- Sambrook, J., Fritsch, E.F. and Maniatis, T. (1989) Molecular cloning: A laboratory manual. 2nd Edition, Cold Spring Harbor Laboratory, Cold Spring Harbor, New York.
- Childs, K.S. and Goodbourn, S. (2003) Identification of novel co-repressor molecules for Interferon Regulatory Factor-2. Nucleic Acids Research, 12, 3016-3026. doi:10.1093/nar/gkg431
- Taniguchi, T., Tanaka, N., Ogasawara, K., Taki, S., Sato, M. and Takaoka, A. (2000) Transcription factor IRF-1 and its family members in the regulation of host defense. Quantitative Biology, 64, 465-472. doi:10.1146/annurev.immunol.19.1.623
- Masumi, A., Wang, I.M., Lefebvre, B., Yang, X.J., Nakatani, Y. and Ozato, K. (1999) The histone acetylase PCAF is a phorbol-ester-inducible coactivator of the IRF family that confers enhanced interferon responsiveness. Molecular and Cellular Biology, 3, 1810-1820. http://mcb.asm.org/content/19/3/1810.long
- Upreti, M. and Rath, P.C. (2005) Expression and DNA binding activity of the recombinant interferon regulatory factor-1 (IRF-1) of mouse. Molecular Biology Reports, 2, 103-116.
- Lin, R., Mustafa, A., Nguyen, H., Gewert, D. and Hiscott, J. (1994) Mutational analysis of interferon (IFN) regulatory factors 1 and 2 effects on the induction of IFN-beta gene expression. The Journal of Biological Chemistry, 26, 17542-17549. http://www.jbc.org/content/269/26/17542
NOTES
*Corresponding author.