American Journal of Molecular Biology
Vol.2 No.3(2012), Article ID:20997,13 pages DOI:10.4236/ajmb.2012.23026
A peptide of 17 aminoacids from the N-terminal region of maize plastidial transglutaminase is essential for chloroplast targeting
![]()
1Molecular Genetics Department, Centre of Research in Agrigenomics (CRAG), Barcelona, Spain
2Instituto de Biotecnología, Universidad de Papaloapan, Oaxaca, Mexico
Email: *mireia.santos@cragenomica.es
Received 30 May 2012; revised 20 June 2012; accepted 26 June 2012
Keywords: Chloroplast Transit Peptide; Localization; Maize Transglutaminase; Nuclear Transformation; Oryza Sativa; Zea Mays
ABSTRACT
Transglutaminases (TGases, EC 2.3.2.13) catalyse posttranslational modification of proteins by establishing ε-(γ-glutamyl) links and covalent conjugation of polyamines. In plants, the functionality of these enzymes is scarcely known. The maize transglutaminase gene (tgz), the only cloned plant TGase, produces major alterations in thylakoid membrane architecture when the transglutaminase (chlTGZ) protein was over-expressed in tobacco chloroplasts, significantly increasing the number of grana stacked layers. Here we demonstrate that nuclear transformation of rice plants starting from a tgz gene truncated in 17 N-terminal aas (tgzt) non altered chloroplast thylakoid structures. F3 transformed plants were analysed for TGase activity, chlTGZ presence and tgzt transcription levels. Transformed plants exhibited double the in vitro TGase activity of the non-transformed plants. Immunoblot and quantitative RT-PCR analysis results of tgzt-rice plants grown under different illumination periods revealed that chlTGZ maintains its differential expression depending on the light regime. Nevertheless, the maize protein was localised by confocal microscopy in the cell wall of transformed rice cells. TEM analyses of the transformed cells showed normal, non-altered chloroplast thylakoid structures with the maize protein preferentially located in the cell walls. The results confirmed that the tgz eliminated sequence is essential for chloroplast targeting, being its absence sufficient to the lack of protein expression in its original plastidal compartment. Interestingly, the immunolocalization of a putative endogenous rice TGase protein is also showed. These data give further information on plant TGase functionality and its relationship to photosynthetic membranes.
1. INTRODUCTION
Transglutaminases (glutamine:amine g-glutamyl-transferase, E.C. 2.3.2.13) (TGases) are enzymes that catalyse posttranslational modification of proteins by inter or intra-molecular cross-linking through acyl-transfer between g-carboxyamide groups of glutamine residues and e-amino groups of lysine. This activity results in the modification of the protein conformation and more extensive conformation changes due to bonding between the same and between different proteins, forming high molecular weight conjugates [1]. These wide spread enzymes are considered as biological glues, one of the most known is the Factor XIII human blood coagulation factor.
TGases and their functionality have been less studied in plants than in humans and animals. In plants, using Helianthus tuberosus isolated leaf chloroplasts it was shown that some antenna proteins of the phothosystems (LHCII, CP29, CP26 and CP24) were substrates of TGase activity [2]. The activity of maize TGase in meristematic calli and their isolated chloroplasts has been shown to be light sensitive, affected by hormone deprivation and with a light/dark rhythm [3]. In previous studies, we have immunolocalized maize plastidial TGase mainly in the grana-appressed thylakoids of mesophyll light-exposed cell chloroplasts [4]. However, the role of TGases in chloroplasts is not yet fully understood even if a role in photosynthesis has been hypothesised [5-7]. The isolation, for the first time in plants, of two related complementary maize DNA clones, tgz15 and tgz21, encoding active maize chloroplast TGase (chlTGZ) has allowed for more in-depth research on the role of this enzyme in plants [5,8]. The maize cDNA clones exhibit TGase activity and the general biochemical characteristics described for non-plant TGases. The over-expression of chlTGZ in E. coli has demonstrated that the protein can be efficiently produced in this system and although it is mainly accumulated in the inclusion bodies fraction, active protein has been obtained and the activity characterised [9,10]. Proteomic studies indicate that plastidial maize TGase is a peripheral thylakoid protein forming part of a specific PSII protein complex its expression pattern changing according to the chloroplast developmental stage and light regime [11].
By inducing over-expression of maize chlTGZ in Tobacco chloroplasts, using transformation by a specific chloroplast promoter [12], we found that TGase activity in the over-expressers increased 4 times in comparison to the wild-type. The tobacco plant phenotype was altered, with pale-green leaves and lacking fertility. Both in vivo probing and electron microscopy confirmed thylakoid remodelling of the transplastomic plants. A major increase in the granum size (i.e. increase in the number of stacked layers) with a concomitant decrease of stroma thylakoids was observed for the tobacco chlTGZ overexpressers. This, in turn, increased the thylakoid associated polyamines by around 90%. Furthermore, PSII antenna heterogeneity in vivo was found to change to a great extent in the over-expressers, with an increase in centres located in grana appressed regions (PSIIα) at the expense of centres located mainly in stroma thylakoids (PSIIβ). Functional comparison between Wt tobacco and tgz over-expressers indicated variations in terms of fast fluorescence induction kinetics, non-photochemical quenching of the singlet excited state of chlorophyll a and antenna heterogeneity of PSII.
In summary, transglutaminase expression is dependent on the duration of light exposure, indicating adaptation to different light conditions including natural habitats [13]. As a result, an important role of this enzyme in processes related to the adaptation to light stimuli, thylakoid appression and/or photoprotection has been suggested.
The majority of chloroplast proteins are encoded in the nuclear genome and post-translationally imported into an organelle. Virtually all chloroplast proteins encoded in the nucleus have an N-terminal chloroplast transit peptide (cTP) recognised by cytosolic chaperones, and the complex formed docks in the Toc (translocon at the outer membrane) machinery. The protein is then transported via the Tic (translocon at the inner membrane) complex into the chloroplast stroma in an ATPand GTP-dependent manner [14,15]. Upon entry, the cTP is cleaved by the stromal processing peptidase (SPP) [16].
A wide variety of methods have been developed to predict the subcellular localisation of a protein, important for a better understanding of its function. The methods differ in terms of the input data they demand and the technique employed to make the decision or prediction about protein location. The cTPs from different proteins have a wide variation in length (20 - 120 residues, average 55) and sequence, but they tend to be rich in hydroxylated residues, especially serines, with a low content of acidic residues [17], and a conserved alanine at the N-terminus, next to the initial methionine. A semiconserved motif, V-R-A/A-A-V, around the SPP cleavage site has also been identified, but the signal is not very strong and there are several examples of proteins that are located to both mitochondria and chloroplasts using identical sorting signals. cTPs have been characterised as having a three-domain structure: an uncharged N-terminal domain of approximately ten residues beginning with MAand terminating with a G/P, a central domain lacking acidic residues but enriched in S/T and, finally, a C-terminal domain rich in arginines and potentially forming an amphiphilic b-strand. Various regions of cTPs have also been predicted to form amphipathic α-helices [18,19]. In 1999, using cross-validation of homology-reduced dataset in their method, ChloroP (http://www.cbs.dtu.dk/services/ChloroP), Emanuelsson et al. [19] correctly identified 88% of the sequences, and their cleavage sites, as transit or non-transit peptides. Prediction of around 60% of the known cleavage sites in their sequence collection was also within +/–2 residues from the sites given in SWISS-PROT. Based on an extensive analysis of Arabidopsis sequences from SWISSPROT, the authors suggested that their method could be useful for identifying putative transit peptides in genome-wide sequence data.
TargetP is conceptually based on the binary predictors SignalP81 and ChloroP, for SPs and cTPs, respectively, which employ neural networks and are able to predict not only whether there is an N-terminal sorting signal, but also, with some degree of success, where it is cleaved. The apparent advantage of TargetP, which uses amino acid frequencies rather than particular motifs, is that the prediction is less sensitive to errors and omissions in the query protein sequence [20,21]. Despite all these methodologies, there is no real consensus, with considerable sequence variation depending on the species, the type of proteins, etc., when prediction of a chloroplast signal peptide in a plant-protein sequence is based on protein databases. Kleffmann et al. [22], analysing the Arabidopsis chloroplast proteome, identified 690 proteins with high confidence and indicated that the prediction for different sub-cellular localisations results from incorrect negative predictions of true chloroplast proteins. It is very difficult to define a pertinent but rigorously unbiased test to evaluate the performance of the various predictors [23]. Three recent programs claim better results than TargetP, with some justification. Predotar [24] uses neural networks, whereas LOCtree [25] and MultiLoc [26] use support vector machines. However, all prediction programs fail to recognize almost one-half to threequarters of bona fide organellar proteins (mostly membrane proteins) and also often have high false-positive rates [23]. Taking into account the major increase in experimentally determined localisations in recent years, it seems probable that future standardised predictors will be significantly better. In consequence, the biologically demonstrated presence of a chloroplast signal peptide in a specific protein sequence may be of significant interest to complement and verify the prediction data.
Amino acid translation of the maize tgz DNA sequences indicates a putative chloroplast signal peptide sequence between the methionine initiation codon and the 47th amino acid using ChloroP. With the aim of demonstrate if the initial 17 aas peptide, between its Nterminus sequence until the following methionine, is essential to drive maize chlTGZ protein to the chloroplast, here we transformed rice plants with a truncated tgz sequence (tgzt), lacking its first 17 aas. In contrast to results with tgz-transplastomic tobacco plants [12], although in the rice transformed plants TGase activity was higher and light dependent, we found that the eliminated peptide demonstrated to be sufficient for chlTGZ not to be expressed within the rice chloroplasts, which maintained a normal appearance and grana size. This indicates that the 17 amino acids eliminated from the original maize protein sequence are indispensable to drive the protein to the chloroplast compartment.
Last, by not least, the presence of an endogenous rice TGase protein is also showed. The implication of these results on the study of TGase functionality in plants, including rice, and the use of different database programs to predict chloroplast signal peptides are discussed.
2. MATERIAL AND METHODS
2.1. Plant Material
Rice (Oryza sativa var. Senia) tgzt-transformed and wild type plants were grown on a 1:1 peat: vermiculite substrate in the greenhouse at 23˚C - 30˚C with 16 h light: 8 h dark, and 70% ± 5% humidity during the light period and 60% ± 5% humidity during the dark period. Natural illumination (400 µmols·m–2·s–1 at 50 cms from the tables) was supplemented when necessary by T-Agro 400 W Philips sodium high-pressure lamps (176 µmols·m–2·s–1).
For RT-PCR and some immunoblot and activity analyses, leaf samples of the plants grown in dark and 2, 8, 12, 24 and 48 h of continuous illumination conditions were used. In all these cases, the same transformed plants were used.
2.2. Nuclear Rice Transformation with Maize tgzt cDNA
To demonstrate the existence of a N-terminus sequence predicted by as a chloroplast signal peptide in the maize TGZ protein, a truncated tgz cDNA (tgzt) was used for rice transformation. For nuclear transformation of rice plants, embryogenic callus was infected with Agrobacterium tumefaciens, using the pGreen0229 SK LR (nos-bar h+) vector system [27,28], that induced glyphosate (N-(phosphonomethylglycine) resistance in the transformed plants. For plasmid construction, the isolated terminator of the cauliflower mosaic virus (CaMV) was subcloned in the pGreen vector as a transcription termination signal, between EcoRV and EcoRI sites in the vector MCS. The 35S-CaMV duplicated constitutive promoter was then subcloned between the SacI and BamHI cloning sites. Both cassettes were obtained from the pJIT60 vector (John Innes Centre, Norwich, UK). Finally, the coding region of the truncated tgz cDNA (tgzt) was PCR amplified to add BamHI and EcoRI sites in sense orientation. The PCR reaction used 36 amplification cycles at 65˚C, with the following primers:
Primer P1 (BamHI site): 5’-GCCCGGGGGATCCGCTCATCGTGGACATCTAG-3’;
Primer P2 (EcoRI site): 5’-GCTGCAGGAATTCTCACCATATTTGTCTGCTC-3’.
The tgz truncated region (Figure 1, in bold) corresponds to a 17 aa sequence of the tgz21 cDNA from the first Met of the 47 aa sequence, predicted as a putative chloroplast signal peptide (ChloroP, http://www.cbs.dtu.dk/services/ChloroP) [5,6]. For this purpose, Agrobacterium tumefaciens competent cells were transformed by electroporation with the plasmid containing the tgzt cDNA. The cDNA coding region of tgzt, cloned below the 35S 2X constitutive promoter is presented in Figure 1.
Stable rice plant transformation was via the C58C1 Agrobacterium tumefaciens clone that confers resistance to rifampicin and gentamicin (Pgv2260). Agrobacterium transformation was by electroporation with 1 µg plasmid
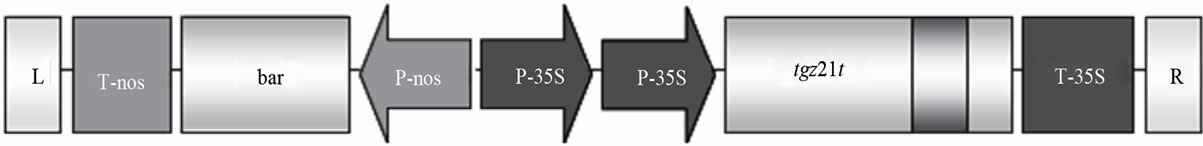
Figure 1. Schematic representation of the cDNA coding region of tgzt, cloned below the 35S 2X constitutive promoter in the pGreen0229 SK LR (nos-bar h+) vector system (see M & M).
DNA. Transformed colonies were selected after three days culture at 28˚C in LB medium supplied with 25 µg/ml kanamycin and 50 µg/ml rifampicin. The selected colonies were PCR-analysed using 36 amplification cycles and P1 and P2 primers. Positive PCR colonies were cultured in Erlenmeyer flasks (200 ml culture volume supplied with acetosyringone 100 mM) and 0.8 OD (600 nm).
2.3. Rice Callus Induction and Plant Regeneration
For callus induction, rice seeds were surface sterilised with 70% ethanol and 30% sodium hypochlorite and in vitro cultured in the dark at 28˚C - 30˚C for 4 - 6 weeks in induction medium (IM) (see Table 1 for media composition). Embryogenic callus formed in the scutellum of mature embryos were sub-cultured in the same medium for 2 weeks under the same conditions. The complete process of callus selection, transformation and plant regeneration is presented in Scheme 1. Once-sub cultured in regeneration medium (RN), calli were maintained for 2 - 3 days in the dark at 28˚C - 30˚C, followed by 3 - 4 weeks in the light with a 12:12 h light/dark photoperiod. The obtained plantlets were rooted in MS medium with 50 g/l sucrose and 2.6 g/l Phytagel at pH 5.8. The F0 plantlets were transferred to the greenhouse and selected against the contact herbicide COMPO© (ammonium glyphosate) up to the F3 generation (see Figure 2 and Table 1). Transformed plants were selected from the F1, F2 and F3 generations by PCR and herbicide resistance. A total of 12 plants per line from 11 transformed lines were seeded each time.
2.4. DNA Extraction and PCR Reactions
For leaf DNA extraction, the Quiagen© DNA-Easy plant mini kit was used following the manufacturer’s instructions. The PCR conditions were standardised as follows: 30 sec at 98˚C for initial denaturation; 35 cycles of 10 sec at 98˚C, 30 sec at 55˚C and 2 min at 72˚C; and 5 min at 72˚C for final extension. The PCR TaKaRa Ex TaqTM kit was used (dntps 25 mM, Taq polymerase 5 u/µl and Mg2+ 10× buffer). The oligonucleotides used as primers to detect the presence of the insert were as follows:
Forward primer: 5’-ATACAACTATGCTTATGATGCTGGCACG-3’;
Reverse primer: 5’-TATTTGTCTGCTCAACAAATGTGCATG-3’.
These primers were designed in a DNA region of the maize tgzt sequence that did not have any significant homology with the database-DNA rice sequences. The selected DNA region, of 371 bp, was near the tgzt 3’ end.
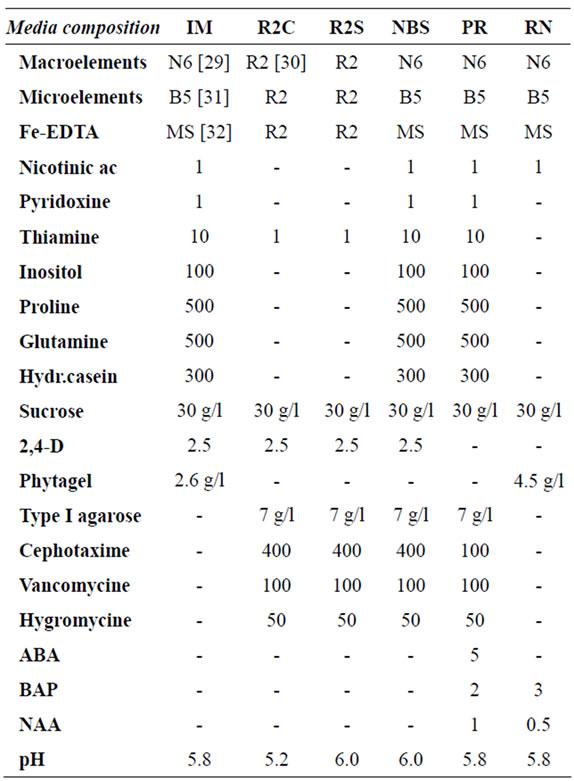
Table 1. Composition of the different media used for rice callus induction, tgz-transformation and plant regeneration. Concentrations are expressed in mg/ml unless otherwise stated.
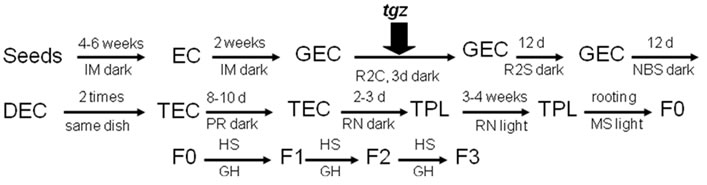
Figure 2. Rice embryogenic callus (EC) induction, Agrobacterium transformation (Agro + tgzt) and plant regeneration process. GEC, globular embryogenic callus; DEC, disaggregated embryogenic callus; TEC, Agro-tgz transformed callus; TPL, transformed plantlets, F0, F1, F3, transformed plant generations; HS, herbicide selection, GH, greenhouse. IM, R2C, R2S, NBS, PR, RN and MS, culture mediums (see Table 1 for composition).
To confirm the presence of the expected amplified DNA in the transformed plants, the PCR products were run on a 1.2% agarose gel and visualised. Plasmid DNA corresponding to the tgzt construction was used as the positive control. The different rice transformed lines were extracted separately for DNA extraction and PCR reaction.
2.5. Protein Extraction and Western Blot Analysis
Proteins were extracted from leaves with Tris-HCl 100 mM, pH 7.5; NaCl 10 mM; SDS 1% (w/v); β-mercaptoethanol (2 M) and protease inhibitors. The extracted protein was homogenised for 1 h at 4˚C and centrifuged at 14,000 rpm. The supernatant was quantified by the Bradford method using the Bio-Rad© reagent. Proteins were separated by SDS-PAGE according to Laemmli [33] in a Mini-Protean III system (Bio-Rad, Hercules, CA, USA) adding 3 mg protein per ml of buffer. The separated proteins were transferred to nitrocellulose membrane (GE Healthcare, Little Chalfont, UK) on wet system (Bio-Rad, Hercules, CA, USA) according to the manufacturer’s instructions. Non-fat dry milk (5%, w/v) in PBS 1× was used as the blocking agent and then the membrane was washed with Tween 20 in PBS (0.1 to 0.3%, v/v). The specific anti-TGase antibody (PAB/18QA) was used for immunodetection, designed from a peptide corresponding to 21 aas of the C-terminal chlTGZ region [11] and the generic anti-TGase antibody (AbH) from Helianthus tuberosus [4]. Antibodies were diluted in PBS to 1:1000 in the case of the PAB/18QA antibody and to 1:10,000 in the case of AbH. As secondary antibodies, an anti-rabbit IgG at 1:15,000 in the case of PAB/ 18QA, and an anti-chicken at 1:6600 in the case of AbH were used. Immunodetection was by chemiluminescence (ECL, Amersham Pharmacia Biotech©) following the manufacturer’s instructions. Western-blot images were taken using a LAS-3000 Fuji (Japan) Imaging System.
2.6. Confocal Microscopy Immunodetection
Segments of 2 - 3 mm from 2.5-month adult plants were fixed in a formaldehyde, acetic acid and ethanol solution (5:3.5:5) for three days at 4˚C, dehydrated and finally embedded in wax blocks to obtain 8 µ longitudinal cuts using a Reichert-Jung 2050 microtome (Cambridge Instruments, UK). The wax was removed using HistoClear© (Nat. Diagnostics) at 100% for 10 min and 2 min consecutively, followed by washes with decreasing ethanol concentrations to 100% water. The tissue cell wall was digested with a solution of 1% cellulose and 0.1% pectolyase in 1× PBS for 15 min at 25˚C, followed by 5% BSA in 1× PBS for 30 min as blocking solution. The primary antibody (PAB/18QA and AbH) was then added at the same concentration as for the western blot and agitated for 1 h. After 3 washes in 1× PBS + 0.05 Tween 20, the corresponding secondary antibody, marked with the fluorophore Alexa Fluor 488© (Molecular Probes) at the same concentration as in the western blot, was added for 1 h. Finally, samples were washed three times in PBS + Tween 20 (0.05%). The results were visualised in an Olympus FV1000 Confocal Laser Scanning Microscope (Tokyo, Japan), equipped with an argon ion laser that emits at 488 nm. A dichroic mirror DM 405/408 was used for observations. The chlorophyll emission was subtracted from the Alexa-488 image using the image visualisation of a tissue preparation treated only with the secondary antibody and immune serum, as the negative control. The emission window was fixed at 500 - 600 nm, the image projection with a combination of x-y projection, and the images viewed at 60× with a 5-zoom.
2.7. TEM Observations
2.7.1. Ultrastructure
Rice-leaf thin sections (less than 0.5 mm) were fixed by vacuum infiltration with 2% paraformaldehyde and 2.5% glutaraldehyde in 0.1 M phosphate buffer, pH 7.4. After washing, they were fixed for 2 h in osmium tetroxide, in the same buffer, dehydrated through an acetone series and embedded in Spurr resin by infiltration. The blocks were polymerised for 48 hr at 60˚C. Ultrathin sections were obtained with an Ultracut UCT ultramicrotome (Leica), using a diamond knife, and mounted on gold grids (200 mesh). To determine the size of the Wt and transformed chloroplast granum, a minimum of 50 chloroplasts of each type of plant were examined.
2.7.2. Subcellular Immunolocalisation
Rice leaf slices were fixed with 4% paraformaldehyde and 0.5% glutaraldehyde in 0.1 M phosphate buffer (pH 7.4) for 2 h at 4˚C. After washing, samples were dehydrated through an ethanol series and embedded in Lowicryl K4M resin (Pelco International, Redding, Calif., USA) at –35˚C. Blocks were polymerised under a UV lamp at –20˚C for 24 h and ultrathin sections were mounted on gold grids. The PAB/18QA antibody was used in a 1:200 dilution and the AbH in a 1:1000 dilution; the gold-affinipure anti-mouse IgG and anti-chicken IgY secondary antibodies were used at the same dilutions as in the western blot experiments. Control samples were treated only with blocking solution or pre-immune serum following the same protocol. The sections were examined under a Jeol-JEM-1010 transmission electron microscope at 80 kV.
2.8. Real Time PCR
2.8.1. RNA Extraction and cDNA Synthesis
The leaves of three biological replicates with six plants each were pooled to isolate total RNA using the Trizol reagent (Invitrogen), according to the manufacturer’s protocol. RNA integrity was checked using the 2100 Bioanalyzer (Agilent platform). The cDNA was synthesised from 2 μg of total RNA using the High Capacity cDNA Reverse Transcription Kit (Applied Biosystems) according to the manufacturer's instructions.
2.8.2. Design of qRT-PCR Primers
The potential reference gene was chosen based on published data for rice and other plant species. The gene model used was actin1 (Os05g36290). With respect to the tgzt cDNA sequence, a region close to 3’ terminal and 5’ initial was chosen for primer design, using the Primer express program. The following primers were used:
tgzFw: CAG CGG TGC AGC TAC GAA C tgzRv: GGC TGA ACT TGC CCA GTA GG act1Fw: ATC CTT GTA TGC TAG CGG TCG A act1Rv: ATC CAA CCG GAG GAT AGC ATG
2.8.3. Quantitative RT-PCR Conditions and Analysis
The quantitative RT-PCR reaction was in 20 µl mastermix with the following reaction components: 10 µl LightCycler 480 SYBR Green I Master (Roche Diagnostics), 0.8 µl forward primer (10 µM), 0.8 µl reverse primer (10 µM), 6.4 µl water and 2 µl cDNA (50 ng). The LightCycler experimental run protocol used was: polymerase activation programme (95˚C for 10 min); amplification and quantification programme repeated 40 times (95˚C for 10 s, 60˚C for 30 s with a single fluorescent reading measurement); melting curve programme (65˚C - 95˚C with a heating rate of 0.1˚C) to confirm the specificity of amplification and lack of primer-dimers, and finally a cooling step, to 40˚C. Each assay included (in triplicate) a standard curve of four serial dilution points (ranging from 200 ng to 3125 ng) for efficiency determination. Results showed high real-time PCR efficiency rates. The raw PCR data from LightCycler software 1.5.0 were used in the analysis. Amplification curves were analysed using the second derivative maximum method. Crossing points (Cp; point at which the fluorescence rises appreciably above the background fluorescence) were determined for each curve. Specificity of qPCR products were checked by melting curve profiles. No primer-dimers were generated and the product was unique and specific for each amplicon. Real-time PCR efficiencies were calculated from the given slopes using the LightCycler software. The investigated transcripts showed high realtime PCR efficiency rates of 2. Relative quantification was performed using the results of triplicates of the target versus the calibrator gene. The target gene was corrected via the reference-gene expression and calculated on the basis of the median of the triplicates. The data were analysed using ΔCT (CT, TARGET minus CT, REF).
2.9. TGase Activity
TGase activity in the presence of 0.6 mM cold Put and 185 kBq [1,4(n)-3H] Put (specific activity 962 GBq/mmol) was determined in protein extracts of tgz-transformed and wild-type rice leaves. The light conditions during the assays were the same as those during sample collection and the incubation mixture was adjusted to pH 8.0. The enzyme mixture was as described previously (Villalobos, et al., 2001). After 30 min incubation at 30˚C, the reaction was blocked by adding 10% TCA containing 5 mM unlabelled Put. Samples were repeatedly precipitated and the radioactivity was measured in a scintillation counter (Beckman LS 6000 SC, Fullerton, CA) as previously described [4].
2.10. Sequence Databases
The ChloroP and TargetP (CBS, Denmark) (http://www.cbs.dtu.dk/services) databases were consulted to identify the putative presence of a chloroplast signal peptide in the chlTGZ sequence.
3. RESULTS AND DISCUSSION
3.1. Chloroplast Signal Peptide Prediction in the chlTGZ Sequence
When the maize plastidial TGase (chlTGZ) N-terminus sequence (100 aas) was analysed using the ChloroP database, a predicted cTP sequence length of 47 aas (cleavage site in Ala 48, see Figure 1) with a score of 0.537 was deduced. In this aa sequence, there are many generally defined cTP characteristics [18]; 1) at the N-terminus region there is a conserved Ala next to the initial Met and a Pro at the end (15th aa); 2) its total length is near the average length; 3) in the central domain there are hydroxylated residues, especially Ser; 4) the central domain also has a hydrophobic site (FAA) and many nonpolar amino acids; 5) the presence of an amphiphilic helix (polar and non-polar alternate regions) is also possible. Some common characteristics were further encountered when the cTP sequence of TGZ was compared with that of Rubisco and CAB (PSII type I) maize proteins, such as the MA common dipeptide and the SSR protein kinase-C phosphorylation site, present in almost all cTPs. However, some characteristics of the chlTGZ sequence are not in agreement with these predictions, i.e. the positive charge of the initial N-terminus sequence and the low NN-score of the first 11 aas. Owing to these observations, if the initial N-terminus 17-aa sequence (to the second Met) (Figure 3) was not introduced into the ChloroP

Figure 3. Amino acid sequence of the putative TGZ chloroplast signal peptide (47 aas, MW 5 kDa) determined using the ChloroP database. MA = common dipeptide. + = positively charged aa. – = negatively charged aa. . = non-charged aa. Unmarked = non-polar (hydrophobic) aa (in general in the centre of the sequence and possibly random coiled). In bold and Italics: sequence eliminated in the truncated TGZ. *A = putative cleavage site. Discontinuous rectangle = serine protease domain. SSR = protein kinase C-phosphorylation site, present in almost all the cTPs. FAA = hydrophobic site. SSTLE = casein kinase II-phosphorylation site. Predominant aas: Ser, 17%; Leu, 17%; Ala, 10.6%.
programme, no cTP prediction was obtained for the truncated chlTGZ sequence. In contrast, when the chlTGZ N-terminus sequence (100 aas) was analysed using the TargetP database, a TPlen of 40 aas was predicted. If non cut-off restrictions are selected, the predicted localisation is in mitochondria, but with an RC of 4 (measure of the size difference between the highest and the second highest output scores). In this program, there are 5 RC reliability classes, the lower the value of RC the safer the prediction. If a cut-off specificity higher than 0.95 is selected, non-specific localisation was predicted. This means that, probably, the deletion in the first part of the N-terminus sequence must have important information about the presence and characteristics of a cTP in the complete chlTGZ sequence.
3.2. Identification of F3 Transformed Plants
Owing to the level of homology between maize and rice DNA (Villalobos, et al., 2004), correct primer design was very important. The primers used were efficient in distinguishing between transformed and non-transformed plants. Of the 110 herbicide-resistant F3 plants obtained (Figure 4), 12 plants from 11 different transformed lines were PCR-analysed and all were positive with respect to the insert presence. The presence of the 371 bp insert only in the transformed F3 and not in the Wt plants is shown in Figure 5. In tobacco plants over-expressing chlTGZ in the chloroplasts, many phenotypic and physiological characteristics have been shown to be significantly altered [12,34]. In contrast, none of the tgz-transformed rice plants had different phenotypic characteristics (seed germination, plant size, leaf colour, organ development and fertility, and water stress resistance) with respect to wild type plants.
3.3. Immunoblot Experiments
Immunoblot of total leaf protein extracts indicated that the plant TGase generic antibody (AbH) (Figure 4(a)) detected the presence of a TGase not only in transformed (Figure 6(a), plants 1, 3 and 6) but also in Wt plants,
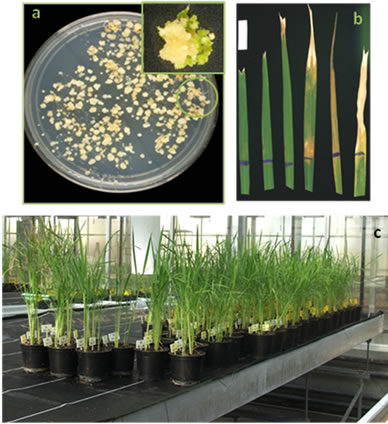
Figure 4. Selection of rice tgzt-transformed plants. (a) callus induction in selective medium. Inside: plant regeneration from a selected callus (encircled); (b) Glyphosate selection process realized from F0 to F3 plants: leaves proceeding from different regenerated plants and treated with glyphosate, indicating the grade of resistance (from right to left); (c) F3 selected plants growing in the greenhouse.
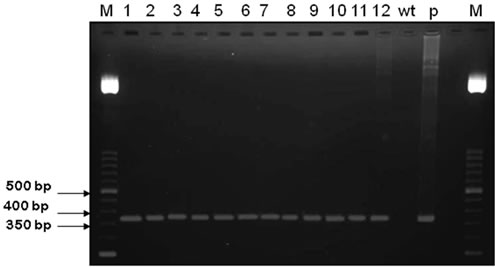
Figure 5. PCR amplification of a 371 bp insert in 12 rice tgzt-transformed F3 plants (1 - 12). wt: wild type plant; p: plasmid used for transformation (pGreen + tgzt); M: lambda EcoRV/HindIII marker.
indicating that a similar TGase may exist in rice. The revealed bands of 58 kDa and 120 kDa were detected previously by Villalobos et al. [6] in regenerating rice
 (a)
(a) (b)
(b) (c)
(c)
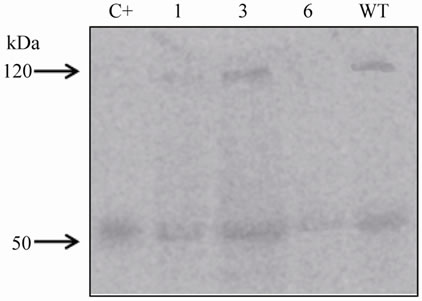
Figure 6. Immunoblot analysis of tgz-transformed and wild type (WT) rice leaf protein extracts. (a) AbH (1:10,000) detection; 1, 3 and 6, tgzt-transformed plants; (b) AbPAB/18QA (1:1000) detection in the same samples as in a; (c) AbPAB/18QA (1:1000) immunoblot of tgzt-transformed leaf protein extracts of rice plants grown under different continuous light periods (0, 2, 8, 12, 24 and 48 h); C+, positive control (TGZ purified protein).
Wt callus. Nevertheless, the use of the specific maize chlTGZ antibody (AbPAB/18QA) [11], showed a unique band of 58 kDa (the expected weight of chlTGZt)
in the tgz-transformed plants (Figure 6(b), plants 1, 3 and 6), and not in the Wt. The molecular weight of the positive control (TGZ purified protein) [9] obtained with the two antibodies was as expected (C+, Figures 6(a) and (b)). Based on these results, and taking into account the observed light-dependence of maize TGase activity [5,12], the behaviour of the chlTGZt protein in leaf protein extracts of tgzt-transformed rice plants submitted to different periods of continuous illumination was analysed. The results showed that, as in maize, there is a differential light-dependent expression of chlTGZ protein in rice (Figure 6(c)). In this case, two protein bands were obtained in the immunoblots of the tgz-transformed plants: a band of about 58 kDa that was highly expressed from zero to two hours of illumination and then decreased, and a 34 kDa band. This 34 kDa band increased up to eight hours of illumination, decreased between eight and 24 hours and de novo increased at 48 hours of continuous illumination. A 34 kDa TGase band related to LHCII antenna proteins had also been demonstrated by BN-SDS-PAGE in thylakoid maize extracts by our group [11]. A 39 kDa band with light-dependent TGase activity has also been detected in thylakoid maize extracts by other authors using antibodies against non-plant TGases [7]. These results presented here may indicate that, as in the case of maize, chlTGZt is modified in rice plants, from its native 58 kDa sequence, as a consequence of its light-dependent activity, which seems to be related to an internal daily rhythm, similar to that of its plastidial protein substrates in maize [3,13].
3.4. Confocal and TEM Microscopy chlTGZ Detection
Confocal microscopy using the TGZ-specific antibody allows us to differentiate between heterologous and endogenous TGase in the transformed rice plants. As shown in Figure 7, when the TGZ-specific AbPAB/18QA was used with the transformed rice cells, fluorescent dots around the chloroplasts were observed (Figure 7(a), arrows). Furthermore, when scanner cuts to the inner of the cell were realised (x/z projection), a clear signal around the cell wall was also observed, but only in the transformed cells (Figures 7(e) and (f)) and not in the Wt cells (Figure 7(c)), indicating that the maize specific antibody detects TGZ in the cell wall of the transformed plants. When the generic anti-TGase AbH was used with Wt and transformed cells (Figure 7(d) and insert), fluorescent dots around the chloroplasts were observed in both cases, but not in the cell walls, indicating that this antibody probably detects an endogenous rice TGase. Negative control treated with secondary antibody and pre-immune serum did not showed any protein signal (insert Figure 7(c)).
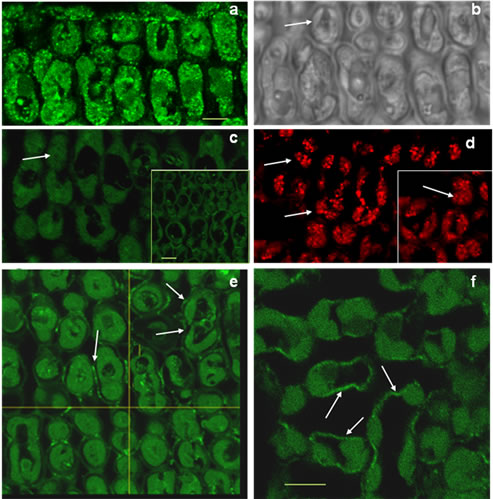
Figure 7. Confocal Microscopy fluorescence immunodetection of TGZ protein in transformed rice cells using AbPAB/18QA and AbH antibodies (see M & M). (a) general aspect of TGZ distribution in a transversal cut of leaf transformed cells treated with AbPAB/18QA; (b) a bright field image of “(a)” (arrows indicate chloroplasts); (c) detail of wild type scanned cells treated with AbPAB/18QA, no signal (arrow indicates chloroplasts), inside: tissue preparation treated only with the secondary antibody and immune serum, as negative control; (d) aspect of a wild type cell and a transformed cell (inside) immuno-treated with AbH, showing the signal bordering chloroplasts (arrows); (e) scanner x/z images and signal in the border of the cell (arrow) in transformed leaf cells; (f) detail of “(e)”. Scale bars: (a), (c) and (f) 5.6 µm.
To go deeper into TGZ cell localisation, ultra-structural TEM and subcellular immunolocalisation of the protein in rice transformed cells were realised. We have previously demonstrated that over-expression of chlTGZ in tobacco chloroplasts, using a plastidial promoter, resulted in chloroplasts having mainly double-size (height) grana with respect to the Wt chloroplasts. In general, grana interconnections of these tobacco chloroplasts were rare, and stromal thylakoids scarce, short and swollen [12,34]. In contrast, TEM observations of the tgzttransformed rice cells (in the present work), showed that chloroplast grana apparatus, granal interconnections and stromal thylakoids do not differ from that of the Wt (Figures 8(a) and (b)), indicating that the transgenic chlTGZt protein did not alter the rice chloroplasts. When AbH (the generic anti-TGase antibody) was used, the protein signal was subcellularly immunolocalised in the grana chloroplasts of transformed and Wt plants (Figures 8(c) and (d)), confirming the confocal microscopy data, and demonstrating the presence in the chloroplasts of a putative endogenous rice TGase. However, when AbPAB/18QA (the anti-TGZ specific antibody) was applied to the transformed cells, a specific protein signal in the cell walls (particularly of the vascular bundle cells), was obtained, although signal in the vacuole was also observed (Figures 9(a) and (b)). Using this TGZ-specific antibody, the signal in the chloroplasts of the tgzt transformed plants was practically absent (Figure 9(c)). The obtained results showed once more that chlTGZt was localised out of the rice chloroplasts.
3.5. TGase Activity of the Transformed Plants
With respect to in vitro TGase activity of total plant protein extracts, Figure 8(a) shows that, although Wt rice plants have endogenous TGase activity, the activity of the tgz-transformed rice plants (Figure 10(a), plants 1, 3 and 6) was significantly higher, being more than double that of the Wt plants, in the case of plants 1 and 6. Furthermore, there was no measureable TGase activity in dark conditions, indicating that, both in transformed and in Wt plants, this activity was light dependent, as we have previously detected in other cases [5,9-11,13]. Furthermore, the activity of transformed plants measured in the in vitro assays (where its specific substrates are present) indicated that the TGZ protein, although truncated in the transit peptide region and not present in its original subcellular location, is in its active form.
Nevertheless, the highest in vitro activity detected is not sufficient to explain the action of chlTGZt expression in the transformed plants. The absence of phenotypic differences in these plants with respect to the wild type indicates that, probably due to the extra-chloroplast location of the protein, no essential functions had been altered in the transformants. Further research on other possible endogenous modifications needs to be carried out.
3.6. Analysis of tgz Transcription Levels in Rice tgz-Transgenic Plants Grown with Different Illumination Periods
To confirm the results obtained, as tgz expression and protein activity in maize have been demonstrated to be light-dependent [5,9,12], the specific tgzt transcription level in the transformed rice plants with respect to different continuous illumination periods was analysed. As shown in Figure 10(b), there is, in effect, an increment in the tgzt mRNA transcription level after 2 h, 12 h and 24 h continuous illumination and a decrease at 8h illumination. These results agree with those obtained with western blotting (see above), and seem to be related to an internal daily rhythm. A significant TGZ mRNA increase after 2 h of light exposition in maize plants growing under similar light periods had been observed previously by our group [5]. In spite of the low obtained values of TGZ
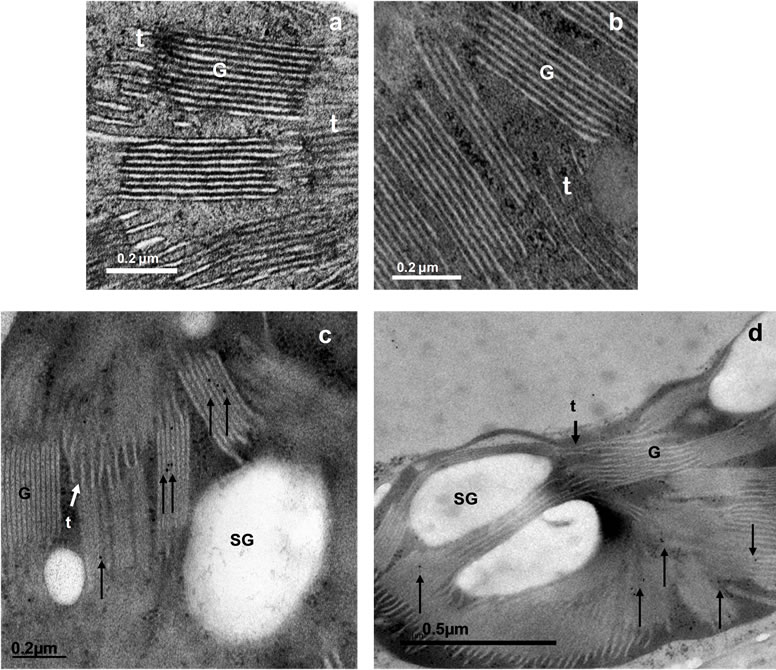
Figure 8. Grana aspect and TGase immunolocalization in tgzt-transformed and WTrice chloroplasts. (a) and (b), grana and thylakoids of a tgzt-transformed and a wild type chloroplast cell, respectively; (c) and (d), sub-cellular immunolocalisation, using AbH (1:1000), of a TGase in a chloroplast of tgz-transformed and wild type rice cells, respectively. G: grana; t: thylakoids; SG: starch grain. Black arrows indicate protein presence.
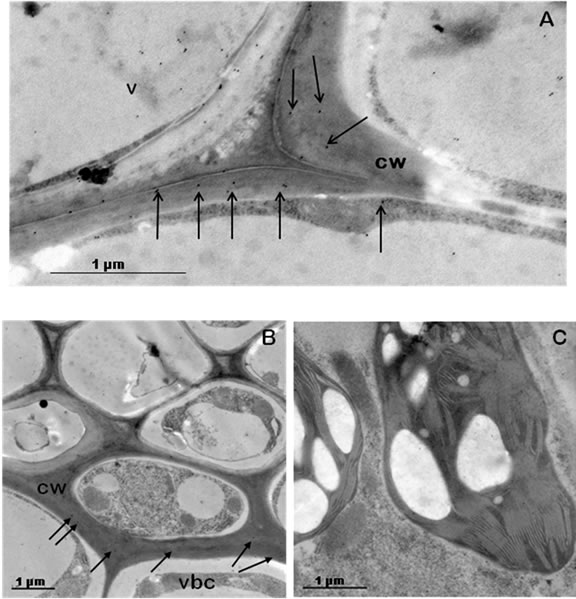
Figure 9. AbPAB/18QA (1:1000) TGZ immunolocalisation in tgzt-transformed rice cells. (a) and (b), TGZ protein abundance in the cell walls; (c) chloroplast of a tgzt-transformed rice cell, non-significant signal. v: vacuole; vbc: vascular bundle cell; cw: cell wall. Black arrows indicate TGZ presence.
mRNA expression in tgz-transformed rice plants, the protein maintains a similar expression mode as in maize. Some factors can modify the protein abundance as the specific protein function and the subcellular location. In general, a TGase excess can disturb the cellular physiological homeostasis, however the TGZ effect in other subcellular places is unknown.
4. CONCLUSION
The results obtained here demonstrate that the initial 17 aas eliminated from the N-terminus region of the complete maize chlTGZ sequence, although not predictable in all databases, are necessary for chloroplast targeting. Consequently, these results reinforce the validity of the chlTGZ-cTP sequence prediction data obtained from ChloroP databases, indicating that it corresponds to a transit peptide in the maize protein. In addition, the heterologous expression of truncated-chlTGZ maintains its activity characteristics, although the protein is not located in its original plastidal compartment, indicating that the protein is in its active form. These data reinforce the results obtained by our group with chlTGZ over-expression in other organisms (such as tobacco and E. coli), especially on light-dependent activity and protein modi-
 (a)
(a)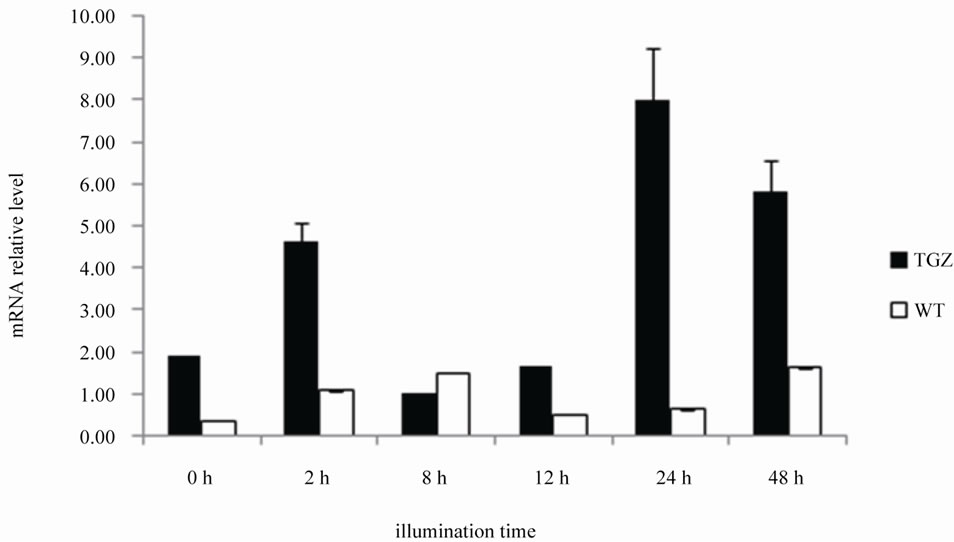 (b)
(b)
Figure 10. TGZ expression in rice transformed plants. (a) TGase activity (pmols Put/mg prot/h) in leaf protein extracts of tgzt-transformed and wild type F3 plants. 1, 3 and 6, tgz-transformed plants; WT: wild type plant; (b) Relative levels of tgz mRNA from tgzt-transformed F3 and WT plants growing on different continuous illumination periods (0, 2, 8, 12, 24 and 48 h), as calculated after normalization against the treatment given the highest expression level (24 h). Actine (no diferences in the mRNA expression) was used as reference gene. P < 0.05 values are mean ± SE of three replicates.
fications. Our results may also contribute to investigate further into the role of chloroplastic TGase and its relationship with cell membranes, especially thylakoids and stacking mechanism in plants. Finally, this study has permitted us to deep into an initial knowledge of rice TGase, localized here into the rice cells. Further studies on the cloning and functionality of the endogenous rice TGase are in progress.
5. ACKNOWLEDGEMENTS
This study was supported by the Spanish projects MEC BFU2006- 15115-01/BMC and BFU2009-08575. N. Campos has a pre-doctoral fellowship from the Agencia Española de Cooperación Internacional (AECI). The authors would especially like to thank M. Amenós (CRAG Microscopy Services), Oriol Casagran (CRAG Genomic Services), N. Cortadellas (Serveis Cientifico-Tècnics, UB), and the CRAG Greenhouse Services for their technical assistance and S. Burgess for the English correction. The authors would also like to thank the Spanish Ministry of Science and Innovation, Consolider-Ingenio 2010 Programme. CSD2007-00036 “CRAG” and the Xarxa de Referencia en Biotecnologia of the Generalitat de Catalunya.
REFERENCES
- Lorand, L. and Graham R.M. (2003) Transglutaminases: cross linking enzymes with pleiotropic functions. Nature Review in Molecular Cell Biolog, 4, 140-156. doi:10.1038/nrm1014
- Del Duca, S., Tidu, V., Bassi, R., Esposito, C. and SerafiniFracassini, D. (1994) Identification of chlorophyll-a/b proteins as substrates of transglutaminase activity in isolated chloroplasts of Helianthus tuberosus L. Planta, 193, 282-289.
- Bernet, E., Claparols, I., Dondini, L., Santos, M.A., Serafini-Fracassini, D. and Torné, J.M. (1999) Changes in polyamine content, arginine and ornithine decarboxylases and transglutaminase activities during light/dark phases (of initial differentiation) in maize calluses and their chloroplasts. Plant Physiology and Biochemistry, 37, 899-909. doi:10.1016/S0981-9428(99)00104-7
- Villalobos, E., Torné, J.M., Rigau, J., Olles, I., Claparols, I. and Santos, M. (2001) Immunogold localization of a transglutaminase related to grana development in different maize cell types. Protoplasma, 216, 155-163. doi:10.1007/BF02673867
- Villalobos, E., Santos, M., Talavera, D., Rodríguez-Falcón, M. and Torné, J.M. (2004) Molecular cloning and characterization of a maize transglutaminase complementary DNA. Gene, 336, 93-104. doi:10.1016/j.gene.2004.03.025
- Villalobos, E. (2007) Study of maize (Zea mays L.) plant transglutaminases. Ph.D. Thesis, University of Barcelona, Barcelona.
- Della Mea, M., Di Sandro, A., Dondini, L., Del Duca, S., Vantini, F., Bergamini, C., Bassi, R. and Serafini-Fracassini, D. (2004) A Zea mays 39-kDa thylakoid transglutaminase catalyses the modification by polyamines of light-harvesting complex II in a light-dependent way. Planta, 219, 754-764. doi:10.1007/s00425-004-1278-6
- Torné, J.M., Santos, M.A., Talavera, D. and Villalobos, E. (2002) Maize nucleotide sequence coding for a protein with transglutaminase activity and use thereof.
- Carvajal-Vallejos, P.K., Campos, A., Fuentes-Prior, P., Villalobos, E., Almeida, A.M., Barberá E., Torné, J.M. and Santos, M. (2007) Purification and in vitro refolding of maize chloroplast transglutaminase over-expressed in Escherichia coli. Biotechnology Letters, 29, 1255-1262. doi:10.1007/s10529-007-9377-7
- Carvajal, P., Gibert, J., Campos, N., Lopera, O., Barberá, E., Torné, J.M. and Santos, M. (2011) Activity of maize transglutaminase over-expressed in Escherichia coli inclusion bodies: an alternative to protein refolding. Biotechnology Progress, 27, 232-240. doi:10.1002/btpr.538
- Campos, A., Carvajal-Vallejos, P.K., Villalobos, E., Franco, C.F., Almeida, A.M., Coelho, A.V., Torné, J.M. and Santos, M. (2010) Characterization of Zea mays L. plastidial transglutaminase: interactions with thylakoid membrane proteins. Plant Biololgy, 12, 712-716. doi:10.1111/j.1438-8677.2009.00280.x
- Ioannidis, N. Ortigosa, S.M., Veramendi, J., Pinto-Marijuan, M., Fleck, I., Carvajal, P., Kotzabasis, K., Santos, M. and Torné, J.M. (2009) Remodeling of tobacco thylakoids by over-expression of maize plastidial transglutaminase, Biochimica et Biophysica Acta, 1787, 1215-1222.
- Pintó-Marijuan, M., de Agazio, M., Zacchini, M., Santos, M.A., Torné, J.M. and Fleck, I. (2007) Response of transglutaminase activity and bound putrescine to changes in light intensity under natural and controlled conditions in Quercus ilex leaves, Physiologia Plantarum, 131, 159- 169. doi:10.1111/j.1399-3054.2007.00939.x
- Nair, R. and Rost, B. (2002) Sequence conserved for sub cellular localization. Protein Science, 11, 2836-2847. doi:10.1110/ps.0207402
- McGinnis, S. and Madden, T.L. (2004) BLAST: at the core of a powerful and diverse set of sequence analysis tools. Nucleic Acids Research, 32, 20-25. doi:10.1093/nar/gkh435
- Yu, C.S., Chen, Y.C., Lu, C.H. and Hwang, J.K. (2006) Prediction of protein subcellular localization. Proteins, 64, 643-651. doi:10.1002/prot.21018
- Chou, K.C. and Shen H.B. (2006) Hum-PLoc: a novel ensemble classifier for predicting human protein subcellular localization. Biochemistry and Biophysics Research Communications, 347, 150-157. doi:10.1016/j.bbrc.2006.06.059
- Keegstra, K., Olsen, L.J. and Theg, S.M. (1989) Chloroplastic precursors and their transport across the envelope membranes. Annual Review Plant Physiology and Plant Molecular Biology, 40, 471-501.
- Emanuelsson, O., Nielsen, H. and von Heijne, G. (1999) ChloroP, a neural network-based method for predicting chloroplast transit peptides and their cleavage sites. Protein Science, 8, 978-984. doi:10.1110/ps.8.5.978
- Emanuelsson O., von Heijne G. and Schneider G. (2001) Analysis and prediction of mitochondrial targeting peptides. Methods Cell Biology, 65, 175-187. doi:10.1016/S0091-679X(01)65011-8
- Emanuelsson, O., Brunak, S., von Heijne, G. and Nielsen, R. (2007) Locating proteins in the cell using TargetP, SignalP, and related tools. Nature Protocols, 2, 953-971. doi:10.1038/nprot.2007.131
- Kleffmann, T., Russenberger, D., von Zychlinski, A., Christopher, W., Sjölander, K., Grissem, W. and Baginsky, S. (2004) The Arabidopsis thaliana chloroplast proteome reveals pathway abundance and novel protein functions. Current Biology, 14, 354-362. doi:10.1016/j.cub.2004.02.039
- Millar, H., Whelan, J. and Small, I. (2006). Recent surprises in protein targeting to mitochondria and plastids. Current Opinion in Plant Biology, 9, 610-615. doi:10.1016/j.pbi.2006.09.002
- Small, I., Peeters, N., Legeai, F. and Lurin, C. (2004) Predotar: a tool for rapidly screening proteomes for N-terminal targeting sequences. Proteomics, 4, 1581- 1590. doi:10.1002/pmic.200300776
- Nair R. and Rost, B. (2005) Mimicking cellular sorting improves prediction of subcellular localization. Journal of Molecular Biology, 348, 85-100. doi:10.1016/j.jmb.2005.02.025
- Hoglund, A., Donnes, P., Blum,T., Adolph, H.W. and Kohlbacher, O. (2006), MultiLoc: prediction of protein subcellular localization using N-terminal targeting sequences, sequence motifs and amino acid composition. Bioinformatics, 22, 1158-1165. doi:10.1093/bioinformatics/btl002
- Hellens, R.P., Edwards, E.A., Leyland, N.R., Bean, S. and Mullineaux, Ph.M. (2000) pGreen: a versatile and flexible binary Ti vector for Agrobacterium-mediated plant transformation. PlantMolecularBiology, 42, 819- 832. doi:10.1023/A:1006496308160
- Hellens, R., Mullineaux, Ph. and Klee, H. (2000) A guide to Agrobacterium binary Ti vectors. Trends in Plant Science, 5, 446-451.
- Chu, C.C., Wang, C.C., Sun, C.S., Hsu, C., Yin, K.C., Chu, C.Y. and Bi, F.Y. (1975) Particle bombardment of Hi II immature zygotic embryos and recovery of transgenic maize plants. Sciencia Sinica, 18, 659-668.
- Ohira, K., Ojima, K. and Fujiwara, A. (1973) Studies on the nutrition of rice cell culture I. A simple, defined medium for rapid growth in suspension culture. Plant Cell Physiology, 14, 1113-1121.
- Gamborg, O.L. Miller, R. and Ojima, K. (1968) Nutrient requirements of suspension cultures of soybean root cells. Experimental Cell Research, 50, 151-158. doi:10.1016/0014-4827(68)90403-5
- Murashige, T. and Skoog, F.A. (1962) A revised medium for rapid growth and bio assays with tobacco tissue cultures. Physiologia Plantarum, 15, 473-497. doi:10.1111/j.1399-3054.1962.tb08052.x
- Laemmli, U.K. (1970) Cleavage of structural proteins during the assembly of the head of bacteriophage T4. Nature, 227, 680-685. doi:10.1038/227680a0
- Ortigosa, S.M. Díaz-Vivancos, P., Clemente-Moreno, M.J., Pintó-Marijuan, M., Fleck, I., Veramendi, J., Santos, M., Hernandez, J.A. and Torné, J.M. (2010) Oxidative stress induced in tobacco leaves by chloroplast over-expression of maize plastidial transglutaminase. Planta, 232, 593-605. doi:10.1007/s00425-010-1185-y
NOTES
*Corresponding author.