 Pharmacology & Pharmacy, 2011, 2, 271-281 doi:10.4236/pp.2011.24035 Published Online October 2011 (http://www.SciRP.org/journal/pp) Copyright © 2011 SciRes. PP 271 Modeling of the Interaction of Flavanoids with GABA (A) Receptor Using PRECLAV (Property-Evaluation by Class Variables) Vijay K. Agrawal1, Basheerulla Shaik1, Padmakar V. Khadikar1, Shalini Singh2 1Department of Applied Sciences, National Institute of Technical Teachers’ Training & Research, Bhopal, India; 2Depatment of Chemistry, Bareily College, Bareily, India. Email: basheerulla.81@gmail.com, pvkhadikar@rediffmail.com, shalinisingh_15@yahoo.com, apsvka@yahoo.co.in Received April 28th, 2011; revised August 17th, 2011; accepted September 20th, 2011. ABSTRACT Quantitative Structure-Activity Relationship (2D-QSAR) models for binding affinity constants (log Ki) of 78 flavanoid ligands towards the benzodiazepine site of GABA (A) receptor complex were estimated using the PRECLAV (Prop- erty-Evaluation by Class Variables) program. The best MLR equation with nine PRECLAV descriptors has R2 = 0.843 and C = 0.782. Attempt is also made for obtaining 2D-QSAR model using NCSS software. The comparison of the results indicated that the PRECLAV method is very efficient in detecting structure-activity correlation with good pre- dictive power. 2 R Keywords: PRECLAV, NCSS, Regression Analysis, Cross-Validation, GABA, Flavanoids 1. Introduction During the last two decades quantitative structure-activ- ity relationship (2D-QSAR) models have gained exten- sive recognition in drug design [1]. The widespread use of 2D-QSAR models come from the development of novel structural descriptors and statistical equations re- lating activity with chemical structure. The main hy- pothesis in the 2D-QSAR approach is that all biological activity of a chemical substance is statistically related to its molecular structure. The PRECLAV program uses the atom in the common skelton to compute bond and field (grid) descriptors [2,3]. The PRECLAV program com- putes five classes of structural descriptors: Constitutional, topological indices, molecular graph invariants, geomet- rical, quantum bond indices and field (grid) descriptors [2-4]. All molecules are aligned by superimposing the com- mon atom before generating the multiple linear regres- sion models; PRECLAV makes a descriptor selection by discarding those descriptors that are poorly correlated with the investigated activity. During last decade more than 400 chemically unique flavonoids (phenyl-benzopyrans) have been isolated from vascular plants and many of them are used as tranquiliz- ers in folkloric medicine. Such type of compounds are important constituents of the human diet, being derived largely from fruits and vegetables, nuts, seeds, stems and flowers and thus constitute one of the important classes of the metabolites. Some of the compounds from fla- vones family exhibit a potent in vivo anxiolitic activity, and do not involve unwanted side effect. As a result of this several attempts have been made to generate syn- thetic flavones derivatives with higher affinities for the GABA (A) receptor [5-10]. Subsequently, attempts were also made to establish quantitative structure-activity rela- tionship so as to establish a 2D-QSAR model for inhibi- tion of GABA (A) receptor that could serve as a guide for the rational design of further potent and selective in- hibition having the flavones backbone [11-13]. One such attempt was recently made by Duchowiz and co workers [14-16]. They have proposed the best linear model for a set of 70 flavones and found that the best model involves four correlating descriptors with statistical quality given by R2 = 0.7174, Se = 0.580, = 0.6757, SLOO = 0.622. 2 LOO R It was observed that out of several available software’s such as COMFA [17], CORBA [18], OASIS [19], CODESSA [20], TSAR [21], PRECLAV [2,3], etc. The PRECLAV software is very efficient in detecting struc- 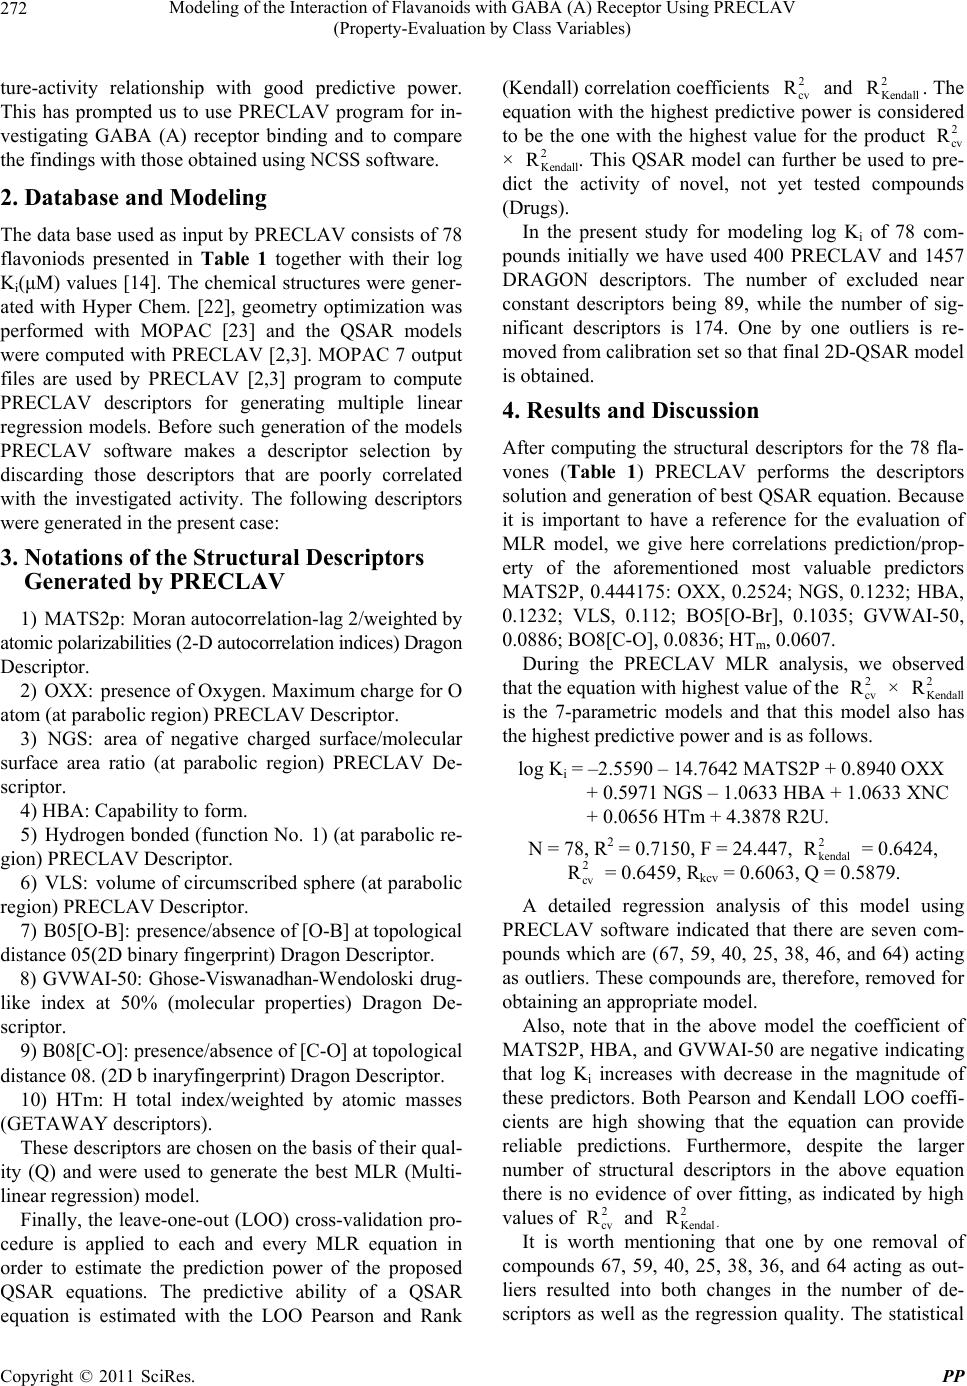 Modeling of the Interaction of Flavanoids with GABA (A) Receptor Using PRECLAV 272 (Property-Evaluation by Class Variables) ture-activity relationship with good predictive power. This has prompted us to use PRECLAV program for in- vestigating GABA (A) receptor binding and to compare the findings with those obtained using NCSS software. 2. Database and Modeling The data base used as input by PRECLAV consists of 78 flavoniods presented in Table 1 together with their log Ki(μM) values [14]. The chemical structures were gener- ated with Hyper Chem. [22], geometry optimization was performed with MOPAC [23] and the QSAR models were computed with PRECLAV [2,3]. MOPAC 7 output files are used by PRECLAV [2,3] program to compute PRECLAV descriptors for generating multiple linear regression models. Before such generation of the models PRECLAV software makes a descriptor selection by discarding those descriptors that are poorly correlated with the investigated activity. The following descriptors were generated in the present case: 3. Notations of the Structural Descriptors Generated by PRECLAV 1) MATS2p: Moran autocorrelation-lag 2/weighted by atomic polarizabilities (2-D autocorrelation indices) Dragon Descriptor. 2) OXX: presence of Oxygen. Maximum charge for O atom (at parabolic region) PRECLAV Descriptor. 3) NGS: area of negative charged surface/molecular surface area ratio (at parabolic region) PRECLAV De- scriptor. 4) HBA: Capability to form. 5) Hydrogen bonded (function No. 1) (at parabolic re- gion) PRECLAV Descriptor. 6) VLS: volume of circumscribed sphere (at parabolic region) PRECLAV Descriptor. 7) B05[O-B]: presence/absence of [O-B] at topological distance 05(2D binary fingerprint) Dragon Descriptor. 8) GVWAI-50: Ghose-Viswanadhan-Wendoloski drug- like index at 50% (molecular properties) Dragon De- scriptor. 9) B08[C-O]: presence/absence of [C-O] at topological distance 08. (2D b inaryfingerprint) Dragon Descriptor. 10) HTm: H total index/weighted by atomic masses (GETAWAY descriptors). These descriptors are chosen on the basis of their qual- ity (Q) and were used to generate the best MLR (Multi- linear regression) model. Finally, the leave-one-out (LOO) cross-validation pro- cedure is applied to each and every MLR equation in order to estimate the prediction power of the proposed QSAR equations. The predictive ability of a QSAR equation is estimated with the LOO Pearson and Rank (Kendall) correlation coefficients and . The equation with the highest predictive power is considered to be the one with the highest value for the product × . This QSAR model can further be used to pre- dict the activity of novel, not yet tested compounds (Drugs). 2 cv R2 Kendall R 2 cv R 2 Kendall R In the present study for modeling log Ki of 78 com- pounds initially we have used 400 PRECLAV and 1457 DRAGON descriptors. The number of excluded near constant descriptors being 89, while the number of sig- nificant descriptors is 174. One by one outliers is re- moved from calibration set so that final 2D-QSAR model is obtained. 4. Results and Discussion After computing the structural descriptors for the 78 fla- vones (Table 1) PRECLAV performs the descriptors solution and generation of best QSAR equation. Because it is important to have a reference for the evaluation of MLR model, we give here correlations prediction/prop- erty of the aforementioned most valuable predictors MATS2P, 0.444175: OXX, 0.2524; NGS, 0.1232; HBA, 0.1232; VLS, 0.112; BO5[O-Br], 0.1035; GVWAI-50, 0.0886; BO8[C-O], 0.0836; HTm, 0.0607. During the PRECLAV MLR analysis, we observed that the equation with highest value of the × is the 7-parametric models and that this model also has the highest predictive power and is as follows. 2 cv R2 Kendall R log Ki = –2.5590 – 14.7642 MATS2P + 0.8940 OXX + 0.5971 NGS – 1.0633 HBA + 1.0633 XNC + 0.0656 HTm + 4.3878 R2U. N = 78, R2 = 0.7150, F = 24.447, = 0.6424, = 0.6459, Rkcv = 0.6063, Q = 0.5879. 2 kendal R 2 cv R A detailed regression analysis of this model using PRECLAV software indicated that there are seven com- pounds which are (67, 59, 40, 25, 38, 46, and 64) acting as outliers. These compounds are, therefore, removed for obtaining an appropriate model. Also, note that in the above model the coefficient of MATS2P, HBA, and GVWAI-50 are negative indicating that log Ki increases with decrease in the magnitude of these predictors. Both Pearson and Kendall LOO coeffi- cients are high showing that the equation can provide reliable predictions. Furthermore, despite the larger number of structural descriptors in the above equation there is no evidence of over fitting, as indicated by high values of and . 2 cv R2 Kendal R It is worth mentioning that one by one removal of compounds 67, 59, 40, 25, 38, 36, and 64 acting as out- liers resulted into both changes in the number of de- scriptors as well as the regression quality. The statistical Copyright © 2011 SciRes. PP 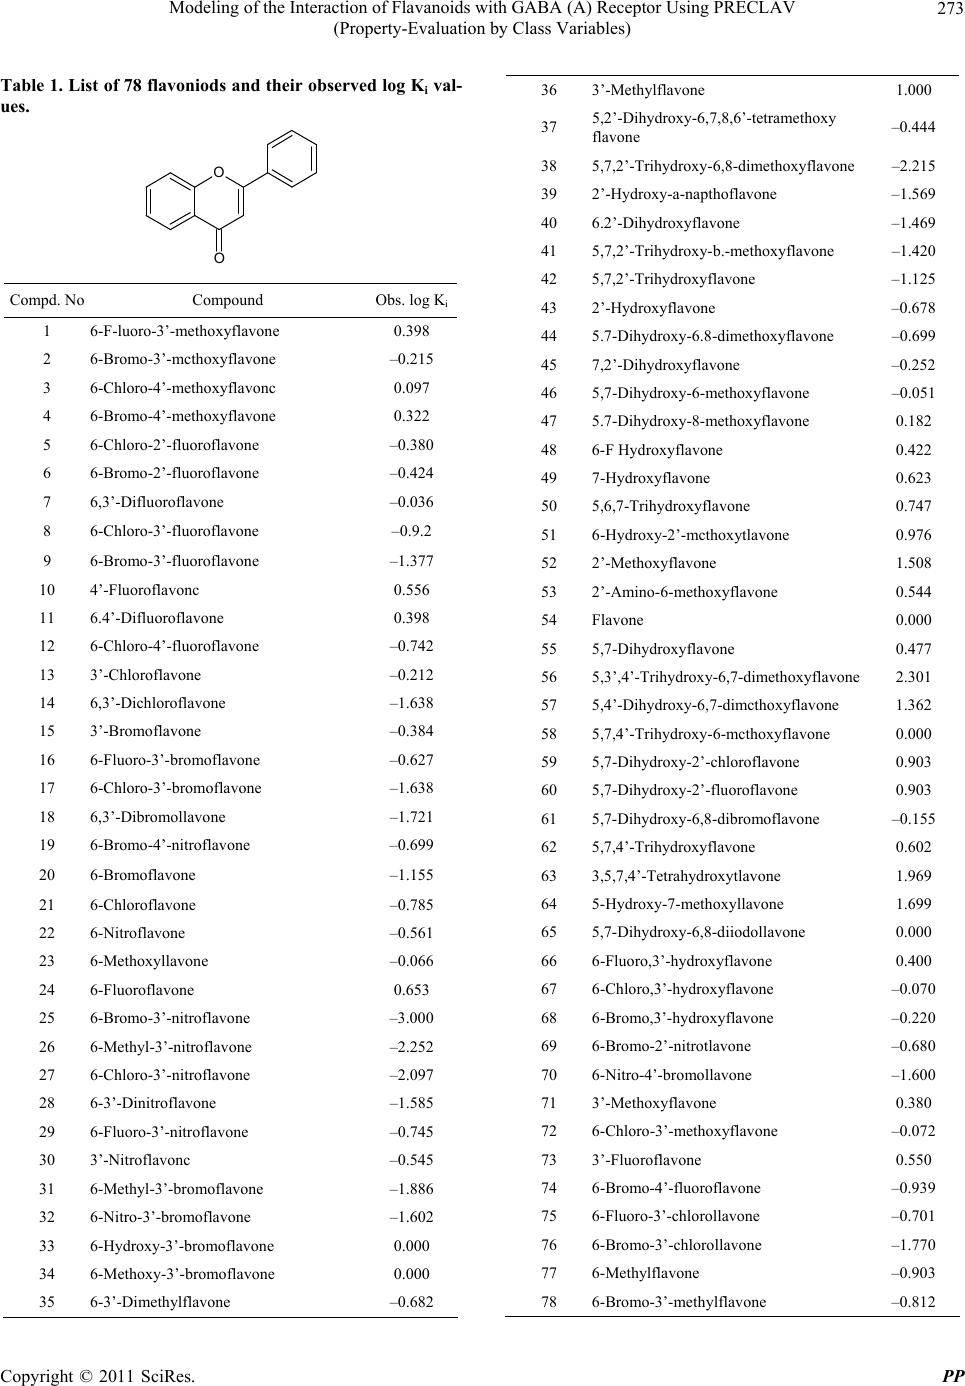 Modeling of the Interaction of Flavanoids with GABA (A) Receptor Using PRECLAV 273 (Property-Evaluation by Class Variables) Table 1. List of 78 flavoniods and their observed log Ki val- ues. O O Compd. No Compound Obs. log Ki 1 6-F-luoro-3’-methoxyflavone 0.398 2 6-Bromo-3’-mcthoxyflavone –0.215 3 6-Chloro-4’-methoxyflavonc 0.097 4 6-Bromo-4’-methoxyflavone 0.322 5 6-Chloro-2’-fluoroflavone –0.380 6 6-Bromo-2’-fluoroflavone –0.424 7 6,3’-Difluoroflavone –0.036 8 6-Chloro-3’-fluoroflavone –0.9.2 9 6-Bromo-3’-fluoroflavone –1.377 10 4’-Fluoroflavonc 0.556 11 6.4’-Difluoroflavone 0.398 12 6-Chloro-4’-fluoroflavone –0.742 13 3’-Chloroflavone –0.212 14 6,3’-Dichloroflavone –1.638 15 3’-Bromoflavone –0.384 16 6-Fluoro-3’-bromoflavone –0.627 17 6-Chloro-3’-bromoflavone –1.638 18 6,3’-Dibromollavone –1.721 19 6-Bromo-4’-nitroflavone –0.699 20 6-Bromoflavone –1.155 21 6-Chloroflavone –0.785 22 6-Nitroflavone –0.561 23 6-Methoxyllavone –0.066 24 6-Fluoroflavone 0.653 25 6-Bromo-3’-nitroflavone –3.000 26 6-Methyl-3’-nitroflavone –2.252 27 6-Chloro-3’-nitroflavone –2.097 28 6-3’-Dinitroflavone –1.585 29 6-Fluoro-3’-nitroflavone –0.745 30 3’-Nitroflavonc –0.545 31 6-Methyl-3’-bromoflavone –1.886 32 6-Nitro-3’-bromoflavone –1.602 33 6-Hydroxy-3’-bromoflavone 0.000 34 6-Methoxy-3’-bromoflavone 0.000 35 6-3’-Dimethylflavone –0.682 36 3’-Methylflavone 1.000 37 5,2’-Dihydroxy-6,7,8,6’-tetramethoxy flavone –0.444 38 5,7,2’-Trihydroxy-6,8-dimethoxyflavone –2.215 39 2’-Hydroxy-a-napthoflavone –1.569 40 6.2’-Dihydroxyflavone –1.469 41 5,7,2’-Trihydroxy-b.-methoxyflavone –1.420 42 5,7,2’-Trihydroxyflavone –1.125 43 2’-Hydroxyflavone –0.678 44 5.7-Dihydroxy-6.8-dimethoxyflavone –0.699 45 7,2’-Dihydroxyflavone –0.252 46 5,7-Dihydroxy-6-methoxyflavone –0.051 47 5.7-Dihydroxy-8-methoxyflavone 0.182 48 6-F Hydroxyflavone 0.422 49 7-Hydroxyflavone 0.623 50 5,6,7-Trihydroxyflavone 0.747 51 6-Hydroxy-2’-mcthoxytlavone 0.976 52 2’-Methoxyflavone 1.508 53 2’-Amino-6-methoxyflavone 0.544 54 Flavone 0.000 55 5,7-Dihydroxyflavone 0.477 56 5,3’,4’-Trihydroxy-6,7-dimethoxyflavone 2.301 57 5,4’-Dihydroxy-6,7-dimcthoxyflavone 1.362 58 5,7,4’-Trihydroxy-6-mcthoxyflavone 0.000 59 5,7-Dihydroxy-2’-chloroflavone 0.903 60 5,7-Dihydroxy-2’-fluoroflavone 0.903 61 5,7-Dihydroxy-6,8-dibromoflavone –0.155 62 5,7,4’-Trihydroxyflavone 0.602 63 3,5,7,4’-Tetrahydroxytlavone 1.969 64 5-Hydroxy-7-methoxyllavone 1.699 65 5,7-Dihydroxy-6,8-diiodollavone 0.000 66 6-Fluoro,3’-hydroxyflavone 0.400 67 6-Chloro,3’-hydroxyflavone –0.070 68 6-Bromo,3’-hydroxyflavone –0.220 69 6-Bromo-2’-nitrotlavone –0.680 70 6-Nitro-4’-bromollavone –1.600 71 3’-Methoxyflavone 0.380 72 6-Chloro-3’-methoxyflavone –0.072 73 3’-Fluoroflavone 0.550 74 6-Bromo-4’-fluoroflavone –0.939 75 6-Fluoro-3’-chlorollavone –0.701 76 6-Bromo-3’-chlorollavone –1.770 77 6-Methylflavone –0.903 78 6-Bromo-3’-methylflavone –0.812 Copyright © 2011 SciRes. PP 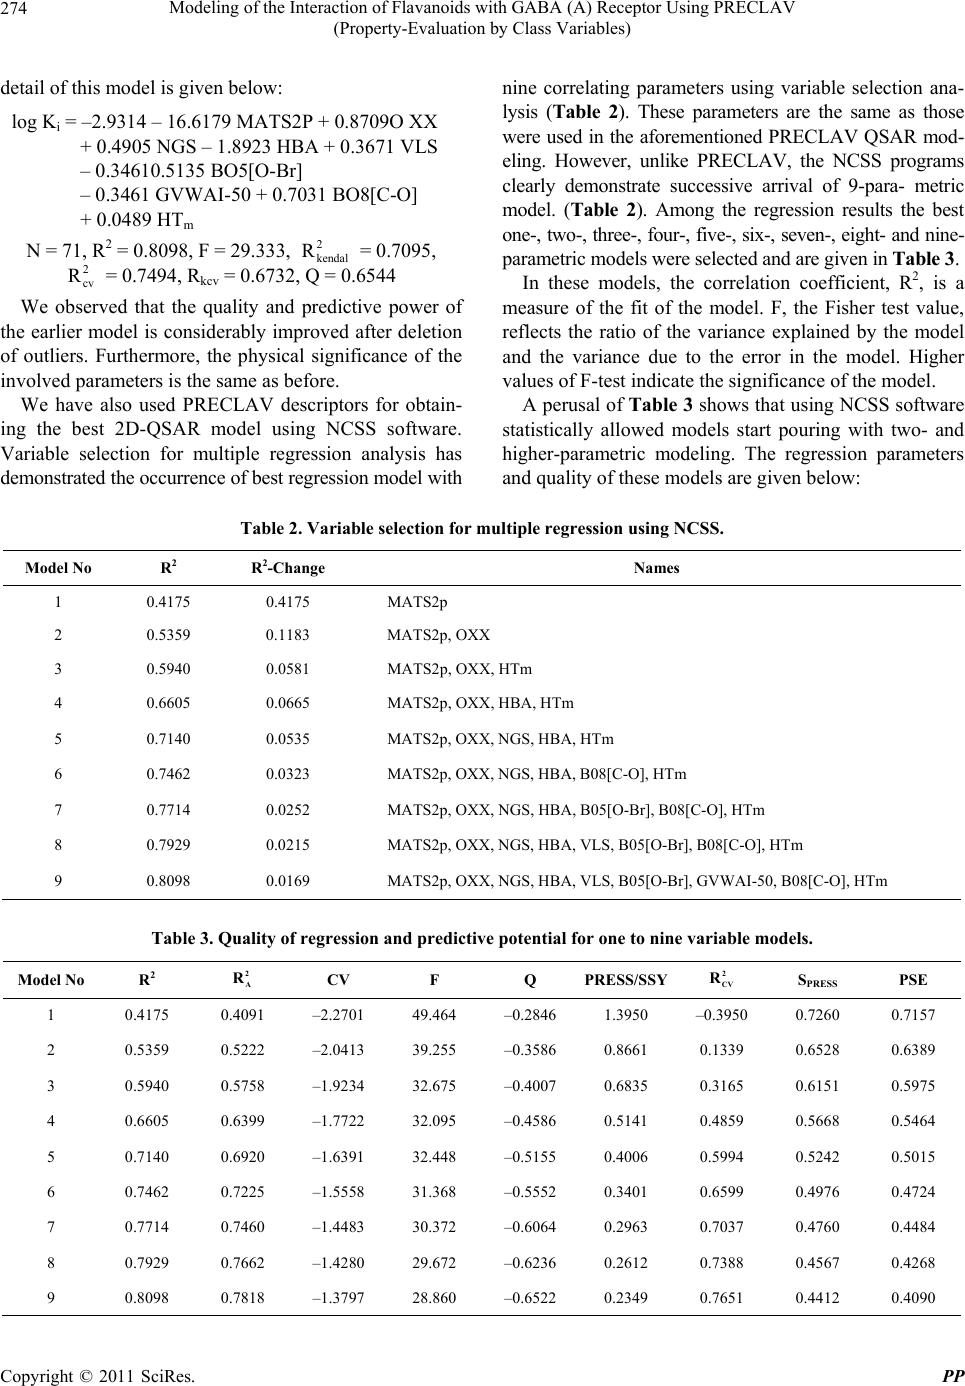 Modeling of the Interaction of Flavanoids with GABA (A) Receptor Using PRECLAV (Property-Evaluation by Class Variables) Copyright © 2011 SciRes. PP 274 nine correlating parameters using variable selection ana- lysis (Table 2). These parameters are the same as those were used in the aforementioned PRECLAV QSAR mod- eling. However, unlike PRECLAV, the NCSS programs clearly demonstrate successive arrival of 9-para- metric model. (Table 2). Among the regression results the best one-, two-, three-, four-, five-, six-, seven-, eight- and nine- parametric models were selected and are given in Table 3. detail of this model is given below: log Ki = –2.9314 – 16.6179 MATS2P + 0.8709O XX + 0.4905 NGS – 1.8923 HBA + 0.3671 VLS – 0.34610.5135 BO5[O-Br] – 0.3461 GVWAI-50 + 0.7031 BO8[C-O] + 0.0489 HTm N = 71, R2 = 0.8098, F = 29.333, = 0.7095, = 0.7494, Rkcv = 0.6732, Q = 0.6544 2 kendal R 2 cv RIn these models, the correlation coefficient, R2, is a measure of the fit of the model. F, the Fisher test value, reflects the ratio of the variance explained by the model and the variance due to the error in the model. Higher values of F-test indicate the significance of the model. We observed that the quality and predictive power of the earlier model is considerably improved after deletion of outliers. Furthermore, the physical significance of the involved parameters is the same as before. A perusal of Tab le 3 shows that using NCSS software statistically allowed models start pouring with two- and higher-parametric modeling. The regression parameters and quality of these models are given below: We have also used PRECLAV descriptors for obtain- ing the best 2D-QSAR model using NCSS software. Variable selection for multiple regression analysis has demonstrated the occurrence of best regression model with Table 2. Variable selection for multiple regression using NCSS. Model No R2 R 2-Change Names 1 0.4175 0.4175 MATS2p 2 0.5359 0.1183 MATS2p, OXX 3 0.5940 0.0581 MATS2p, OXX, HTm 4 0.6605 0.0665 MATS2p, OXX, HBA, HTm 5 0.7140 0.0535 MATS2p, OXX, NGS, HBA, HTm 6 0.7462 0.0323 MATS2p, OXX, NGS, HBA, B08[C-O], HTm 7 0.7714 0.0252 MATS2p, OXX, NGS, HBA, B05[O-Br], B08[C-O], HTm 8 0.7929 0.0215 MATS2p, OXX, NGS, HBA, VLS, B05[O-Br], B08[C-O], HTm 9 0.8098 0.0169 MATS2p, OXX, NGS, HBA, VLS, B05[O-Br], GVWAI-50, B08[C-O], HTm Table 3. Quality of regression and predictive potential for one to nine variable models. Model No R2 2 A R CV F Q PRESS/SSY2 CV R SPRESS PSE 1 0.4175 0.4091 –2.2701 49.464 –0.2846 1.3950 –0.3950 0.7260 0.7157 2 0.5359 0.5222 –2.0413 39.255 –0.3586 0.8661 0.1339 0.6528 0.6389 3 0.5940 0.5758 –1.9234 32.675 –0.4007 0.6835 0.3165 0.6151 0.5975 4 0.6605 0.6399 –1.7722 32.095 –0.4586 0.5141 0.4859 0.5668 0.5464 5 0.7140 0.6920 –1.6391 32.448 –0.5155 0.4006 0.5994 0.5242 0.5015 6 0.7462 0.7225 –1.5558 31.368 –0.5552 0.3401 0.6599 0.4976 0.4724 7 0.7714 0.7460 –1.4483 30.372 –0.6064 0.2963 0.7037 0.4760 0.4484 8 0.7929 0.7662 –1.4280 29.672 –0.6236 0.2612 0.7388 0.4567 0.4268 9 0.8098 0.7818 –1.3797 28.860 –0.6522 0.2349 0.7651 0.4412 0.4090  Modeling of the Interaction of Flavanoids with GABA (A) Receptor Using PRECLAV 275 (Property-Evaluation by Class Variables) Two-variable model log Ki = –0.6987 – 7.0909 (±1.1003) MATS2p + 0.6765 (± 0.1625) OXX N = 71, R2 = 0.5339, = 0.5222, CV = –2.0413, F = 39.255 2 A R The positive coefficient of the parameter OXX indi- cates that presence of Oxygen Maximum charge for O atom (at parabolic region) is favourable for the exhibition of the activity. Three-variable model log Ki = –1.2772 – 9.4417 (±1.2848) MATS2p + 0.7375 (±0.1544) OXX + 0.0296 (±0.0095) HTm N = 71, R2 = 0.5940, = 0.5758, CV= –1.9234, F = 32.675 2 A R Here the coefficients of both the parameters OXX and HTm are positive meaning thereby that presence of Oxygen Maximum charge for O atom (at parabolic region) as well as H total index/weighted by atomic masses are favourable for the exhibition of the activity. Four-variabl e mo de l log Ki = –2.1460 – 13.1294 (±1.5666) MATS2p + 0.9464 (±0.1536) OXX + 0.0471 (±0.0101) HTm – 1.1215 (±0.3120) HBA N = 71, R2 = 0.6605, = 0.6399, CV = –1.7722, F = 32.095 2 A R Here also the parameters OXX and HTm have positive coefficients meaning thereby that presence of Oxygen Maximum charge for O atom (at parabolic region) as well as H total index/weighted by atomic masses are favour- able for the exhibition of the activity Five-variable model log Ki = –2.0375 – 13.1086 (±1.4489) MATS2p + 0.9128 (±0.1424) OXX + 0.0499 (±0.0093) HTm – 1.2511 (±0.291 HTm 0) HBA + 0.6149 (±0.1763) NGS N = 71, R2 = 0.7140, = 0.6920, CV= –1.6391, F = 32.448 2 A R In this model, in addition to the two parameters OXX and HTm the third parameter NGS has positive coeffi- cient. This means that in addition to presence of Oxygen Maximum charge for O atom (at parabolic region) as well as H total index/weighted by atomic masses, the area of negative charged surface/molecular surface area ratio (at parabolic region) is also favourable for the exhibition of the activity. Six-variable model log Ki = –2.7781 – 14.5970 (±1.4709) MATS2p + 0.8088 (±0.1400) OXX + 0.0557 (±0.0091) HTm – 1.7353 (±0.3242) HBA + 0.5118 (±0.1712) NGS + 0.4724 (±0.1656) B08[C-O] N = 71, R2 = 0.7462, = 0.7225, CV= –1.5558, F = 31.368 2 A R We observe that in this model, in addition to the afore- mentioned three parameters a fourth parameter viz. B08 [C-O] has positive coefficient clearly meaning thereby that presence of Oxygen Maximum charge for O atom (at parabolic region) as well as H total index/weighted by atomic masses, the area of negative charged surface/ mo- lecular surface area ratio (at parabolic region), the pres- ence/absence of C-O at topological distance 08. (2D bi- nary fingerprint) also favours the exhibition of the activity. Seven-variable model log Ki = –3.0056 – 16.0272 (±1.5082) MATS2p + 0.8461 (±0.1347) OXX + 0.0509 (±0.0089) HTm – 1.8204 (±0.3118) HBA + 0.5333 (±0.1640) NGS + 0.5286 (±0.1598) B08[C-O] + 0.4638 (±0.1761) BO5[O-Br] N = 71, R2 = 0.7714, = 0.7460, CV= –1.4883, F = 30.372 2 A R In this model, in addition to the positive coefficients of the aforementioned four parameters, the fifth parameter namely BO5[O-Br] also has positive coefficient. It means that in addition to presence of Oxygen Maximum charge for O atom (at parabolic region) as well as H total in- dex/weighted by atomic masses, the area of negative charged surface/molecular surface area ratio (at parabolic region), the presence/absence of C-O at topological dis- tance 08. (2D binary fingerprint), the presence/absence of O-B at topological distance 05 (2D binary fingerprint) also favours the exhibition of the activity. Eight-variable model log Ki = –2.7789 – 15.4338 (±1.4659) MATS2p + 0.8315 (±0.1294) OXX + 0.0505 (±0.0085) HTm – 1.7761 (±0.2996) HBA + 0.5435 (±0.1574) NGS + 0.4955 (±0.1539) B08[C-O] + 0.4533 (±0.1690) BO5[O-Br] + 0.4045 (±0.1595) VLS N = 71, R2 = 0.7929, = 0.7662, CV= –1.4280, F = 29.672 2 A R Copyright © 2011 SciRes. PP  Modeling of the Interaction of Flavanoids with GABA (A) Receptor Using PRECLAV (Property-Evaluation by Class Variables) Copyright © 2011 SciRes. PP 276 Here, we observe that in addition to the positive coef- ficients of the above mentioned five parameters, the six parameter namely VLS also has positive coefficient. This clearly means that in addition to the presence of Oxygen Maximum charge for O atom (at parabolic region) as well as H total index/weighted by atomic masses, the area of negative charged surface/molecular surface area ratio (at parabolic region), the presence/absence of [C-O] at topo- logical distance 08. (2D binary fingerprint), the presence/ absence of [O-B] at topological distance 05 (2D binary fingerprint), volume of circumscribed sphere (at parabolic region) also favours the exhibition of the activity. Nine-variabl e mo de l log Ki = –2.9314 – 16.6178 (±1.5048) MATS2p + 0.8709 (±0.1261) OXX + 0.0489 (±0.0083) HTm – 1.8923 (±0.2938) HBA + 0.4905 (±0.1538) NGS + 0.7031 (±0.1734) B08[C-O] + 0.5135 (±0.1653) BO5[O-Br] + 0.3672 (±0.1549) VLS – 0.3461 (±0.1486) GVWAI-50 N = 71, R2 = 0.8098, = 0.7818, CV= –1.3797, F = 28.860 2 A R We observe that in this 9-parametric model the afore- mentioned six correlating parameters have positive coef- ficients .This means that their physical significance in this model is the same as that of the 8-parametric model discussed above. The aforementioned 9-variable model is, therefore, the most appropriate model and is subjected to Ridge regres- sion [25] for investigating the existence or otherwise of any co-linearity defect. The Ridge parameters, namely VIF (variance inflation factor), T (Tolerance), CN (Con- dition number), have been calculated and presented in Table 4. We observed that VIF (variance inflation fac- tor)values are much smaller than the allowed range of 10. Also, that condition number for for the correlating pa- rameters all are much lower than 100 and the tolerance are <1. These observations therefore, suggest that no co- linearity defect is present in the proposed model. Relative performance of PRECLAV and NCSS soft- ware In order to further investigate the relative performance of both PRECLAV as well as NCSS software we have calculated (estimated) log Ki values for the 9-parametric models using both softwares and compared them with the experimental values of log Ki (Table 5). This is demon- strated in Figures 1 and 2 indicating that quality of the model obtain from both PRECLAV and NCSS software is more or less same. log Ki values are much closer to the experimental values in case of PRECLAV software. From the study made herein we cannot definitely say as to which software is superior. Both have their own merits and demerits. However, the number of good points are more in PRECLAV software as compared to NCSS software. From the results obtained we conclude that there are some good or bad points in both the software and that overall PRECLAV software yields better statis- tics compared to NCSS software. The comparison of the performance of this software is demonstrated as below: Comparison of results obtained using PRECLAV and NCSS softw are . PRECLAV NCSS 1) Overall the best model is proposed 1) Recommends obtaining of the best model in succession which need to be confirmed by their means 2) Predicts and removes the outliers one by one during the regression so that the final model does not have any outlier 2) This is not possible 3) Performance cross-validation 3) Not possible 4) Selects most significant descriptors by quality 4) Selection of descriptors is not based on quality 5) Most valuable descriptors set is generated 5) Not possible 6) Correlation of predictor/activity is possible 6) Not possible 7) Yields inter correlation of predictors 7) Not possible 8) Makes estimated and observed values in calibration set 8) Yes it is also possible in NCSS 9) Analysis virtual fragments is possible 9) Not possible 10) Standard deviation of coefficients are not measured 10) We can estimate standard error of the coefficient of the correlating parameters 11) Ridge statistics is not possible 11) We can make ridge analysis and then investigate co- linearity defect 12) Estimate qulity Q of the model 12) Not possible  Modeling of the Interaction of Flavanoids with GABA (A) Receptor Using PRECLAV 277 (Property-Evaluation by Class Variables) It is worth mentioning that one of the important fea- tures of PRECLAV software is the analysis of virtual fragments. The software has indicated that for the set of 78 molecules analyzed here 30 virtual fragments are pre- sent out of which 9 fragments are significant. These most significant virtual fragments by correlation of “The Mass percent” and “Property values” are given in Table 6. This Table 6 demonstrates that large mass percent of CO, C9H4O4, C6H5O7, C6H4O, and C8H5O4 increases logKi values while the large mass percent at C8H4O, NO2, Br and C6H4 decreases the log Ki values. These observations, therefore, be taken care of while synthesizing new fla- vones with better log Ki values. In order to confirm our findings we have compared the estimated values of the activities (log Ki) with the ex- perimental ones (log Ki) (Table 5). This has further been demonstrated in Figures 1 and 2. Also, we have obtained Ridge traces as shown in Figures 3 and 4. From Figures 1 and 2 as well as Table 5, we observed that the esti- mated activities (log Ki) are very close to the experimen- tal activities (log Ki). Similarly, Figures 3 and 4 indi- cates absence of any co-linearity defect. Table 4. Ridge parameters for the most significant model. Variable VIF T λi CN MATS2p 4.4014 0.2272 3.367143 1.00 OXX 1.4179 0.7053 1.446224 2.33 NGS 1.1562 0.8649 0.957829 3.52 HBA 2.9861 0.3349 0.919456 3.66 VLS 1.0819 0.9243 0.771579 4.36 B05[O-Br]1.9536 0.5119 0.643925 5.23 GVWAI-501.8986 0.5267 0.460259 7.32 B08[CO] 2.5441 0.3931 0.316425 10.64 HTm 2.3977 0.4171 0.117160 28.74 Table 5. Comparison of log Ki values estimated using PRECLAV and NCSS Software. Using PRECLAV Using NCSS Compd. No Obs. log Ki Est. log Ki Residual Est. log Ki Residual 1 0.398 0.501 –0.103 0.501 –0.103 2 –0.215 –0.373 0.158 –0.373 0.158 3 0.097 0.228 –0.131 0.228 –0.131 4 0.322 0.084 0.238 0.084 0.238 5 –0.380 –0.898 0.518 –0.898 0.518 6 –0.424 0.067 –0.491 0.067 –0.491 7 –0.036 0.067 –0.103 0.067 –0.103 8 –0.932 –0.855 –0.077 –0.855 –0.077 9 –1.377 –1.013 –0.364 –1.013 –0.364 10 0.556 –0.118 0.674 –0.118 0.674 11 0.398 –0.042 0.44 –0.042 0.440 12 –0.742 –0.743 0.001 –0.743 0.001 13 –0.212 –0.76 0.548 –0.760 0.548 14 –1.638 –1.446 –0.192 –1.446 –0.192 15 –0.384 –0.641 0.257 –0.641 0.257 16 –0.627 –0.267 –0.36 –0.267 –0.360 17 –1.638 –1.302 –0.336 –1.302 –0.336 18 –1.721 –1.208 –0.513 –1.208 –0.513 19 –0.699 –0.828 0.129 –0.828 0.129 Copyright © 2011 SciRes. PP  Modeling of the Interaction of Flavanoids with GABA (A) Receptor Using PRECLAV 278 (Property-Evaluation by Class Variables) 20 –1.155 –1.285 0.13 –1.285 0.130 21 –0.785 –1.056 0.271 –1.056 0.271 22 –0.561 –0.992 0.431 –0.992 0.431 23 –0.066 0.535 –0.601 0.535 –0.601 24 0.653 0.256 0.397 0.256 0.397 25 Outlier 26 –2.252 –1.941 –0.311 –1.941 –0.311 27 –2.097 –1.751 –0.346 –1.751 –0.346 28 –1.585 –1.868 0.283 –1.868 0.283 29 –0.745 –0.463 –0.282 –0.463 –0.282 30 –0.545 –1.07 0.525 –1.070 0.525 31 –1.886 –1.285 –0.601 –1.285 –0.601 32 –1.602 –0.92 –0.682 –0.920 –0.682 33 0.000 –0.015 0.015 –0.015 0.015 34 0.000 –0.414 0.414 –0.414 0.414 35 –0.682 –0.631 –0.051 –0.631 –0.051 36 Outlier 37 –0.444 –0.485 0.485 –0.485 0.041 38 Outlier 39 –1.569 –1.114 –0.455 –1.114 –0.455 40 Outlier 41 –1.420 –0.757 –0.663 –0.757 –0.663 42 –1.125 –0.293 –0.832 –0.293 –0.832 43 –0.678 0.178 –0.856 0.178 –0.856 44 –0.699 –0.976 0.277 –0.976 0.277 45 –0.252 0.148 –0.4 0.148 –0.400 46 –0.051 0.131 –0.182 0.131 –0.182 47 0.182 0.004 0.178 0.004 0.178 48 0.422 0.948 –0.526 0.948 –0.526 49 0.623 0.736 –0.113 0.736 –0.113 50 0.747 0.838 –0.091 0.838 –0.091 51 0.976 0.986 –0.01 0.986 –0.010 52 1.508 0.93 0.578 0.930 0.578 53 0.544 0.228 0.316 0.228 0.316 54 0.000 –0.096 0.096 –0.096 0.096 55 0.477 0.805 –0.328 0.805 –0.328 Copyright © 2011 SciRes. PP 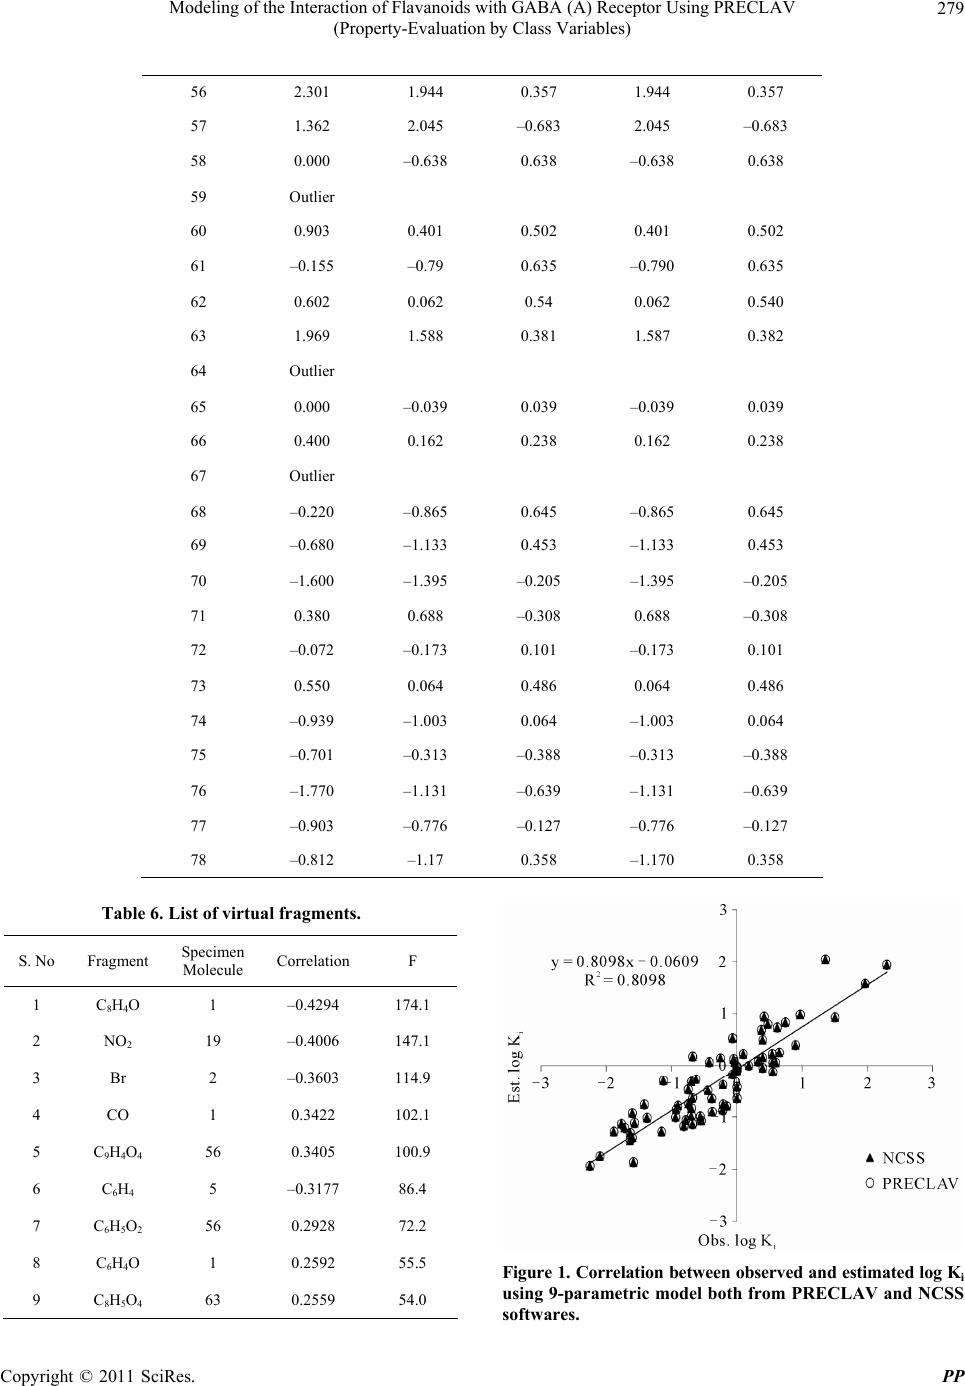 Modeling of the Interaction of Flavanoids with GABA (A) Receptor Using PRECLAV (Property-Evaluation by Class Variables) Copyright © 2011 SciRes. PP 279 56 2.301 1.944 0.357 1.944 0.357 57 1.362 2.045 –0.683 2.045 –0.683 58 0.000 –0.638 0.638 –0.638 0.638 59 Outlier 60 0.903 0.401 0.502 0.401 0.502 61 –0.155 –0.79 0.635 –0.790 0.635 62 0.602 0.062 0.54 0.062 0.540 63 1.969 1.588 0.381 1.587 0.382 64 Outlier 65 0.000 –0.039 0.039 –0.039 0.039 66 0.400 0.162 0.238 0.162 0.238 67 Outlier 68 –0.220 –0.865 0.645 –0.865 0.645 69 –0.680 –1.133 0.453 –1.133 0.453 70 –1.600 –1.395 –0.205 –1.395 –0.205 71 0.380 0.688 –0.308 0.688 –0.308 72 –0.072 –0.173 0.101 –0.173 0.101 73 0.550 0.064 0.486 0.064 0.486 74 –0.939 –1.003 0.064 –1.003 0.064 75 –0.701 –0.313 –0.388 –0.313 –0.388 76 –1.770 –1.131 –0.639 –1.131 –0.639 77 –0.903 –0.776 –0.127 –0.776 –0.127 78 –0.812 –1.17 0.358 –1.170 0.358 Table 6. List of virtual fragments. S. No Fragment Specimen Molecule Correlation F 1 C8H4O 1 –0.4294 174.1 2 NO2 19 –0.4006 147.1 3 Br 2 –0.3603 114.9 4 CO 1 0.3422 102.1 5 C9H4O4 56 0.3405 100.9 6 C6H4 5 –0.3177 86.4 7 C6H5O2 56 0.2928 72.2 8 C6H4O 1 0.2592 55.5 9 C8H5O4 63 0.2559 54.0 Figure 1. Correlation between observed and estimated log Ki using 9-parametric model both from PRECLAV and NCSS softwares. 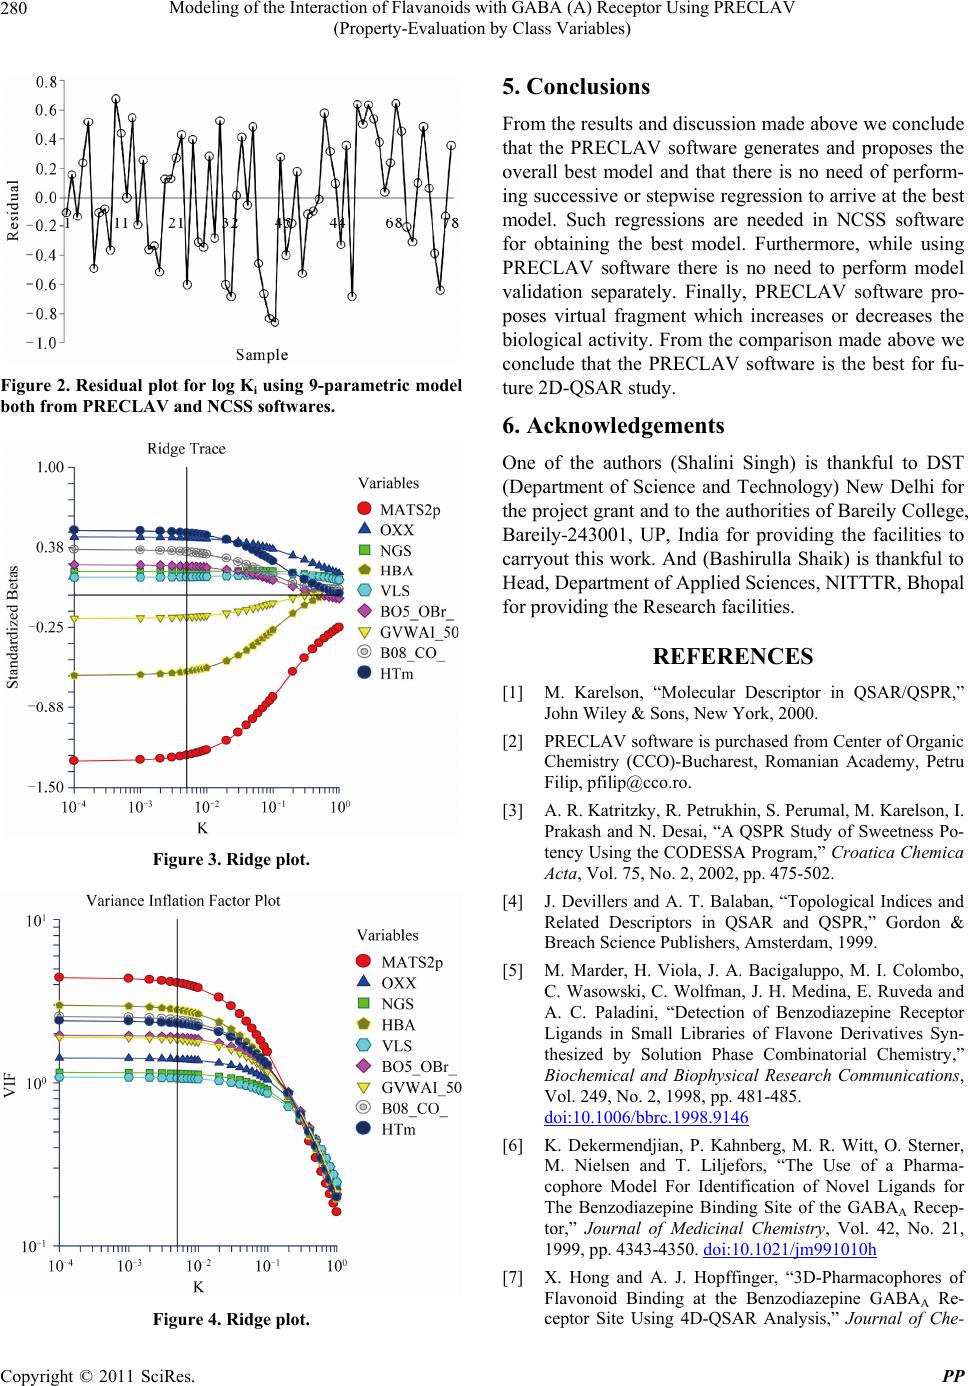 Modeling of the Interaction of Flavanoids with GABA (A) Receptor Using PRECLAV 280 (Property-Evaluation by Class Variables) Figure 2. Residual plot for log Ki using 9-parametric model both from PRECLAV and NCSS softwar e s. Figure 3. Ridge plot. Figure 4. Ridge plot. 5. Conclusions From the results and discussion made above we conclude that the PRECLAV software generates and proposes the overall best model and that there is no need of perform- ing successive or stepwise regression to arrive at the best model. Such regressions are needed in NCSS software for obtaining the best model. Furthermore, while using PRECLAV software there is no need to perform model validation separately. Finally, PRECLAV software pro- poses virtual fragment which increases or decreases the biological activity. From the comparison made above we conclude that the PRECLAV software is the best for fu- ture 2D-QSAR study. 6. Acknowledgements One of the authors (Shalini Singh) is thankful to DST (Department of Science and Technology) New Delhi for the project grant and to the authorities of Bareily College, Bareily-243001, UP, India for providing the facilities to carryout this work. And (Bashirulla Shaik) is thankful to Head, Department of Applied Sciences, NITTTR, Bhopal for providing the Research facilities. REFERENCES [1] M. Karelson, “Molecular Descriptor in QSAR/QSPR,” John Wiley & Sons, New York, 2000. [2] PRECLAV software is purchased from Center of Organic Chemistry (CCO)-Bucharest, Romanian Academy, Petru Filip, pfilip@cco.ro. [3] A. R. Katritzky, R. Petrukhin, S. Perumal, M. Karelson, I. Prakash and N. Desai, “A QSPR Study of Sweetness Po- tency Using the CODESSA Program,” Croatica Chemica Acta, Vol. 75, No. 2, 2002, pp. 475-502. [4] J. Devillers and A. T. Balaban, “Topological Indices and Related Descriptors in QSAR and QSPR,” Gordon & Breach Science Publishers, Amsterdam, 1999. [5] M. Marder, H. Viola, J. A. Bacigaluppo, M. I. Colombo, C. Wasowski, C. Wolfman, J. H. Medina, E. Ruveda and A. C. Paladini, “Detection of Benzodiazepine Receptor Ligands in Small Libraries of Flavone Derivatives Syn- thesized by Solution Phase Combinatorial Chemistry,” Biochemical and Biophysical Research Communications, Vol. 249, No. 2, 1998, pp. 481-485. doi:10.1006/bbrc.1998.9146 [6] K. Dekermendjian, P. Kahnberg, M. R. Witt, O. Sterner, M. Nielsen and T. Liljefors, “The Use of a Pharma- cophore Model For Identification of Novel Ligands for The Benzodiazepine Binding Site of the GABAA Recep- tor,” Journal of Medicinal Chemistry, Vol. 42, No. 21, 1999, pp. 4343-4350. doi:10.1021/jm991010h [7] X. Hong and A. J. Hopffinger, “3D-Pharmacophores of Flavonoid Binding at the Benzodiazepine GABAA Re- ceptor Site Using 4D-QSAR Analysis,” Journal of Che- Copyright © 2011 SciRes. PP 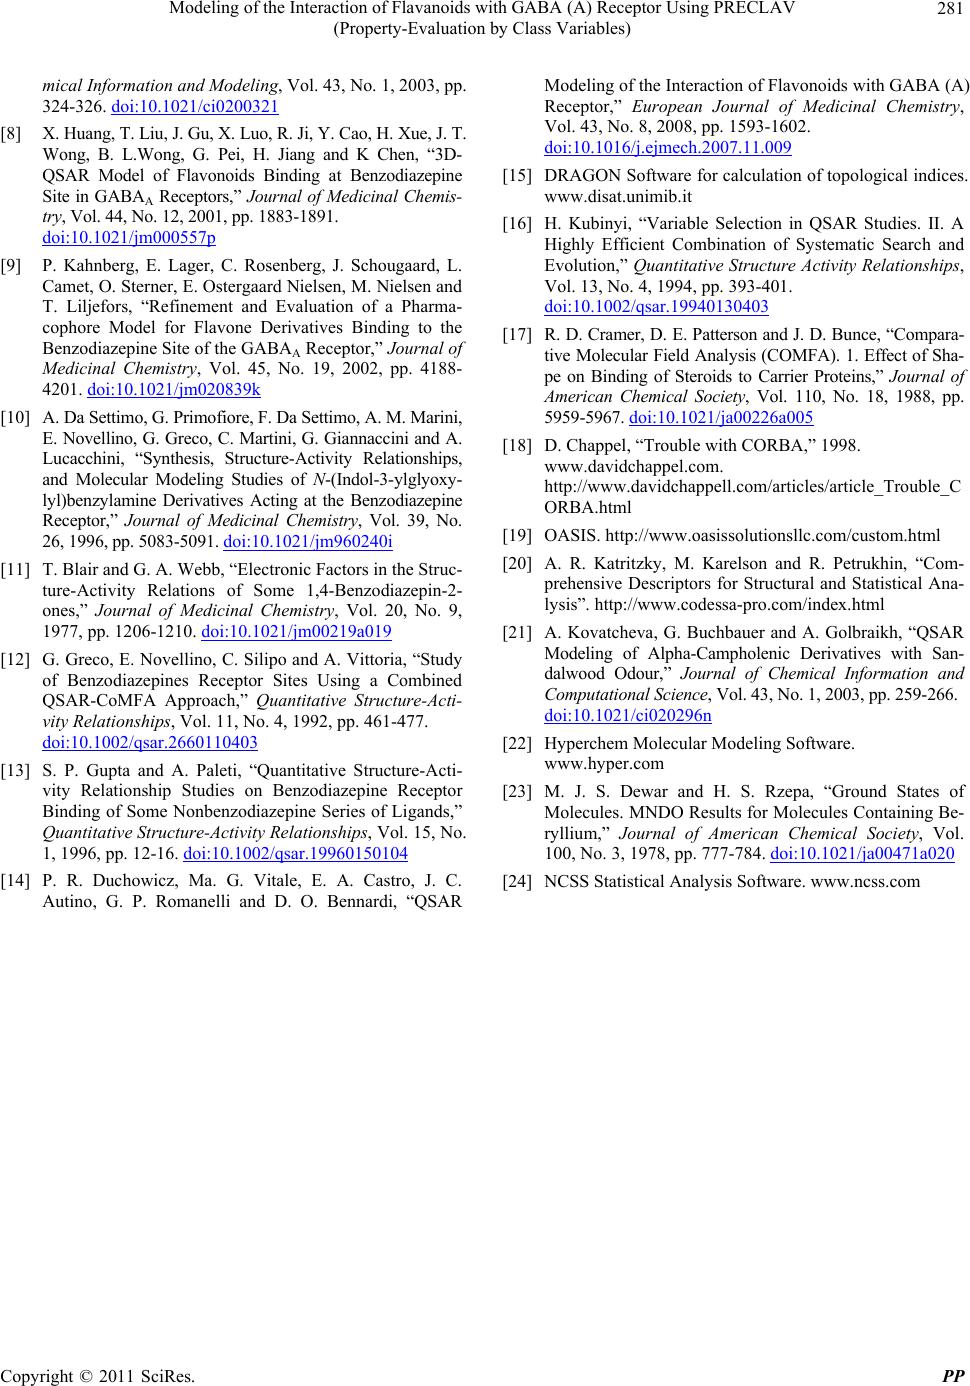 Modeling of the Interaction of Flavanoids with GABA (A) Receptor Using PRECLAV (Property-Evaluation by Class Variables) Copyright © 2011 SciRes. PP 281 mical Information and Modeling, Vol. 43, No. 1, 2003, pp. 324-326. doi:10.1021/ci0200321 [8] X. Huang, T. Liu, J. Gu, X. Luo, R. Ji, Y. Cao, H. Xue, J. T. Wong, B. L.Wong, G. Pei, H. Jiang and K Chen, “3D- QSAR Model of Flavonoids Binding at Benzodiazepine Site in GABAA Receptors,” Journal of Medicinal Chemis- try, Vol. 44, No. 12, 2001, pp. 1883-1891. doi:10.1021/jm000557p [9] P. Kahnberg, E. Lager, C. Rosenberg, J. Schougaard, L. Camet, O. Sterner, E. Ostergaard Nielsen, M. Nielsen and T. Liljefors, “Refinement and Evaluation of a Pharma- cophore Model for Flavone Derivatives Binding to the Benzodiazepine Site of the GABAA Receptor,” Journal of Medicinal Chemistry, Vol. 45, No. 19, 2002, pp. 4188- 4201. doi:10.1021/jm020839k [10] A. Da Settimo, G. Primofiore, F. Da Settimo, A. M. Marini, E. Novellino, G. Greco, C. Martini, G. Giannaccini and A. Lucacchini, “Synthesis, Structure-Activity Relationships, and Molecular Modeling Studies of N-(Indol-3-ylglyoxy- lyl)benzylamine Derivatives Acting at the Benzodiazepine Receptor,” Journal of Medicinal Chemistry, Vol. 39, No. 26, 1996, pp. 5083-5091. doi:10.1021/jm960240i [11] T. Blair and G. A. Webb, “Electronic Factors in the Struc- ture-Activity Relations of Some 1,4-Benzodiazepin-2- ones,” Journal of Medicinal Chemistry, Vol. 20, No. 9, 1977, pp. 1206-1210. doi:10.1021/jm00219a019 [12] G. Greco, E. Novellino, C. Silipo and A. Vittoria, “Study of Benzodiazepines Receptor Sites Using a Combined QSAR-CoMFA Approach,” Quantitative Structure-Acti- vity Relationships, Vol. 11, No. 4, 1992, pp. 461-477. doi:10.1002/qsar.2660110403 [13] S. P. Gupta and A. Paleti, “Quantitative Structure-Acti- vity Relationship Studies on Benzodiazepine Receptor Binding of Some Nonbenzodiazepine Series of Ligands,” Quantitative Structure-Activity Relationships, Vol. 15, No. 1, 1996, pp. 12-16. doi:10.1002/qsar.19960150104 [14] P. R. Duchowicz, Ma. G. Vitale, E. A. Castro, J. C. Autino, G. P. Romanelli and D. O. Bennardi, “QSAR Modeling of the Interaction of Flavonoids with GABA (A) Receptor,” European Journal of Medicinal Chemistry, Vol. 43, No. 8, 2008, pp. 1593-1602. doi:10.1016/j.ejmech.2007.11.009 [15] DRAGON Software for calculation of topological indices. www.disat.unimib.it [16] H. Kubinyi, “Variable Selection in QSAR Studies. II. A Highly Efficient Combination of Systematic Search and Evolution,” Quantitative Structure Activity Relationships, Vol. 13, No. 4, 1994, pp. 393-401. doi:10.1002/qsar.19940130403 [17] R. D. Cramer, D. E. Patterson and J. D. Bunce, “Compara- tive Molecular Field Analysis (COMFA). 1. Effect of Sha- pe on Binding of Steroids to Carrier Proteins,” Journal of American Chemical Society, Vol. 110, No. 18, 1988, pp. 5959-5967. doi:10.1021/ja00226a005 [18] D. Chappel, “Trouble with CORBA,” 1998. www.davidchappel.com. http://www.davidchappell.com/articles/article_Trouble_C ORBA.html [19] OASIS. http://www.oasissolutionsllc.com/custom.html [20] A. R. Katritzky, M. Karelson and R. Petrukhin, “Com- prehensive Descriptors for Structural and Statistical Ana- lysis”. http://www.codessa-pro.com/index.html [21] A. Kovatcheva, G. Buchbauer and A. Golbraikh, “QSAR Modeling of Alpha-Campholenic Derivatives with San- dalwood Odour,” Journal of Chemical Information and Computational Science, Vol. 43, No. 1, 2003, pp. 259-266. doi:10.1021/ci020296n [22] Hyperchem Molecular Modeling Software. www.hyper. com [23] M. J. S. Dewar and H. S. Rzepa, “Ground States of Molecules. MNDO Results for Molecules Containing Be- ryllium,” Journal of American Chemical Society, Vol. 100, No. 3, 1978, pp. 777-784. doi:10.1021/ja00471a020 [24] NCSS Statistical Analysis Software. www.ncss.com
|