Journal of Environmental Protection, 2011, 2, 1134-1142
doi:10.4236/jep.2011.28132 Published Online October 2011 (http://www.scirp.org/journal/jep)
Copyright © 2011 SciRes. JEP
Production of Safe Charcoal from Waste
Construction Wood Treated With Citric Acid
Masafumi Tateda1, Masaru Okura1, Youngchul Kim2, Bandunee Champika Liyanage Athapattu3
1Department of Environmental Engineering, Toyama Prefectural University, Imizu, Japan; 2Department of Environmental Engineer-
ing, Hanseo University, Seosan-si, Korea; 3Department of Civil Engineering, The Open University of Sri Lanka, Nawala, Sri Lanka.
Email: tateda@pu-toyama.ac.jp
Received August 6th, 2011; revised September 12th, 2011; accepted October 13th, 2011.
ABSTRACT
For practical reuse of wastewater containing citric acid and the production of safe and healthy high-quality charcoal
from waste construction wood, basic data regarding the influence of citric acid washing treatments on the physico-
chemical property of charcoa l was investigated in order to find the ben efits of using citric acid for wash ing out impuri-
ties of the wood, owing to its chelate bonding ability with elements such as metals. Parameters obtained for evaluating
the benefits were water conten t, volatile componen t conten t, ash content, fixed car bon co n tent, and the heat value of the
charcoal. All parameters, except ash content, throughout all carbonizatio n temperatures were not significan tly different
between the charcoal of the wood treated with and without citric acid. However, the ash content showed significant
differences between the charcoal treated with and without citric acid throughout all carbonization temperatures. Re-
garding the heat value, the highest heat value was shown on the charcoal carbonated at 600˚C with the static washing
treatment. Dioxins that were higher in content than the control sample were somehow detected in the ash of the char-
coal with the shaking treatment. Further investigation is needed for the production of safe and healthy charcoal using
waste citric acid.
Keywords: Charcoal, Waste Constr uction Wood , Citric Acid, Metals, Ash, Dioxins
1. Introduction
Generation of construction waste in Japan was approxi-
mately 64 million tons in 2008, which is a drastic de-
crease from 77 million tons in 2005. The amount of final
disposal to landfill sites also decreased from 6 to 4 mil-
lion tons in 2005 and 2008, respectively. This large re-
duction was mainly related to a significant decrease in
the number of construction contracts, owing to the Japa-
nese economic depression and severe cut-off of public
construction works ordered by the central or local go-
vernments. Construction waste in 2005 consists of waste
concrete (42%), waste asphalt and concrete (34%), con-
struction sludge (10%), waste construction wood (6%),
mixed construction waste (4%), and others (4%). The
difference reported for 2008 was not a large one [1].
While more than 97% of waste concrete or waste asphalt
and concrete were recycled, waste construction wood
was about 80%. The Recycling ratio of waste construc-
tion wood is not as high as the ratios of waste concrete
and waste asphalt and concrete. Waste construction wood
is currently recycled for energy recovery by heat after
being chopped, production of woody board as a con-
struction material, a raw material for paper production,
and composting; however, demand for these recycled
products is very low. In the near future, houses con-
structed in the 1960’s will be demolished because of life-
time expiration. Therefore, a large amount of waste con-
struction wood is expected to be generated; hence, it is
desired to find ways for recycling that can produce more
products demanded by markets. On the other hand, citric
acid wastewater including sucrose and vitamin C is ge-
nerated from food processing factories such as canned
fruit processing factories. Treatment of the wastewater
presents a high cost to factories. The ingredients in
wastewater are not toxic materials such as heavy metals
and persistent organic compounds but rather a kind of
resource, so they can be and should be used as substrates
for some biological processes such as composting. How-
ever, it could be more beneficial if there are more options
to use ingredients before moving on to composting. It is
already widely known that citric acid has an ability to
purify materials contaminated by elements such as ca-
tions because the acid removes cations such as Cd and
Production of Safe Charcoal from Waste Construction Wood Treated With Citric Acid1135
Pb by its chelate bonds with the elements. The objective
of this study was to find benefits of citric acid washing of
waste construction wood. Charcoal was produced from
waste construction wood by carbonization after washing
with citric acid. Characteristics of the charcoal were in-
vestigated an d co mpared with charcoal that was normally
produced. The washing and purification ability of citric
acid was the focus of this study and applied to waste
construction wood in order to produce high-q uality char-
coal.
2. Materials and Methods
2.1. Waste Construction Wood
Waste construction wood was obtained from a waste ma-
nagement company in Imizu City, Toyama, Japan. Water
content of the wood was 16%, and it is sho wn in Figure
1.
2.2. Chemical
Commercial citric acid (Special grade, Kanto Chemical,
Japan) was used for the washing process.
2.3. Experimental Methods
1) Washing waste construction wood with citric acid in
static condition
A citric acid solution (5%) was prepared, and a mix-
ture of wood and citric acid with a ratio of 200 g :2000 ml
(1:10) was mixed in a plastic basket. The wood was put
into a net bag in order to prevent dispersion in the solu-
tion. Another plastic basket full of water was placed on
the wood in the net in order to make the wood com-
pletely sink in the citric solution and it was left fo r 24 h.
After 24 h, the wood was removed from the basket and
dried at 105˚C for 24 h.
2) Washing waste construction wood by citric acid in
shaking condition
A citric acid solution (5%) was prepared, and a mix-
ture of wood and citric acid with a ratio of 50 g:500 ml
(1:10) was mixed in a 1000 ml plastic container. The cap
of the container was tightly closed and shaken at 150
Figure 1. Waste Construction Wood.
rpm and at room temperature for 24 h in a rotary shaker
(OSI-501LD, EYELA). After 24 h, the wood was re-
moved from the basket and dried at 105˚C for 24 h.
3) Measurement of CODMn and analysis of impurities
extracted in citric acid solution after washing
After static and shaken washing, the citric acid solu-
tion was filtered with a cellulose acetate 0.80 µm filter
(ADVANTEC). CODMn of the solution was measured
following the procedure of JIS K 0102 (Japanese Indus-
trial Standard). A qualitative analysis of the extracted
elements from waste construction wood in the solution
was also performed with an ICP emission spectropho-
tometer (Optima 5300 DV-TK, PerkinElmer).
4) Carbonization and its condition
Fourteen grams of waste construction wood was placed
into a crucible (B3 type) and the crucible was closed
with a lid; it was then placed in an electric furnace (KBF-
784N1, KOYO Thermosystem). Carbonization tempera-
tures were selected from 300˚C to 1100˚C with a 100˚C
interval; the waste construction wood was held at each
temperature for 1 h. After the sample was cooled, it was
removed from the furnace.
5) Charcoal property analysis
The charcoal produced in section 2.3.4) was powdered
to less than 250 µm with a planetary ball mill (Pulver-
isette 7, Fritsch). The powdered sample was spread out
and dried at room temperature. The water, ash, and vola-
tile component content of the sample were measured
following the procedure of JIS M 8812. Fixed carbon
content was calculated using values of the water, ash,
and volatile component content. The heat value was also
obtained. Details have been described in the following
sections. All measurements were triplicate (p < 0.05).
a) Water con te n t
One gram of the dried sample was placed into a
weighing sampler (Cylinder 40 × 60 mm) and the sample
was dried at 107˚C for 1 h in a thermostatic dryer (MOV-
212U, Sanyo). After cooling in a desiccator, the sample
was measured for its water content by weight difference
between before and after drying.
b) Ash content
One gram of the dried sample was placed in a crucible
(B0 type), and the sample was placed in an electric fur-
nace (KBF794N1, KOYO Thermosystem). The inside
temperature of the furnace gradually increased to 500˚C,
taking 60 min, and next to 815˚C, taking another 45 min,
then held at temperature for 1 h. After cooling in a de-
siccator, the sample was measured for its ash content by
weight difference between before and after of combus-
tion.
c) Volatile component content
One gram of the dried sample was placed in a crucible
(B0 type), and the crucible was closed with a lid. The
Copyright © 2011 SciRes. JEP
Production of Safe Charcoal from Waste Construction Wood Treated With Citric Acid
1136
sample was combusted at 900˚C for 7 min in an electric
furnace (KBF794N1, KOYO Thermosystem) and cooled
in a desiccator. The percentage of weight difference be-
tween before and after combustion was first obtained and
the percentage was subtracted from the water content,
and then the remaining percentage became the volatile
component content of the sample.
d) Fixed carbon content
The following equation was used to obtain fixed car-
bon content:
Fixed carbon content (%) = 100 – [Water content (%)
+ Ash content (%) + Volatile component content (%)].
e) Heat value
Heat values of the dried prepared samples were ob-
tained by a bomb calorimeter (1013-B, Yoshida) follow-
ing JIS M 8814.
6) SEM and EDS observations
SEM observations of the charcoal produced at 300˚C,
400˚C, 600˚C, 700˚C, and 1000˚C carbonation tempera-
tures in section 2.3.4) were performed using a scanning
electron microscope (SSX-550, Shimadzu). Magnifica-
tion was chosen at ×3000. EDS observation was also
conducted on the charcoal carbonized at 1000˚C in sec-
tion 2.3.4) using an energy dispersive X-ray spectrometer
attached to the scanning electron microscope (SSX-550,
Shimadzu). A fundamental parameter (FP) was used for
quantitative calculatio n.
7) Analysis of dioxins
One gram of the charcoal samples, both with and
without citric acid washing, and using only the shaken
washing method was chosen. The samples carbonized at
600˚C in section 2.3.4), were placed in a crucible (B0
type) and combusted at 500˚C for 1 h in an electric fur-
nace (KBF794N1, KOYO Thermosystem). Quantitative
analysis of the dioxins found in the combustion ash was
performed by analysis using a gas chromatograph mass
spectrometer (Waters/MICROMASS). The samples that
added 0.3 ml of oil and 0.04 g of salt per gram of char-
coal were also prepared and combusted under the same
condition as normal samples in order to see any accelera-
tion of diox in formation with the existence of th e oil and
salt. We assumed that 100 ml oil and 10 g salt per 1 kg of
charcoal was reasonable amount fallen on the surface on
a charcoal when grilled meats on a stick or in barbecue
were served, and just multiplied the amounts 3 - 4 times
for expecting more dioxin formation.
3. Results
3.1. Results of CODMn and Analysis of Impurities
Extracted from Citric Acid solution after
Washing
CODMns in the citric acid solution after washing waste
construction wood under different washing methods are
shown in Figure 2. The CODMns of citric acid solutions
(29000 mg/l) after washing were larger than the control
sample (28000 mg/l). It showed that some organic matter
was extracted from waste construction wood by citric
acid, and the same increase (1000 mg/l) in CODMn was
seen in cases of static and shaken washing. Figure 3
showed that elements such as Ca, Mg, K, and Na were
extracted from the wood and the concentration of the
elements in the samples treated by shaking was slightly
higher than those of the static sample.
3.2. Result of Charcoal Property Analysis
Figures 4 through 7 show the results of the properties of
the charcoal produced at different carbonization tem-
peratures. Fixed carbon content and volatile component
content as a function of carbonization temperatures are
shown in Figure 4. It was recognized that the trends of
the three samples were almost the same, and the trends of
fixed carbon content and volatile component content
showed a reciprocal relationship. The changes were clas-
sified in three steps; the almost first order relationship
from 300˚C to 700˚C, first constant period from 700˚C to
900˚C, and second constant period from 1000˚C to
1100˚C. Ash content as a function of carbonization tem-
perature is shown in Figure 5. Under all temperatures,
Figure 2. CODMn of citric acid solutions after washing.
Figure 3. Impurity elements detected in citric acid solutions
after washing.
C
opyright © 2011 SciRes. JEP
Production of Safe Charcoal from Waste Construction Wood Treated With Citric Acid1137
Figure 4. Fixed carbon and volatile component content as a
function of carbonization temperature.
Figure 5. Ash content as a function of carbonization tem-
perature.
ash content of the control samples was higher than the
washed samples. The largest difference was shown at
700˚C. Ash content of the washed samples was about 1%,
whereas the control sample contained more than 3 times
greater ash content than the washed ones. Among the
washed samples, the static washing sample always
showed a higher ash content than the shaken washing
sample. The state of ash content of each sample carbon-
ized at 500˚C carbonization temperature is seen in Fig-
ure 8. It is obvious that the amount of ash in the control
was greater than the othe r two samples. Water content as
a function of carbonization temperature is shown in Fig-
ure 6. Water content fluctuated in a range of about 0.5%
- 3.5%, which is probably attributed to the experimental
room condition such as room temperature and humidity.
Heat values (room dry base) as a function of carboniza-
tion temperature are shown in Figure 7. Three trends
were almost the same, except for the cases at 400˚C and
600˚C according to the figure. Heat values of the static
Figure 6. Water content as a function of carbonization tem-
perature.
Figure 7. Heat values as a function of carbonization tem-
perature (room dry base).
Figure 8. Ash content of the charcoal carbonized at 500˚C
Control (Left), Static (Center), Shaken (Right).
washing samples were very high at 400˚C and 600˚C as
compared to others, and the heat value at 600˚C became
the highest in this study and was 33.6 MJ/kg. Ch arcoal is
usually grouped into 2 groups; black and white charcoals.
Carbonization temperatures for black and white char-
coals are 400˚C - 700˚C and 800˚C and more than 800˚C,
respectively [2]. Generally speaking, black charcoal car-
bonized at 600˚C shows the highest heat value of ap-
proximately 33 MJ/kg [3], which corresponds with our
results.
3.3. SEM and EDS Observations
SEM images of charcoal carbonized at 1000˚C shown in
Figure 9. Other SEM images at 300˚C, 400˚C, 600˚C,
Copyright © 2011 SciRes. JEP
Production of Safe Charcoal from Waste Construction Wood Treated With Citric Acid
1138
Figure 9. SEM images of the charcoals carbonized at
1000˚C (a) Control (no washing); (b) Static washing; (c)
Shaken washing.
and 700˚C were very similar to that at 1000˚C. As shown
in Figure 9(a), many white spots were observed on the
surface of the holes of the charcoal without citric acid
washing; whereas any spots were hardly recognized on
that of the charcoal washed with citric acid by static and
shaken methods (Figures 9(b) and (c)). The white spots
were examined using EDS. In Figure 10, the small area
was 0.5 µm2 and the large area was 10 µm2. According
to the qualitative-quantitative analysis results in Figure
11, elements shown in figure (A) were detected in the
area of 0.5 µm2 and Na, Cl, and Ti, as well as the ele-
ments shown in the area of 0.5 µm2 were also detected in
the area of 10 µm2. The elements C and O that occupied
a large percentage, were constituent elements of the
charcoal, but other elements were impurities of th e char-
coal. The results shown in the figure indicate that Al, Si,
Figure 10. EDS target areas on the charcoal carbonized at
1000˚C without washing (Control).
Figure 11. Qualitative-quantitative analysis of (a) 0.5 and (b)
10 micro meters squares.
K, Ca, and Fe were contained in a relatively large num-
ber; therefore it could be said that white spots in the ar-
eas were mainly constituted by those elements.
3.4. Analysis of Dioxins
Results are shown in Figure 12. Higher dioxin concen-
tration was detected in the ashes of the charcoal with the
shaken washing method for both the normal and oil and
salt addition combustions. From the result, the charcoal
with low levels of impurities seemed to hold dioxins in
the ash.
4. Discussion
4.1. Existing of Impurities on Charcoal Surface
Impurities existing in waste construction wood and
C
opyright © 2011 SciRes. JEP
Production of Safe Charcoal from Waste Construction Wood Treated With Citric Acid1139
Figure 12. Dioxin concentrations in combustion ash (a)
normal combustion; (b) Combustion with addition of vege-
table oil and salt.
washed-out by citric acid were given in Figure 3 while,
after carbonization at 1000˚C impurities existing in char-
coal are shown in Figure 11. The elements Si, P, S, Cl,
and Ti are shown in Figure 11, but not seen in Figure 3.
It was reasonable to think that those elements existed on
the surface of waste construction wood, but could not be
washed-out by citric acid. On the other hand, the ele-
ments As, Ba, Cr, Cu, Se, and Zn were seen in Figure 3,
but not seen in Figure 11. Those elements might be
originally contained at very low levels on the surface of
waste construction wood supposing from Figure 3 but
flew away with fly ash during carbonation at 1000˚C;
therefore, those elements might not have been detected in
Figure 11. Results of Figure 3 and Figure 9(b) and (c)
were linked to the result of Figure 5. As also noticed
visually in Figure 8, ash content in the control sample
was much higher than samples with citric acid washing
(Figure 5). Washing with citric acid removed impurities
from the waste construction wood, so that the ash content
of the sample washed by citric acid became lower than
the control sample; 0.6% - 2.1% and 0.9% - 2.5% reduc-
tion for static and shaken washing, respectively.
4.2. Interaction of Physical Properties of
Charcoal
Ash content for the three samples in Figure 5 increased
as carbonization temperature increased. This was be-
cause of an increase of fixed carbon content with the
increase of carbonization temperature. Charcoal is some-
times called amorphous carbon and crystals of the carbo n
are irregularly lined. The small crystals expand as car-
bonization temperature increases and increase fixed car-
bon content. Whereas, volatile component content is a
volatile part in charcoal so the content decreases as car-
bonization temperature increases (Figure 4). The rela-
tionship between fixed carbon and volatile component
content is reciprocal (Figure 13). Fixed carbon content is
a form of carbon and its burnability is very low, so fixed
carbon content easily remains in ash [4]. This is ex-
plained in Figure 5. High fixed carbon content indicates
a state of good carbonization [4]. Heat values (absolute
dry base) were given in Figure 14. Figures 7 and 14
show almost the same trends. Naturally, heat value is in-
fluenced by water, ash, volatile components, and fixed
carbon content. However, in this case, it can be said that
water content did not influence so much the heat values
of the three samples. The trends of Figure 14 were ex-
Figure 13. Fixed carbon and Volatile component content.
Figure 14. Heat values as a function of carbonization tem-
perature (absolute dry base ).
Copyright © 2011 SciRes. JEP
Production of Safe Charcoal from Waste Construction Wood Treated With Citric Acid
1140
amined here without considering the influence of water
content. Since ash is not burnable, heat value decreases
with the increase of ash. Volatile components and fixed
carbon content both are burnable, although the former is
quite easily burned, while fixed carbon is not easily
burnable. Consid ering these characteristics of the content,
it can be concluded that the heat value should be higher
in the case of high volatile component content with low
ash and fixed carbon content. Low heat value is expected
in the case of low volatile component content while high
in ash and fixed carbon content. The samples carbonated
at 300˚C and 1100˚C fit the former and latter cases, re-
spectively, according to Figures 4 and 5. So heat values
of the samples at 300˚C must be the highest, and those at
1100˚C must be the lowest. However, Figure 14 shows
totally different heat values than expected. These facts
imply the following conclusions on heat values; 1) it is
sure that the content of ash decreases heat value since
ash is non-burnable and 2) it is not so easy to say that the
heat value is low when the volatile component conten t is
high and fixed carbon content is low and vice versa; and
the interaction among water, ash, volatile component,
and fixed carbon content decides the heat value of the
charcoal. In this study, the static washing sample car-
bonated at 600˚C showed the highest heat value. Fuel
ratios of charcoal as a function of carbonization tem-
peratures were calculated in Figure 15. The fuel ratio
can be obtained by “fixed carbon content/volatile com-
ponent content” and is a parameter of “tendency for
burning” used for evaluation of quality of coal [4]. The
fuel ratio increased with an in increase of carbonization
temperature but was not related to heat value. When the
sample with static washing and carbonated at 600˚C
possessed the highest heat value, the fuel ratio of the
sample was 9.6.
4.3. SEM Observation on Charcoal Structure
Under SEM observation, all samples had a lot of holes,
and porous structures of charcoal were recognized.
Wood tissue structures do not change after carbonization
and charcoal keeps the same structure as wood does. As
features of the structure, holes are large and the walls
between the holes are thin in coniferous trees and holes
are small and the walls between the holes are thick in
broadleaf trees. In this study, the former structure is often
recognized in SEM observation, so waste construction
wood obtained for this study mostly consisted of conif-
erous trees. Through SEM observation at each carboni-
zation temperature, it can be noticed that porous struc-
tures at high carbonization te mperatures seemed firm and
tight but those at low temperatures looked loose and
weak (Figure 16). Carbon crystals seemed not to form
tight and solid at low carbonization temperatures. Con-
Figure 15. Fuel ratios as a function of carbonization tem-
perature.
Figure 16. SEM images of the charcoals carbonized at
300˚C (a) Control (no washing); (b) Static washing; (c)
Shaken washing.
C
opyright © 2011 SciRes. JEP
Production of Safe Charcoal from Waste Construction Wood Treated With Citric Acid1141
siderable numbers of white spots were recognized on the
surfaces of the charcoal without citric acid washing at
each different carbonization temperature, but quality and
quantity of the spots were not always similar to those
shown in Figure 9; and varies by sample (data not
shown). Since a variety of waste construction wood was
used as sampled for this study, the construction wood
originally treated with different kinds of antiseptic
chemicals, glues, and coating chemicals and was dealt
with differently at various demolition sites were mixed.
Therefore, it should be reminded that elements shown in
Figure 11 were just one example. It was easily expected
that other elements on the surface of the charcoal sam-
ples existed case by case.
4.4. Dioxin Formation in Charcoal Combustion
It is reported that wood combustion is one of the most
considerable sources for dioxin formation [5,6]. Accord-
ing to Elena et al (2004), a large number of waste con-
struction wood was incinerated in open-air at the site of
Hanshin-Awaji great earthquake tragedy and resulted in
a large formation of dioxins in the ashes (up to 2080 ng
I-TEQ/kg) and had six times higher level of atmospheric
pollution by dioxins as compared to a normal atmos-
pheric situation. It is reported that dioxins were formed
through homogeneous (pyrolytic rearrangement of chlo-
rinated precursors) and heterogeneous (catalyzed) reac-
tions [7]. As catalysts, Cu was the main catalyst rep orted
in many journals [6-12], and Fe [9-11], C [12] were also
reported. These elements are also recognized in Figure 3
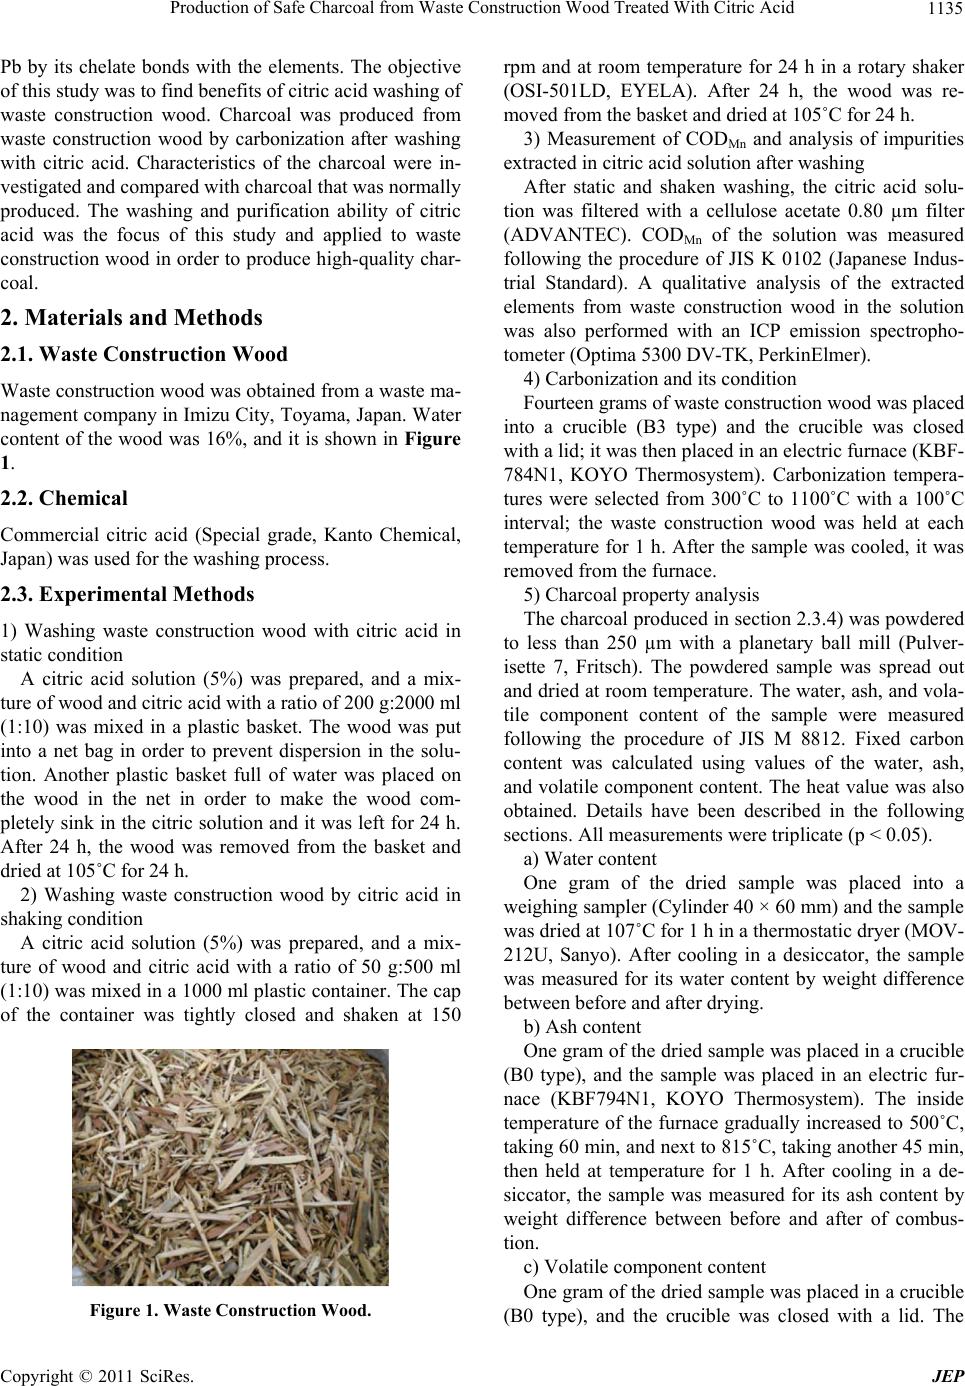
in this study. Dioxins were detected and are shown in
Figure 12. According to Tateda’s report [13], concentra-
tion of total PCDD (Poly Chlorinated Dibenzo-p-Dioxin)
was not detected (N.D.)-110 and 5.23 - 10883 ng/g in
bottom and fly ashes, respectively, and N.D.-65 and 3.73
- 3187 ng/g for total PCDF (Poly Chlorinated Dibenzo
Furan) and N.D.-180 and N.D.-250 ng/g for total PCB
(Poly Chlorinated Biphenyl). From the results above; the
concentration of dioxins seemed always higher in fly ash
than bottom ash, but this is not always true and depends
on how it was combusted [5]. In ash generation, it was
generally mentioned that fly ash was 10% of total ash
after waste incineration and 90% was bottom ash [14]. In
Figure 12, the samples treated with citric acid by the
shaken method showed a higher concentration of dioxins
than the control samples. Because of a low level of im-
purities in the samples treated with citric acid, it was
hard to think that more dioxins were formed in fly ash.
Moreover, it was also hard to find the reason that homo-
geneous reactions had intensively occurred in the bottom
ashes of the samples treated by citric acid. Analysis of
dioxins in fly ash or gases was not conducted in this
study; therefore, dioxin formation in fly ash or gases is
not known. The reasons that there were higher concen-
trations in the samples treated with citric acid shown in
Figure 12 may be the following: 1) dioxins were con-
centrated in the bottom ashes because generation of bot-
tom ashes was less than that of the control sample or 2)
low impurity levels might keep dioxin concentration
higher in bottom ashes by some mechanism such as “ad-
sorption,” which means probably low dioxin concentra-
tion in gas or fly ash. Further investigation is needed in
order to clarify those assumptions.
4.5. Use of Waste Citric Acid Solution to
Composting
As described in Figure 2, the 5% citric acid solution had
29000 mg/l in its CODMn after washing treatment. It is
not appropriate to discharge the wastewater into the en-
vironment and should be treated or applied to other pur-
poses. In this study, as mentioned at the beginning of this
paper, the wastewater was applied to composting as a
substrate. The concerning elements that destroy compost
quality such as As, Cr, Cu, Mn, and Se were seen in
Figure 2; however, those concentrations were at a very
low level, so the application of the wastewater to com-
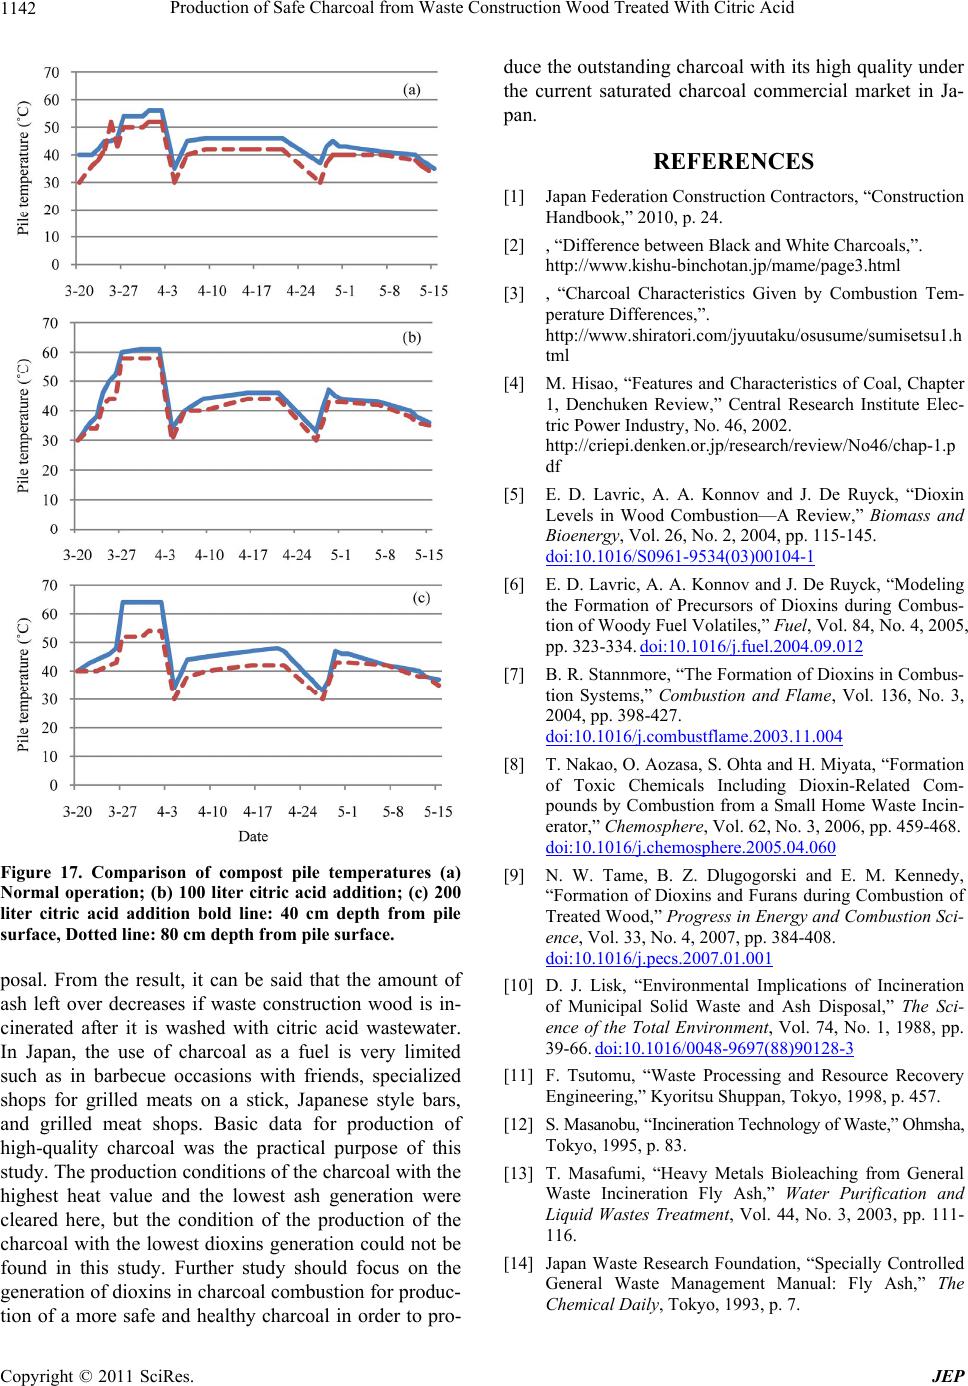
posting was acceptable. Compost temperature was traced
and is seen in Figure 17. Temperatures of compost piles
with citric acid application were higher than the control
pile at the beginning stage of composting. After the first
turn over on April 3, temperature trends were almost the
same between the control and citric acid applied piles.
Citric acid is an easily degraded sub stanc e, so additio n of
the acid contributed to activation of microbes’ metabo-
lism at the beginning stage of composting, the most im-
portant stage in a composting operation.
5. Conclusions
As one of the reuse ways for wastewater containing citric
acid, washing treatment of waste construction wood with
citric acid solution was carried out for production of
charcoal, taking advantage of citric acid’s chelate bond-
ing characteristics with elements and finding benefits of
washing with citric acid in terms of charcoal production
from waste construction wood. As a result, physico-
chemical parameters such as fixed carbon content, vola-
tile component content, water content, and heat values
were not significantly different at all carbonization tem-
peratures between the control and citric acid treatment
samples; however, significant differences were seen in
ash content at all carbonization temperatures. At 700˚C
of carbonization temperature, more than 3 times were
different between the control and citric acid treatment
samples. The biggest problem of combustion is the ash
left over. Companies and local governments that own in-
cinerators or boilers pay a pretty high cost for ash dis-
Copyright © 2011 SciRes. JEP
Production of Safe Charcoal from Waste Construction Wood Treated With Citric Acid
Copyright © 2011 SciRes. JEP
1142
Figure 17. Comparison of compost pile temperatures (a)
Normal operation; (b) 100 liter citric acid addition; (c) 200
liter citric acid addition bold line: 40 cm depth from pile
surface, Dotted line: 80 cm depth from pile surface.
posal. From the result, it can be said that the amount of
ash left over decreases if waste construction wood is in-
cinerated after it is washed with citric acid wastewater.
In Japan, the use of charcoal as a fuel is very limited
such as in barbecue occasions with friends, specialized
shops for grilled meats on a stick, Japanese style bars,
and grilled meat shops. Basic data for production of
high-quality charcoal was the practical purpose of this
study. The production conditions of the charcoal with the
highest heat value and the lowest ash generation were
cleared here, but the condition of the production of the
charcoal with the lowest dioxins generation could not be
found in this study. Further study should focus on the
generation of dioxins in charcoal combustion for produc-
ion of a more safe and healthy charcoal in order to pro-
duce the outstan ding charcoal with its high quality under
the current saturated charcoal commercial market in Ja-
pan.
REFERENCES
[1] Japan Federation Construction Contractors, “Construction
Handbook,” 2010, p. 24.
[2] , “Difference between Black and White Charcoals,”.
http://www.kishu-binchotan.jp/mame/page3.html
[3] , “Charcoal Characteristics Given by Combustion Tem-
perature Differences,”.
http://www.shiratori.com/jyuutaku/osusume/sumisetsu1. h
tml
[4] M. Hisao, “Features and Characteristics of Coal, Chapter
1, Denchuken Review,” Central Research Institute Elec-
tric Power Industry, No. 46, 2002.
http://criepi.denken.or.jp/research/review/No46/chap-1.p
df
[5] E. D. Lavric, A. A. Konnov and J. De Ruyck, “Dioxin
Levels in Wood Combustion—A Review,” Biomass and
Bioenergy, Vol. 26, No. 2, 2004, pp. 115-145.
doi:10.1016/S0961-9534(03)00104-1
[6] E. D. Lavric, A. A. Konnov and J. De Ruyck, “Modeling
the Formation of Precursors of Dioxins during Combus-
tion of Woody Fuel Volatiles,” Fuel, Vol. 84, No. 4, 2005,
pp. 323-334. doi:10.1016/j.fuel.2004.09.012
[7] B. R. Stannmore, “The Formation of Dioxins in Combus-
tion Systems,” Combustion and Flame, Vol. 136, No. 3,
2004, pp. 398-427.
doi:10.1016/j.combustflame.2003.11.004
[8] T. Nakao, O. Aozasa, S. Ohta and H. Miyata, “Formation
of Toxic Chemicals Including Dioxin-Related Com-
pounds by Combustion from a Small Home Waste Incin-
erator,” Chemosphere, Vol. 62, No. 3, 2006, pp. 459-468.
doi:10.1016/j.chemosphere.2005.04.060
[9] N. W. Tame, B. Z. Dlugogorski and E. M. Kennedy,
“Formation of Dioxins and Furans during Combustion of
Treated Wood,” Progress in Energy and Combustion Sci-
ence, Vol. 33, No. 4, 2007, pp. 384-408.
doi:10.1016/j.pecs.2007.01.001
[10] D. J. Lisk, “Environmental Implications of Incineration
of Municipal Solid Waste and Ash Disposal,” The Sci-
ence of the Total Environment, Vol. 74, No. 1, 1988, pp.
39-66. doi:10.1016/0048-9697(88)90128-3
[11] F. Tsutomu, “Waste Processing and Resource Recovery
Engineering,” Kyoritsu Shuppan, Tokyo, 1998, p. 457.
[12] S. Masanobu, “Incineration Technology of Waste,” Ohmsha,
Tokyo, 1995, p. 83.
[13] T. Masafumi, “Heavy Metals Bioleaching from General
Waste Incineration Fly Ash,” Water Purification and
Liquid Wastes Treatment, Vol. 44, No. 3, 2003, pp. 111-
116.
[14] Japan Waste Research Foundation, “Specially Controlled
General Waste Management Manual: Fly Ash,” The
Chemical Daily, Tokyo, 1993, p. 7.
t