 Journal of Environmental Protection, 2011, 2, 1062-1068 doi:10.4236/jep.2011.28122 Published Online October 2011 (http://www.scirp.org/journal/jep) Copyright © 2011 SciRes. JEP Libby Amphibole Contamination in Tree Bark Surrounding Historical Vermiculite Processing Facilities Mohamed I. Elashheb1, Terry M. Spear2, Julie F. Hart2, James S. Webber3, Tony J. Ward1,* 1Center for Environmental Health Sciences, The University of Montana, Missoula, USA; 2Department of Safety, Health and Indus- trial Hygiene, Montana Tech of the University of Montana, Butte, USA; 3New York State Department of Health, Wadsworth Center, Albany, USA. Email: *Tony.Ward@mso.umt.edu Received August 13th, 2011; revised September 15th, 2011; accepted October 3rd, 2011. ABSTRACT Over a 70-year period, a mine near Libby, MT supplied nearly 80% of the world’s vermiculite. Raw vermiculite, wh ich was contaminated with naturally occurring amphibo le in veins throughout the deposit, was shipped to processing sites throughout the Un ited States for exfoliation. In this pilot stud y, tree ba rk samples were collected near pr ocessing facili- ties in Spokane, WA, Santa Ana, CA, Newark, CA, and Phoenix, AZ in an effort to determine if areas surround ing these facilities are today contaminated with Libby amphibole asbestos (AA). From areas surrounding each of the four his- torical processing sites, Libby AA was detected in a subset of the bark samples. At the Santa Ana, Newark and Phoenix facilities, actinolite-tremolite and other high Fe Ca-bearing amphibole were also measured from the bark samples. In addition, chrysotile was frequently measured in samples collected from each of the sites. From the results of this pilot study, it is evident that tree bark can serve as reservoirs of asbestos, and indicators of past and current co ntamination. These data also suggest that areas outside of these historical processing facilities may today have some level of existing contamination resulting from the operation of these facilities. Keywords: Vermiculite, Asbestos, Amphibole, Libby, Exfoliation, Tree Bark 1. Introduction Prior to 1990, up to 80% of the world’s vermiculite was derived from a mine near Libby, Montana [1]. The ver- miculite ore mined from Zonolite Mountain seven miles northeast of Libby was contaminated with fibrous and asbestiform amphibole in veins throughout the deposit [2], containing a combination of winchite (84%), rich- terite (11%) and tremolite (6%) [3]. As a result of this contamination, occupational exposure to Libby amphi- bole asbestos (AA) has led to a significant increase of serious respiratory diseases such as lung cancer, pleural cancer and asbestosis among the former mine workers [4-6]. In addition, pleural abnormalities have been de- fined in 17.8% of the 6668 participants who lived or worked in the Libby area prior to 1991 [7]. In October 2002, Libby was added to the Environmental Protection Agency’s (EPA) National Priorities List, and in June 2009 the town of Libby was designated a public health emergency. This is the only time EPA has made such a declaration. Libby AA has been measured outside of Libby as well. Between the 1920s and 1990s, vermiculite mined from Libby (estimated in the millions of tons) was shipped by railroad to 245 facilities within the US for processing via exfoliation [13]. Exfoliation refers to a commercial pro- cess where vermiculite is rapidly heated to expand it into low-density, accordion-like nuggets [13]. At the facili- ties, the raw vermiculite was typically unloaded manu- ally by workers using shovels and front loaders, and stored on site until transferred to an exfoliation furnace where it was heated to a temperature between 1500 and 2000 °F [14]. The processed vermiculite was then stored on site until packaged in various forms for commercial use such as attic insulation. In facilities such as the West- ern Mineral Products Site in Minneapolis, Minnesota additional products such as Monokote (a fire proofing material that combined vermiculite and chrysotile asbes- tos) were also produced [15]. In 2008, ATSDR released a study in which 28 out of  Libby Amphibole Contamination in Tree Bark Surrounding Historical Vermiculite Processing Facilities1063 245 sites were selected for detailed evaluation for on-site Libby AA contamination. At many of these facilities, Libby AA was found in exterior soil and indoor dust in areas where vermiculite and waste rock were unloaded or stored. At the present time, many of these former exfo- liation sites are occupied with commercial and industrial operations not related to the original exfoliation pro- cesses. In addition to on-site contamination, we hypothe- size that airborne emissions of Libby amphibole fibers from exhaust stacks and fugitive emissions from vermi- culite storage sites may have been dispersed into the ar- eas surrounding these locations. In this manuscript, we report on a study in which tree bark samples were collected surrounding historical Libby vermiculite processing facilities located in Spokane (WA), Newark (CA), Santa Ana (CA), and Phoenix (AZ). The goal of this research project was to determine if Libby AA emanated from the industrial sites during the periods of operation of these facilities, and if trees sur- rounding these facilities are today contaminated with Libby AA. 2. Materials and Methods Tree bark samples were collected in areas surrounding the former vermiculite processing facility in Spokane, WA, on March 9, 2009. Between June 8 and June 10, 2010, tree bark samples were collected in areas surround- ing three other former facilities in Newark, CA, Santa Ana, CA and Phoenix, AZ. Bark samples were also collected in Missoula, MT to serve as control samples. The Spokane site (located approximately 160 kilometers from Libby) was selected because it is one of the closest former processing facilities to Libby. The remaining three sites were selected based on a ranking system, con- sidering 1) the tonnage of raw vermiculite processed, 2) the year that exfoliation work was terminated at the site, 3) the population density within one mile of the site and 4) the total duration of site operation. Table 1 presents the characteristics of each site. 2.1. Tree Bark Sampling At each location, bark was collected from several tree species native to the area. A pry-bar or spatula was used to collect a ~ 200-gram piece (with surface area between 50 - 150 cm2) of bark from approximately four feet above the base of each tree. These were placed into labeled plastic bags. The spatula/pry-bar was wiped down after each sample collection with isopropyl alcohol and laboratory tissues. In total, 22 samples were collected from around the Spokane facility. At the Santa Ana, Newark, and Phoenix facilities, 40, 22 and 25 samples, respectively, were collected in proximity to the facilities. Because asbestos fibers can become airborne and easily dispersed, the majority of samples were collected in areas predominantly downwind of the facilities. 2.2. Tree Bark Analyses Following the MD Webber method [8], samples of ap- proximately 1 gram (normalized to 10 cm2 surface area) were weighed, dried to stable mass at 60 to 100˚C, ashed at 450˚C for ~16 hours, and re-weighed to determine percentage loss of organic material. Residue, typically 5% of original mass, was suspended in filtered deionized water, thoroughly mixed, and filtered through 0.4-um polycarbonate filters before being prepared for transmis- sion electron microscopy (TEM) analysis using carbon coating and ethylene-diamine dissolution onto TEM grids. All 22 samples from the Spokane site were analyzed whereas funding constraints limited us to only five sam- ples per site from the Santa Ana, Newark, and Phoenix sites. As the goal of this project was to detect Libby am- phibole in the areas surrounding the historical facilities, the five samples from the latter three sites were chosen Table 1. Description of Vermiculite proce ssing facilities in Spokane, WA, Santa Ana, CA, Newark, CA and Phoenix, AZ. Factor/Site Spokane, WAA Santa Ana, CAB Newark, CAC Phoenix, AZD Years of Operation 1951-1973 1971-1993 1966-1993 1964-1992 Tons Processed 10,317 (between 1967 and 1973) 453,000 337,100 254,900 Pop. Within 1 mile 17,214 35,832 10,183 12,915 Surrounding area use Commercial and residential Light industrial and commercial, elementary school (1950-present) 200 yards away Mixed commercial, industrial and residential Industrial, commercial and residential Prevailing wind Southwest Southwest Northwest Variable, west in the daytime and east in the evening Sample collection direction from facility All directions, primarily north and northeast All directions, primarily north and east All directions, primarily northeast and southeast All directions, primarily east AATSDR, Vermiculite northwest, Spokane, WA [16]; BATSDR, Fact sheet, Santa Ana, CA [17]; CATSDR, Fact sheet, Newark, CA [18]; DATSDR, Fact sheet, Phoenix, CA [19]. Copyright © 2011 SciRes. JEP  Libby Amphibole Contamination in Tree Bark Surrounding Historical Vermiculite Processing Facilities 1064 from trees close to and downwind of the facility. For each sample, four different dilutions were prepared from the ashed bark in an effort to eliminate both over and under-loading of TEM grids. Once the grids were prepared, they were sent to ALS Laboratories (Cincinnati, OH) for TEM analysis. TEM analysis was performed at a screen magnification of at least 15,000× on a Philips CM-12 TEM with EDAX Genesis System providing Energy-dispersive X-ray ana- lysis (EDXA) capabilities. Identification and measure- ment of asbestos structures were conducted according to AHERA protocol [20]. 3. Results Table 2 presents the summary of findings from the Spokane site, while Table 3 presents the results from Table 2. Summary of tree bark results from the Spokane site. Asbestos Concentration (s/cm2) Total asbestos <5 µm Total asbestos >5 µm Type of tree Distance from Facility (meters) Sample ID AA Chrysotile AA Chrysotile SPK_1 ND 939,506 ND ND American Elm 122 SPK_2 2,400,640 ND 800,213 ND Douglas fir 61 Note: AA: Libby Amphibole Asbestos; ND: None detected. Table 3. Summary of tree bark analysis results of Santa Ana, Newark and Phoenix sites. Asbestos Concentration (s/cm2) Total Asbestos < 5 µm Total Asbestos > 5 µm Sample ID Dilution Prep AA A-T Chrysotile AA A-T ChrysotileOther Conc. (s/cm2) Type of tree Distance from Facility (meters) A. Santa Ana Site SA_1 2 2.5 3.5 1,704,683 ND ND ND ND ND ND ND 333,559 1,136,456 463,192 ND 568,228 ND ND ND ND ND ND ND ND Eastern cottonwood 366 SA_2 6 469,716 ND ND ND ND ND ND Blue gum Eucalyptus 457 SA_3 1.5 2.5 3 ND ND ND ND ND ND 744,062 428,992 713,842 ND ND ND ND ND ND ND ND ND 744,062 ND ND American Elm 610 SA_4 3 3.5 ND ND ND ND ND 543,881 ND ND ND ND 649,360 ND ND ND American Elm 732 B. Newark Site NEW_1 4 ND ND 1,266,526 ND ND ND ND Blue gum Eucalyptus 701 NEW_2 1.5 2 2.5 3 ND ND ND ND 807,883 ND ND ND ND 634,753 1,485,125 842,188 ND ND ND ND ND ND ND ND ND ND ND ND ND ND ND ND Eastern cottonwood 152 NEW_3 2 2.5 530,103 ND 530,103 ND 2,120,412 ND ND ND ND ND ND ND ND 429,191 California redwood 61 NEW_4 2.5 3 3.5 ND ND ND ND ND ND 1,599,152 2,013,383 1,137,822 ND ND ND ND ND ND ND ND ND ND 671,128 ND Australian pine 213 NEW_5 3 4 5 ND ND ND ND ND ND ND 480,088 776,296 ND ND ND ND ND ND ND ND ND 645,265 ND ND Australian pine 305 C. Phoenix Site PHX_1 3 6 ND ND ND 473,892 924,072 ND ND ND ND ND ND ND ND ND Snow Gum eucalyptus 274 PHX_2 4 ND ND 681,027 ND ND ND 681,027 Snow Gum eucalyptus 152 PHX_3 3 4 ND ND ND ND 1,371,575 ND ND 479,941 ND ND ND ND 685,787 479,941 Ash-leaf Maple 610 Note: A-T: Actinolite-Tremolite; AA: Libby Amphibole Asbestos; Other fibers: refers to fibers that may be a high Fe Ca-bearing amphibole; ND: None detected. C opyright © 2011 SciRes. JEP  Libby Amphibole Contamination in Tree Bark Surrounding Historical Vermiculite Processing Facilities1065 Santa Ana, Newark, and Phoenix, respectively. Chry- sotile and Libby AA were detected in samples collected from trees surrounding the Spokane facility. At the Santa Ana, Newark and Phoenix facilities, actinolite-tremolite (A-T) and other asbestos structures were identified in addition to chrysotile and Libby AA. The term “other fibers” is used in this paper to refer to fibers that appear to be a high Fe Ca-bearing amphibole. 3.1. Spokane Site Libby AA did not predominate in tree bark samples collected surrounding the Spokane site. Of the 22 bark samples collected and analyzed, only one sample yielded Libby AA (2,400,640 s/cm2 < 5 µm in length, and 800,213 s/m2 > 5 µm in length). Another sample revealed chrysotile structures, with a concentration of 939,506 s/cm2 (<5 µm in length). 3.2. Santa Ana Site Four of the 40 samples collected were analyzed, on the basis of their location predominantly downwind and near the facility. Two samples yielded AA structures with concentrations ranging from 463,192 to 1,704,683 s/cm2. Actinolite-tremolite structures (568,228 s/cm2) were de- tected in a third sample, while another sample contained Fe Ca-bearing amphibole (concentration of 744,062 s/cm2). In addition to AA, chrysotile structures were found in three of the four samples with concentrations ranging from 333,559 s/cm2 to 744,062 s/cm2 (Table 3). 3.3. Newark Site One of the five samples revealed Libby AA with a concentration of 530,103 s/cm2 (Table 3). The majority of samples yielded chrysotile structures with concen- trations ranging between 480,088 s/cm2 and 2,120,412 s/cm2. Actinolite-tremolite structures were detected in two samples with concentrations of 807,883 s/cm2 and 530,103 s/cm2, respectively. Fe Ca-bearing amphibole fibers were detected in three samples with concentrations ranging between 429,191 s/cm2 to 671,128 s/cm2. 3.4. Phoenix Site Only one of the three samples analyzed from the Phoenix site indicated the presence of Libby AA (479,941 s/cm2), while another sample revealed actinolite-tremolite fibers with a concentration of 473,892 s/cm2 (Table 3). Chry- sotile was detected in all three samples that were ana- lyzed from the Phoenix site, with concentrations ranging from 681,027 s/cm2 to 1,371,575 s/cm2. Fe Ca-bearing amphibole fibers were identified in two samples, with concentrations from 479,941 to 685,787 s/cm2. 3.5. Control Samples All 11 control samples used for this study were collected from Douglas fir (Pseudotsuga menziesii) trees at The University of Montana campus in Missoula. Control samples were treated with the same analytical protocol as the actual samples. For the Spokane bark analytical pro- gram, two control bark samples were analyzed in an ef- fort to detect any potential sources of contamination. No Libby AA were detected in any of the nine control sam- ples that were analyzed when processing the samples from the Santa Ana, Newark and Phoenix sites. However, it should be noted that one chrysotile fiber was measured in one of the control bark samples. This chrysotile fiber could have actually been on the control sample (given the historical ubiquity of chrysotile in the 20th century), or it could have been contamination that occurred either during the sample preparation or during lab analysis. At any rate, we are confident that this single chrysotile fiber does not indicate a contamination problem with the ana- lytical program. 4. Discussion Tree bark has been used since the late 1980s as bio- monitors for both inorganic and organic pollutants [21]. Specifically, polychlorinated dibenzo-p-dioxins and di- benzofurans [22], polyaromatic hydrocarbons [23], poly- chlorinated bipheynls [24-26], organochlorine pesticides [27-28], radioactive analytes [29-30], trace metals [31- 39], and persistent organic pollutants [40] have all been studied. In the present study, Libby AA was detected at each of the four sites in a subset of the trees surrounding the his- torical processing facilities. Meeker et al. [3] conducted the first comprehensive study on Libby asbestos to de- termine the mineralogy and morphology of both fibrous and non-fibrous amphiboles, supporting the earlier re- sults of Wylie and Verkouteren [41] and Gunter et al. [42]. They described the Libby AA as winchite, richterite, tremolite, and magnesioriebeckite, with the majority of structures displaying a gradient of morphologies between prismatic crystals and asbestiform fibers. Libby amphi- bole has a standard elemental composition of Si > Mg > Ca > Fe > Na > K, with fibers having a mean length of 4.9 μm, and mean aspect ratio of 17. These characteris- tics were all used when identifying the Libby AA in bark samples collected surrounding the four historical pro- cessing facilities. The non-Libby AA asbestos structures included acti- nolite-tremolite (EDXA spectra with just Mg-Ca-Fe-Si peaks present, and occasionally minimal Al) and amphi- bole fibers that were high in iron and calcium were iden- tified in the bark samples. Chrysotile fibers were also detected in tree bark samples collected around the pro- cessing facilities at each of four sites. This finding is not surprising, as chrysotile was widely used in thousands of Copyright © 2011 SciRes. JEP 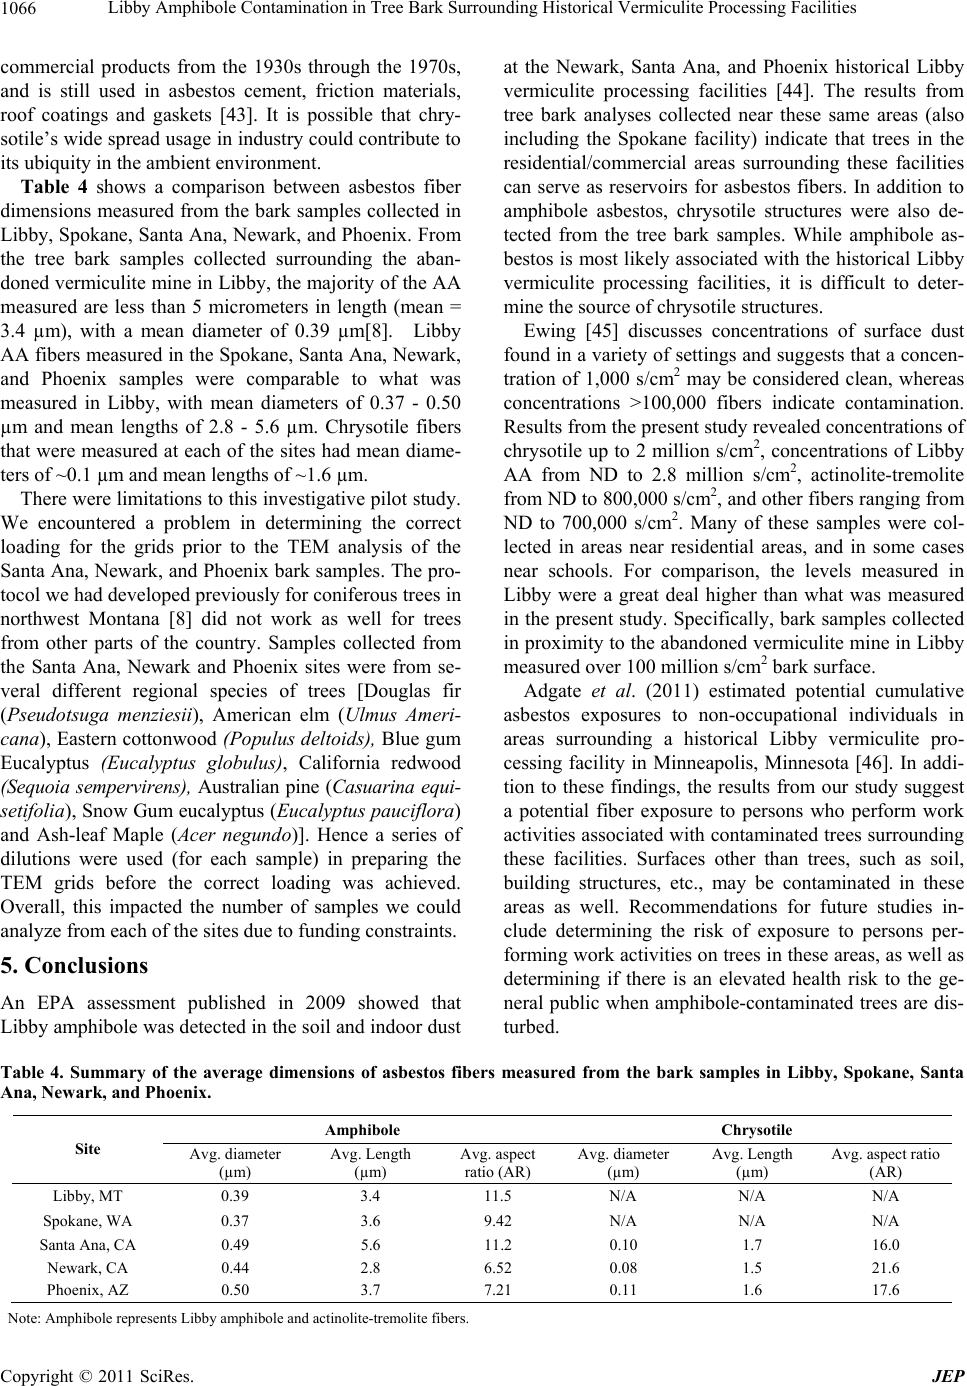 Libby Amphibole Contamination in Tree Bark Surrounding Historical Vermiculite Processing Facilities 1066 commercial products from the 1930s through the 1970s, and is still used in asbestos cement, friction materials, roof coatings and gaskets [43]. It is possible that chry- sotile’s wide spread usage in industry could contribute to its ubiquity in the ambient environment. Table 4 shows a comparison between asbestos fiber dimensions measured from the bark samples collected in Libby, Spokane, Santa Ana, Newark, and Phoenix. From the tree bark samples collected surrounding the aban- doned vermiculite mine in Libby, the majority of the AA measured are less than 5 micrometers in length (mean = 3.4 µm), with a mean diameter of 0.39 µm[8]. Libby AA fibers measured in the Spokane, Santa Ana, Newark, and Phoenix samples were comparable to what was measured in Libby, with mean diameters of 0.37 - 0.50 µm and mean lengths of 2.8 - 5.6 µm. Chrysotile fibers that were measured at each of the sites had mean diame- ters of ~0.1 µm and mean lengths of ~1.6 µm. There were limitations to this investigative pilot study. We encountered a problem in determining the correct loading for the grids prior to the TEM analysis of the Santa Ana, Newark, and Phoenix bark samples. The pro- tocol we had developed previously for coniferous trees in northwest Montana [8] did not work as well for trees from other parts of the country. Samples collected from the Santa Ana, Newark and Phoenix sites were from se- veral different regional species of trees [Douglas fir (Pseudotsuga menziesii), American elm (Ulmus Ameri- cana), Eastern cottonwood (Populus deltoids), Blue gum Eucalyptus (Eucalyptus globulus), California redwood (Sequoia sempervirens), Australian pine (Casuarina equi- setifolia), Snow Gum eucalyptus (Eucalyptus pauciflora) and Ash-leaf Maple (Acer negundo)]. Hence a series of dilutions were used (for each sample) in preparing the TEM grids before the correct loading was achieved. Overall, this impacted the number of samples we could analyze from each of the sites due to funding constraints. 5. Conclusions An EPA assessment published in 2009 showed that Libby amphibole was detected in the soil and indoor dust at the Newark, Santa Ana, and Phoenix historical Libby vermiculite processing facilities [44]. The results from tree bark analyses collected near these same areas (also including the Spokane facility) indicate that trees in the residential/commercial areas surrounding these facilities can serve as reservoirs for asbestos fibers. In addition to amphibole asbestos, chrysotile structures were also de- tected from the tree bark samples. While amphibole as- bestos is most likely associated with the historical Libby vermiculite processing facilities, it is difficult to deter- mine the source of chrysotile structures. Ewing [45] discusses concentrations of surface dust found in a variety of settings and suggests that a concen- tration of 1,000 s/cm2 may be considered clean, whereas concentrations >100,000 fibers indicate contamination. Results from the present study revealed concentrations of chrysotile up to 2 million s/cm2, concentrations of Libby AA from ND to 2.8 million s/cm2, actinolite-tremolite from ND to 800,000 s/cm2, and other fibers ranging from ND to 700,000 s/cm2. Many of these samples were col- lected in areas near residential areas, and in some cases near schools. For comparison, the levels measured in Libby were a great deal higher than what was measured in the present study. Specifically, bark samples collected in proximity to the abandoned vermiculite mine in Libby measured over 100 million s/cm2 bark surface. Adgate et al. (2011) estimated potential cumulative asbestos exposures to non-occupational individuals in areas surrounding a historical Libby vermiculite pro- cessing facility in Minneapolis, Minnesota [46]. In addi- tion to these findings, the results from our study suggest a potential fiber exposure to persons who perform work activities associated with contaminated trees surrounding these facilities. Surfaces other than trees, such as soil, building structures, etc., may be contaminated in these areas as well. Recommendations for future studies in- clude determining the risk of exposure to persons per- forming work activities on trees in these areas, as well as determining if there is an elevated health risk to the ge- neral public when amphibole-contaminated trees are dis- turbed. Table 4. Summary of the average dimensions of asbestos fibers measured from the bark samples in Libby, Spokane, Santa Ana, Newark, and Phoenix. Amphibole Chrysotile Site Avg. diameter (µm) Avg. Length (µm) Avg. aspect ratio (AR) Avg. diameter (µm) Avg. Length (µm) Avg. aspect ratio (AR) Libby, MT 0.39 3.4 11.5 N/A N/A N/A Spokane, WA 0.37 3.6 9.42 N/A N/A N/A Santa Ana, CA 0.49 5.6 11.2 0.10 1.7 16.0 Newark, CA 0.44 2.8 6.52 0.08 1.5 21.6 Phoenix, AZ 0.50 3.7 7.21 0.11 1.6 17.6 Note: Amphibole represents Libby amphibole and actinolite-tremolite fibers. C opyright © 2011 SciRes. JEP  Libby Amphibole Contamination in Tree Bark Surrounding Historical Vermiculite Processing Facilities1067 6. Acknowledgements Special thanks to Anna Ristich at ALS Laboratories in Cincinnati, OH. The majority of the work was supported by an NIH COBRE grant p20-RR017670. REFERENCES [1] U. S. Environmental Protection Agency (EPA), “Libby Asbestos Background,” 2006. http://www.epa.gov/region8/superfund/libby/lbybkgd.html [2] J. T. Pardee and E. S. Larsen, “Deposits of Vermiculite and Other Minerals in the Rainy Creek District, Near Libby, Montana,” USGS Bull, Vol. 805, 1929, pp. 17-28. [3] G. P. Meeker, A. M. Bern, I. K. Brownsfield, H. A. Low- ers, S. J. Sutley, T. M. Hoefen, et al., “The Composition and Morphology of Amphiboles from the Rainy Creek Complex, near Libby, Montana,” American Mineralogist, Vol. 88, No. 2, 2003, pp. 1955-1969. [4] J. C. McDonald, A. D. McDonald, B. Armstrong and P. Sebastien, “Cohort study of Mortality of Vermiculite Mi- ners Exposed to Tremolite,” British Journal of Industrial Medicine, Vol. 43, 1986, pp. 436-444. [5] H. E. Amandus and R. Wheeler, “The Morbidity and Mor- tality of Vermiculite Miners and Millers Exposed to Yre- molite-Actinolite: Part II. Mortality,” American Journal of Industrial Medicine, Vol. 11, No. 1, 1987, pp. 15-26. doi:10.1002/ajim.4700110103 [6] H. E. Amandus, P. E. Wheeler, J. Jankovic and J. Tucker, “The Morbidity and Mortality of Vermiculite Miners and Millers Exposed to Tremolite-Actinolite: Part I. Exposure Estimates,” American Journal of Industrial Medicine, Vol. 11, No. 1, 1987, pp. 1- 14. doi:10.1002/ajim.4700110102 [7] L. A. Peipins, “Radiographic Abnormalities and Expo- sure to Asbestos Contaminated Vermiculite in the Com- munity of Libby, Montana, USA,” Environmental Health Perspectives, Vol. 111, No. 14, 2003, pp. 1753-1759. doi:10.1289/ehp.6346 [8] T. Ward, T. Spear, J. Hart, C. Noonan, A. Holian, M. Getman and J. Webber, “Trees as Reservoirs for Amphi- bole Fibers in Libby, Montana,” Science of the Total En- vironment, Vol. 367, No. 1, 2006, pp. 460-465. doi:10.1016/j.scitotenv.2006.03.041 [9] U. S. Environmental Protection Agency (EPA), “Asbes- tos Levels in Tree Bark,” Project Number: 0100-008-900, 2008. [10] J. F. Hart, T. J. Ward, T. M. Spear, K. Crispen and T. R. Zolnikov, “Evaluation of Amphibole Exposures during Firewood-Harvesting Simulations in Libby, MT, USA— Preliminary Data,” The Annals of Occupational Hygiene, Vol. 51, No. 8, 2007, pp. 1-7. [11] T. J. Ward, J. F. Hart, T. M. Spear, J. B. Meyer and S. J. Webber, “Fate of Libby Amphibole Fibers When Burning Contaminated Firewood,” Environmental Science Tech- nology, Vol. 43, No. 8, 2009, pp. 2878-2883. doi:10.1021/es802817w [12] J. F. Hart, T. M. Spear, T. J. Ward, et al., “An Evaluation of Potential Occupational Exposure to Asbestiform Am- phiboles near a Former Vermiculite Mine,” Journal of Environment and Public Health, Vol. 2009, 2009, Article ID: 189509. [13] Agency for Toxic Substances and Disease Registry (ATSDR), “Exposure to Asbestos-Containing Vermiculite from Libby, Montana,” Summary Report, 29 October 2008, accessed 3 May 2010. http://www.atsdr.cdc.gov/asbestos/sites/national_map/Su mmary_Report_102908.pdf [14] U. S. Environmental Protection Agency (EPA), “Vermi- culite Processing,” Clearinghouse for Inventories and Emission Factors, Chapter 11: Mineral Products Industry, 5th Edition, Vol. 1, 2006. [15] Health Consultation Exposure Assessment, “Western Mi- neral Products Site, City of Minneapolis, Minnesota,” The Minnesota Department of Health, 2003. [16] Agency for Toxic Substances and Disease Registry (ATSDR), “Vermiculite Northwest—Spokane WA,” accessed 7 May 2010. http://yosemite.epa.gov/R10/cleanup.nsf/0/717834e601dc e8cd8825762d0072baad? [17] Agency for Toxic Substances and Disease Registry (ATSDR), “Fact Sheet,” Santa Ana, accessed 10 May 2010. http://www.atsdr.cdc.gov/asbestos/sites/national_map/fac t_sheets/santaanaca.html [18] Agency for Toxic Substances and Disease Registry (ATSDR), “Fact Sheet,” Newark, accessed 12 May 2010. http://www.atsdr.cdc.gov/asbestos/sites/national_map/fac t_sheets/newarkca.html [19] Agency for Toxic Substances and Disease Registry (ATSDR), “Fact Sheet,” Phoenix, accessed 14 May 2010. http://www.atsdr.cdc.gov/asbestos/sites/national_map/fac t_sheets/pdf/WR%20%20Grace%20--%20Solomon%27s %20Mines_HC_FINAL.pdf [20] U. S. Environmental Protection Agency (EPA), “40 Code of Federal Regulations: Part 763,” The Federal Register, Vol. 52, 1987, pp. 41826-41905. [21] H. Schulz, P. Popp, G. Huhn, H.-J. Stark and G. Schuur- mann, “Biomonitoring of Airborne Inorganic and Organic Pollutants by Means of Pine Tree Barks. I. Temporal and Spatial Variations,” Science of the Total Environment, Vol. 232, No. 1-2, 1999, pp. 49-58. doi:10.1016/S0048-9697(99)00109-6 [22] P. J. Clarkson, D. Larrazabal-Moya, I. Staton, C. W. Mc- Leod, D. B. Ward, V. N. Sharifi and J. Swithenbank, “The Use of Tree Bark as a Passive Sampler for Poly- chlorinated Dibenzo-P-Dioxins and Furans,” Interna- tional Journal of Environmental Analytical Chemistry, Vol. 82, No. 11-12, 2002, pp. 843-850. doi:10.1080/0306731021000102301 [23] A. Sturaro, G. Parvoli and L. Doretti, “Plane Tree Bark as a Passive Sampler of Polycyclic Aromatic Hydrocarbons in an Urban Environment,” International Journal of En- vironmental Analytical Chemistry, Vol. 643, No. 11-12, 1993, pp. 435-438. doi:10.1016/0021-9673(93)80580-2 [24] M. L. Meredith and R. A. Hites, “Polychlorinated Bi- phenyl Accumulation in Tree Bark and Wood Growth Copyright © 2011 SciRes. JEP  Libby Amphibole Contamination in Tree Bark Surrounding Historical Vermiculite Processing Facilities 1068 Rings,” Environmental Science Technology, Vol. 21, No. 7, 1987, pp. 709-712. doi:10.1021/es00161a013 [25] M. H. Hermanson and R. A. Hites, “Polychlorinated Bi- phenyls in Tree Bark,” Environmental Science Technol- ogy, Vol. 24, No. 1, 1990, pp. 666-671. doi:10.1021/es00075a008 [26] M. H. Hermanson and G. W. Johnson, “Polychlorinated Biphenyls in Tree Bark near a Former Manufacturing Plant in Anniston, Alabama,” Chemosphere., Vol. 68, No. 1, 2007, pp. 191-198. doi:10.1016/j.chemosphere.2006.11.068 [27] S. L. Simonich and R. A. Hites, “Relationships between Socioeconomic Indicators and Concentrations of Organo- chlorine Pesticides in Tree Bark,” Environmental Science Technology, Vol. 31, No. 4, 1997, pp. 999-1003. doi:10.1021/es9604020 [28] J. C. McDonald and R. A. Hites, “Radial Dilution Model for the Distribution ofToxaphene in the United States and Canada on the Basis of Measured Concentrations in Tree Bark,” Environmental Science Technology, Vol. 37, No. 3, 2003, pp. 475-481. doi:10.1021/es020707g [29] M. Belivermis, O. Kilic, Y. Cotuk, S. Topcuoglu, G. Kalayci and D. Pestreli, “The Usability of Tree Barks as Long Term Biomonitors of Atmospheric Radionuclide Deposition,” Appled Radiation and Isotopes, Vol. 68, No. 12, 2010, pp. 2433-2437. doi:10.1016/j.apradiso.2010.07.010 [30] M. Zhiyanski, M. Sokolovska, J. Bech, A. Clouvas, I. Penev and V. Badulin, “Cesium-137 Contamination of Oak (Quercus Petrae Liebl.) from Sub-Mediterranean Zone in South Bulgaria,” J. of Environmental Radioactiv- ity, Vol. 101, No. 10, 2010, pp. 864-868. doi:10.1016/j.jenvrad.2010.05.011 [31] E. I. H. Siwik, L. M. Campbell and G. Mierle, “Distri- bution and Trends of Mercury in Deciduous Tree Cores,” Environmental Pollution, Vol. 158, No. 6, 2010, pp. 2067-2073. doi:10.1016/j.envpol.2010.03.002 [32] S. Celik, E. Yucel, S. Celik, S. Gucel and M. Ozturk, “Carolina Poplar (Populus x Canadensis Moench) as a Biomonitor of Trace Elements in Black Sea Region of Turkey,” Journal of Environmental Biology, Vol. 31, No. 1-2, 2010, pp. 225-232. [33] A. M. G. Pacheco and M. D. Freitas, “Trace-Element Enrichment in Epiphytic Lichens and Tree Bark at Pico Island, Azores, Portugal,” Journal of the Air & Waste Management Association, Vol. 59, No. 4, 2009, pp. 411- 418. [34] H. N. Sedumedi, K. L. Mandiwana, P. Ngobeni and N. Panichev, “Speciation of Cr (VI) in Environmental Sam- ples in the Vicinity of the Ferrochrome Smelter,” Journal of Hazardous Materials, Vol. 172, No. 2-3, 2009, pp. 1686-1689. doi:10.1016/j.jhazmat.2009.07.111 [35] M. Catinon, S. Ayrault, R. Clocchiatti, O. Boudouma, J. Asta, M. Tissut and P. Ravanel, “The Anthropogenic Atomspheric Elements Fraction: A New Interpretation of Elemental Deposits on Tree Barks,” Atmospheric Envi- ronment, Vol. 43, No. 5, 2009, pp. 1124-1130. doi:10.1016/j.atmosenv.2008.11.004 [36] M. Conkova and J. Kubiznakova, “Lead Isotope Ratios in Tree Bark Pockets: An Indicator of Past Air Pollution in the Czech Republic,” Science of the Total Environment, Vol. 404, No. 2-3, 2008, pp. 440-445. doi:10.1016/j.scitotenv.2008.04.025 [37] M. Batarseh, A. Ziadat, M. Al-Alawi, B. Berdanier and A. Jiries, “The Use of Cypress Tree Bark as an Environ- mental Indicator of Heavy Metals Deposition in Fuheis City, Jordan,” Inter. J. of Environ. And Pollution, Vol. 33, No. 2-3, 2008, pp. 207-217. doi:10.1504/IJEP.2008.019394 [38] A. M. G. Pacheco, M. C. Freitas, M. S. Baptista, M. T. S. D. Vasconcelos and J. P. Cabral, “Elemental Levels in Tree Bark and Epiphytic-Lichen Transplants at a Mixed Environment in Mainland Portugal, and Comparisons with an in Situ Lichen,” Environmental Pollution, Vol. 151, No. 2, 2008, pp. 326-333. doi:10.1016/j.envpol.2007.06.038 [39] M. Al-Alawl, M. Batarseh, H. Carreras, M. Alawi, A. Jiries and S. M. Charlesworth, “Aleppo Pine Bark as a Blomonitor of Atmospheric Pollution in the Arid Envi- ronment of Jordan,” Clean-Soil Air Water, Vol. 35, No. 5, 2007, pp. 438-443. doi:10.1002/clen.200720017 [40] Y. L. Zhao, L. M. Yang and Q. Q. Wang, “Modeling Persistent Organic Pollutant (POP) Partitioning between Tree Bark and Air and Its Application to Spatial Moni- toring of Atmospheric POPs in Mainland China,” Envi- ronmental Science Technology, Vol. 42, No. 16, 2008, pp. 6046-6051. [41] A. G. Wylie and J. R. Verkouteren, “Amphibole Asbestos from Libby, Montana, Aspects of Nomenclature,” Ame- rican Mineralogist, Vol. 85, No. 10, 2000, pp. 1540-1542. [42] M. E. Gunter, D. M. Dyar, B. Twamley, F. F. Foit Jr and S. Cornelius, “Composition, Fe3+/Fe, and Crystal Struc- ture of Non-Asbestiform and Asbestiform Amphiboles from Libby, Montana, USA,” American Mineralogist, Vol. 89, No. 10, 2003, pp. 1579-1579. [43] R. F. Dodson and S. P. Hammar, “Asbestos: Risk Assess- ment, Epidemiology, and Health Effects,” Taylor & Francis Group, Boca Raton, 2006. [44] U.S. Government Accountability Office (USGAO), “EPA Assessment of Sites that may have Received Asbestos Contaminated Ore from Libby, Montana,” GAO-09-7SP, March 2009, accessed 10 May 2011. http://www.gao.gov/special.pubs/gao-09-7sp/#scope [45] W. M. Ewing, “Further Observations of Settled Asbestos Dust in Buildings,” In: M. E. Beard and H. L. Rook, Eds., Advances in Environmental Methods for Asbestos, ASTM STP 1342, Philadelphia, 2000. [46] J. L. Adgate, “Modeling Community Asbestos Exposure near a Vermiculite Processing Facility: Impact of human Activities on Cumulative Exposure,” Journal of Exposure Science and Environmental Epidemiology, Vol. 21, 2011, pp. 529-535. doi:10.1038/jes.2011.8 C opyright © 2011 SciRes. JEP
|