 Journal of Environmental Protection, 2011, 2, 1118-1126 doi:10.4236/jep.2011.28130 Published Online October 2011 (http://www.scirp.org/journal/jep) Copyright © 2011 SciRes. JEP Environmental Distribution of the Radon in a Heavily Populated Area: Preliminary Hazard Evaluation and Inference on Risk Factors in Pescara, Central Italy Francesco Stoppa Dipartimento di Scienze, Università G. D’Annunzio, Chieti, Pescara, Italy. Email: fstoppa@unich.it Received June 29th, 2011; revised August 11th, 2011; accepted September 25th, 2011. ABSTRACT The presence of ionizing sources is a high-risk condition if related to a poor management of the hygiene and health of the anthropic environment. Increased hazard derives from the addition of artificial sources to natural sources and the consequent possible late occurrence of epidemic cancer. Therefore, the expenses for medical treatments and potential losses of human lives are thought to be relevant. Although the role of natural exposure is still poorly assessed, it is rea- sonable that it accounts for a chronic hazard, while the artificial one may constitute an acute hazard. In theory, the medium and large-scale monitoring of the Radon is simple and can be applied in detail to sensible targets. However, mitigation of Radon risk is particularly complex due to the intrinsic structural vulnerability of the urban environment and the general lack of epidemiological data that constrain the extent of specific biological damage. In Italy was sug- gested a limit to the exposure in working place, instead limits for other private and public facilities are not well estab- lished. Despite legal advice, the sensitivity of the social system is low due to the elusive nature of the Radon hazard, and the case considered in this paper account for unpreparedness of the Sanitary and Environmental Authorities when fac- ing to a possible crisis. A monitoring field survey revealed Radon concentrations of at least three times higher than that expected geologically in a fairly localized area of Pescara, Central Italy. The values are about 25 - 30 times the maxi- mum allowed in the buildings. However, these measures are underground and average indoor values in the area were still acceptable. The measures repeated after a year confirms an upward tendency of the previous values. However, it was not possible to go deeper in the investigation about the nature of this underground anomaly because of the strong opposition of some members of the Environmental and Sanitary Authorities. Some rumours filtered by one of this Insti- tution, suggesting a possible correlation of the anomaly with the uncontrolled disposal of radio-iridium needles used in the nearby hospital. A further legal action instructed against the Author discouraged the publication of the data so far. This account for a situation of increased risk. Even if hazardous natural Radon emissions can be investigated, it is dif- ficult to evaluate vulnerability factors related to non-natural diffusion of radio-nuclides progenitors of the Radon (i.e. uranium and radium). Confidence on notional calculation of the hazard by means of algorithms, decreases the alert threshold and promotes the potentially involved authorities to discourage further studies. This increases the vulnerabil- ity of the system. Due to negligence and violation of safety norms in Italy, accidents involving ionization agent disper- sion in the environment are likely and are an instructive study case. The result of this study may promote mitigation actions and, hopefully, a decrease of the radioactivity risk in a populated area. This paper is intended as a case history depicting unexpected Radon distribution in a city. In these conditions, the density of population and the system un- awareness contribute greatly to raise the risk especially if a natural explanation could not find. The suspect of an artifi- cial source, far more hazardous than natural Radon itself, is still up for the investigated area. Keywords: Radioactive Pollution, Radon Measurements, Radon Distribution, Radon Risk Analysis, Pescara-Italy 1. Introduction This Radon is an important contributor to the natural environmental radioactivity. Among the 26 known iso- topes of the Radon the most important is the 222Rn, which has a mean lifetime of 5.517 days. The short half-life of 222Rn is 3.82 days, a fact which precludes slow transport over great distances, and this make important its near- 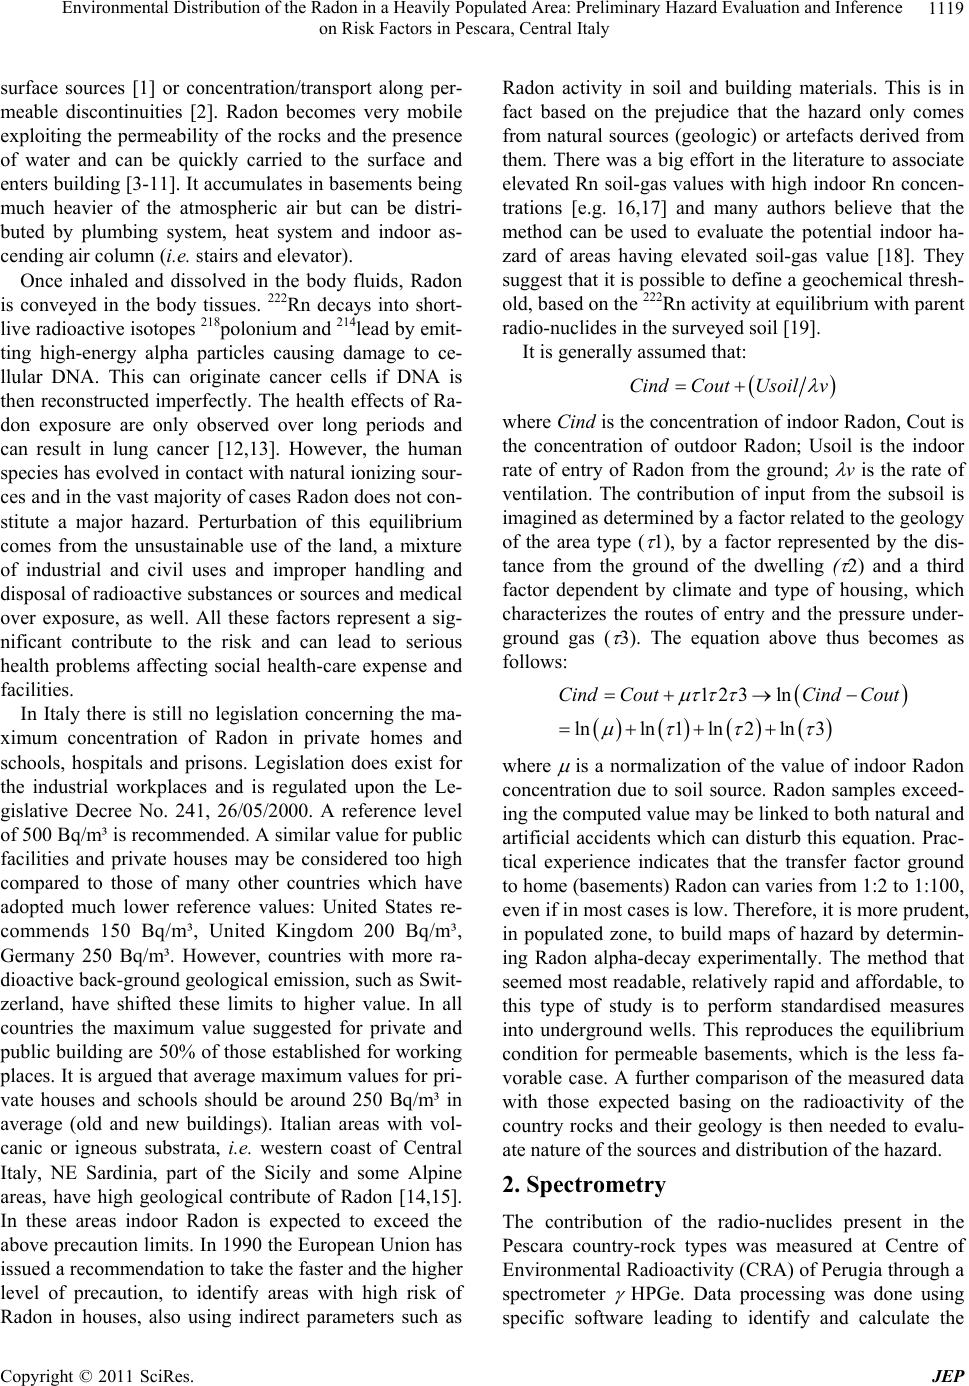 Environmental Distribution of the Radon in a Heavily Populated Area: Preliminary Hazard Evaluation and Inference 1119 on Risk Factors in Pescara, Central Italy surface sources [1] or concentration/transport along per- meable discontinuities [2]. Radon becomes very mobile exploiting the permeability of the rocks and the presence of water and can be quickly carried to the surface and enters building [3-11]. It accumulates in basements being much heavier of the atmospheric air but can be distri- buted by plumbing system, heat system and indoor as- cending air column (i.e. stairs and elevator). Once inhaled and dissolved in the body fluids, Radon is conveyed in the body tissues. 222Rn decays into short- live radioactive isotopes 218polonium and 214lead by emit- ting high-energy alpha particles causing damage to ce- llular DNA. This can originate cancer cells if DNA is then reconstructed imperfectly. The health effects of Ra- don exposure are only observed over long periods and can result in lung cancer [12,13]. However, the human species has evolved in contact with natural ionizing sour- ces and in the vast majority of cases Radon does not con- stitute a major hazard. Perturbation of this equilibrium comes from the unsustainable use of the land, a mixture of industrial and civil uses and improper handling and disposal of radioactive substances or sources and medical over exposure, as well. All these factors represent a sig- nificant contribute to the risk and can lead to serious health problems affecting social health-care expense and facilities. In Italy there is still no legislation concerning the ma- ximum concentration of Radon in private homes and schools, hospitals and prisons. Legislation does exist for the industrial workplaces and is regulated upon the Le- gislative Decree No. 241, 26/05/2000. A reference level of 500 Bq/m³ is recommended. A similar value for public facilities and private houses may be considered too high compared to those of many other countries which have adopted much lower reference values: United States re- commends 150 Bq/m³, United Kingdom 200 Bq/m³, Germany 250 Bq/m³. However, countries with more ra- dioactive back-ground geological emission, such as Swit- zerland, have shifted these limits to higher value. In all countries the maximum value suggested for private and public building are 50% of tho se established for working places. It is argued that average maximum values for pri- vate houses and schools should be around 250 Bq/m³ in average (old and new buildings). Italian areas with vol- canic or igneous substrata, i.e. western coast of Central Italy, NE Sardinia, part of the Sicily and some Alpine areas, have high geological contribute of Radon [14,15]. In these areas indoor Radon is expected to exceed the above precaution limits. In 1990 the European Union has issued a recommendation to take the faster and the higher level of precaution, to identify areas with high risk of Radon in houses, also using indirect parameters such as Radon activity in soil and building materials. This is in fact based on the prejudice that the hazard only comes from natural sources (geologic) or artefacts derived from them. There was a big effort in the literature to associate elevated Rn soil-gas values with high indoor Rn concen- trations [e.g. 16,17] and many authors believe that the method can be used to evaluate the potential indoor ha- zard of areas having elevated soil-gas value [18]. They suggest that it is possible to define a geochemical thresh- old, based on the 222Rn activity at equilibrium with parent radio-nuclides in the surveyed soil [19]. It is generally assumed that: CindCoutUsoil v where Cind is the concentration of indoor Radon, Cout is the concentration of outdoor Radon; Usoil is the indoor rate of entry of Radon from the ground; v is the rate of ventilation. The contribution of input from the subsoil is imagined as determined by a factor related to the geology of the area type ( 1), by a factor represented by the dis- tance from the ground of the dwelling ( 2) and a third factor dependent by climate and type of housing, which characterizes the routes of entry and the pressure under- ground gas ( 3). The equation above thus becomes as follows: 123 ln lnln 1ln2ln3 CindCoutCind Cout where is a normalization of the value of indoor Radon concentration due to soil source. Radon samples exceed- ing the computed valu e may be lin k ed to both natural an d artificial accidents which can disturb this equation. Prac- tical experience indicates that the transfer factor ground to home (basements) Radon can varies from 1:2 to 1:100, even if in most cases is low. Therefore, it is more prudent, in populated zone, to build maps of hazard by determin- ing Radon alpha-decay experimentally. The method that seemed most readable, relatively rapid and affordable, to this type of study is to perform standardised measures into underground wells. This reproduces the equilibrium condition for permeable basements, which is the less fa- vorable case. A further comparison of the measured data with those expected basing on the radioactivity of the country rocks and their geology is then needed to evalu- ate nature of the sources and distribution of the hazard. 2. Spectrometry The contribution of the radio-nuclides present in the Pescara country-rock types was measured at Centre of Environmental Radioactivity ( CRA) of Perugia through a spectrometer HPGe. Data processing was done using specific software leading to identify and calculate the Copyright © 2011 SciRes. JEP  Environmental Distribution of the Radon in a Heavily Populated Area: Preliminary Hazard Evaluation and Inference on Risk Factors in Pescara, Central Italy Copyright © 2011 SciRes. JEP 1120 corresponding activities of radio-nuclides in the sample (Table 1). In terms of relative error ( ): (activitypeakareaefficiency21 2 Uncertainty of measurements derive from interpolation of the efficiency curve which depends on the uncertainty of the activity of the calibration sour ces and the fitting of the peaks. the magnitude of which is approximately equal to: eakarea2.3%1%2% efficiency . Four rock-types have been selected as representative Table 1. Radioactive nuclides content and activity for rock-types representative of the substrate of the city of Pescara and building materials. Measurements indicate d both as Bq/kg and ppm. Sample 238U 232Th 40K Bq/kg % Bq/kg % Bq/kg % Beach sand 214Pb 14.68 2.30 228Ac 10.20 5.20 342 1.10 214Bi 13.30 2.60 212Pb 12.95 2.10 212Bi 13.47 10.50 208Tl 17.63 3.40 Average 13.99 13.56 ppm 1.13 3.36 1.32 Pleistoc. sand 214Pb 42.65 1.10 228Ac 20.66 2.70 436 1.00 214Bi 39.83 1.10 212Pb 24.63 1.50 212Bi 24.74 9.50 208Tl 28.15 2.80 Average 41.24 24.55 ppm 3.34 6.08 1.69 Silt 214Pb 32.92 1.60 228Ac 30.06 2.60 587 1.00 214Bi 29.46 1.30 212Pb 34.01 1.20 212Bi 33.25 5.60 208Tl 38.38 2.40 ppm 2.53 8.40 2.27 Clay 214Pb 47.43 1.10 228Ac 27.77 2.50 496 1.00 214Bi 42.40 1.00 212Pb 32.06 1.10 212Bi 33.46 6.60 208Tl 34.19 2.30 Average 44.92 31.87 ppm 3.64 7.89 1.92 Limestone 214Pb 9.17 1.51 228Ac 1.66 7.25 6.57 8.52 214Bi 8.40 1.22 212Pb 2.89 2.90 212Bi 2.68 17.28 208Tl 6.80 2.94 Average 8.79 3.51 ppm 0.71 0.87 0.03 Gypsum 214Pb 58.91 0.80 228Ac 1.13 36.0 4.86 214Bi 52.01 0.76 212Pb 4.97 5.14 212Bi 3.98 27.57 208Tl 8.82 4.64 Average 55.46 4.73 ppm 4.50 1.17 0.14  Environmental Distribution of the Radon in a Heavily Populated Area: Preliminary Hazard Evaluation and Inference 1121 on Risk Factors in Pescara, Central Italy of the main stratigraphic units forming the substrate of the city of Pescara. Beach sand (sand 1) that commonly forms the coastal plain, Pleistocene sand (sand 2) and marine clay that form the hills and silts that form the Pescara river alluvial plain. Limestone and gypsum sam- ples from the Pescara province area have been measured only for reference to building materials. The Table 1 sets out the measures obtained with the spectrometer. Mea- surements are indicated both in Bq/kg and in ppm. The natural content of 238U, 232Th and 40K was determined to understand how much they take part in the radioactivity of the samples. The values obtained by spectrometry were plotted constructing curves of correlation between the rock types and their natural content of 238U, 232Th, and 40K (Figure 1). Limestone is always low in radionuclides. Gypsum is high in 238U but low in 232Th and 40K. 238U is the biggest and ubiquitous contributor to total radioactivity in the Pescara rocks. 232Th and 40K are important only in clay and silt. There is a constant increase in the radionuclide contents passing through beach-sand, Pleistocene sand, clay and silt. Figure 1. Radionuclide content of Pescara rock types ex- pressed in ppm. The values obtained by spectrometry were plotted putting the rock in order of increasing content of 238U, 232Th, and 40K. 3. Measures of Environmental Radon The measure stations were distributed in all districts of the city, making measures of all the geological units with a sufficient number of stations and in different locations spaced not more than 1 km in a straight line. Most of the stratigraphic units of Pescara are heterogeneous and con- sist of several rock types. It was analyzed the most abundant and representative rock type for each unit. Me- dium and long term environmental measures on site con- sist of a PVC pipe with inside diameter of 64 mm and 1.5 m long. The pipe has an open end that is buried to a depth of one meter while the other end is fitted with a screw back with gasket. The measurements were carried out in dry and sealed pipe condition. The dosimeters consist of cellulose-nitrate film sensitive to -radiation energies lower than 4 MeV. The dosimeters were put in the pipe suspended halfway after a convenient time ne- cessary to equilibrate the air in the pipe with that in the ground. The dosimeters we re recov ered af ter an exposu r e time of 168 hours and protected by further exposure to Radon and quickly processed for counting. Even if for outdoor measurements time is considerably greater we consider this method is suitable in approximating indoor measurement conditions. radiation emitted by 222Rn and its decay products 218Po and 210Po, with energies of 5:49, 6 and 7.69 MeV respectively, cause damage tracks along the route taken in the film of cellulose nitrate. An alkaline bath is used to improve the tracks before their counting. To estimate the co ncentration of 222Rn from the detector, the density of the traces must be divided by the calibration factor E and h exposure time: 3 6.5 CiREhBq m. The method [20] has an uncertainty which gets less than 20% for values > 50 Bq/m3. The unit of measure- ment of radiation is the Curie, wh ich is equivalent to 3.7 × 10¹⁰ disintegrations per second, but for the Radon has been widely used the Becquerel (Bq) which is equivalent to one disintegration per second. The area of the municipality of Pescara can be divid ed into four main lithostratigraphic zones having different average concentration of Radon. Table 2 shows the num- ber of disintegration tracks and the calculated concentra- tion of the undergroun d measures made in the above rock types. Four outdoor measures performed for reference in the Pescara area gave constant values of 4 Bq/m3 which are below the detection method. Underground values are always well up the detection limit and range from near 100 to >7400 Bq/m3. Intervals of 500 Bq/m3 are here considered significantly different Copyright © 2011 SciRes. JEP  Environmental Distribution of the Radon in a Heavily Populated Area: Preliminary Hazard Evaluation and Inference 1122 on Risk Factors in Pescara, Central Italy Table 2. Underground radon me asur ement. Measure station Average tracks Bq/m3 39 240 721 40 290 702 43 375 1061 42 110 333 41 2145 7391 4 143 504 2 1355 4525 11 643 2203 37 940 2609 48 546 1784 31 34 103 35 56 164 30 496 1661 24 343 1104 36 850 2881 26 17 55 18 484 1608 21 133 437 14 31 114 23 1345 4419 45 164 526 34 144 456 38 585 1779 47 20 46 33 906 2760 49 34 107 32 39 116 3 589 2049 1 1049 3539 25 239 715 46 740 2528 29 921 2952 27 676 2142 44 11 24 22 1040 3447 19 394 1365 13 325 1144 20 1138 3946 5 125 403 18 553 1750 6 669 2386 12 306 1038 15 125 431 among measure groups and are shown in term of fre- quency in Figure 2. Most of the measures with values below 500 Bq/m3 (30% of the total) are from the coastal plain. This reflects a low content of Radon parent iso- topes, efficient exchange between porous soil and at- mosphere due to tide oscillations. The values of concentration between 500 and 3000 Bq/m3 account for 60% of the total of the measures and is a range representative of the Pescara country rocks α- emission (2318 Bq/m3). Values from 3000 to 5000 Bq/m3 show a sharp decrease and account for about 10% of the measures. This general distribution is considered readable because there is a good correlation between the content of radioactive isotopes and the underground α- emission by means of a reasonable statistical distribu- tion. Average values of Bq/m3 for the 4 main stratigraphyc units of Pescara city area are: A Holocene seashore- sands and fossil dunes with an average concentration of 718 Bq/m3, B Holocene silts, average 2376 Bq/m3, C Pleistocene sands, average 3008 Bq/m3, D Pleistocene clay average 1570 Bq/m3. These averages do not corre- spond neatly to their natural radio nuclides contents. Clay has the highest radionuclide content (Figure 1) but an average Radon activity which is lower then Peisto- cene sends that are lower in radionuclides. However, beach sand radon activity is in good agreement. Average Radon values of silt also fit in well with average radionu- clide contents. Variation in the same geological unit could be related to a variable quantity of water which is the second most important factor in Radon distribution after the abundance of parent radioactive isotopes. There is a significant gap of measures between 5000 and 7000 Figure 2. 500 Bq/m3 intervals of underground Radon values are shown in term of their frequency (numbers of meas- ure/station). Unit A Holocene sands (blue), Unit B Holocene silts (yellow), Unit C Pleistocene sands (brown), Unit D Pleistocene cla y (green ). C opyright © 2011 SciRes. JEP  Environmental Distribution of the Radon in a Heavily Populated Area: Preliminary Hazard Evaluation and Inference 1123 on Risk Factors in Pescara, Central Italy Bq/m3 explainable with the general absence of high ra- dioactive soils in Pescara area. The values above 7000 Bq/m3 which are well outside of the range for Pescara Radon value, refer to measures located in a relatively small area of the city. In this area, measures have been repeated twice in two different holes. It was checked if there was artefacts on the surface or underground which may influence the measure. We did not find any visible source of radioactivity or able to concentrate locally Radon. The measures proved to be real. 4. Distribution of Radioactivity The map of the concentration curves, constructed by the method of linear interpolation of triangles, is the fastest way to visualise the broad distribution of gas Radon near the interface rock-atmosphere (Figure 3(a)). It may be expected that isochemical curves envelop and soften the cumulate effects due to local rock-type distribution, posi- tion of the underground water table, presence of geo- logical discontinuities and other possible sources. This preliminary map is only for a general Radon h azard eva- luation. However, is easy to read and understandable to non-geochemists and of practical use to orientate further investigation. It can enter in the management of the ur- ban land-use planning. It can be used as a first order layer in the risk assessment wh en overlapped by a popu- lation density/age and/or quality and vulnerability of the building, public or private use and other sensible risk factor. Starting from the coastline and moving up hill is seen that the concentration values increase towards inland. There is a regular incr ease from 500 to 3500 Bq/m3 pass- ing through unit A, D and C in the north part that goes from the border with the town of Montesilvano up the hill of Madonna (Figure 3(a)). Isochemical curves are somewhat parallel to the geological formation bounda- ries. A similar situation is seen to the south of the city next to the border with Francavilla al Mare municipality where values passes from 500 to 4000 Bq/m3 within a few thousand meters going from the beach of San Silvestro to San Silvestro hill near the Vallelunga ditch (Figure 3(a)). In the alluvial valley, in the unit B area, th e grad ien t of the curves is very different north and south of the Pe- scara River due to a large pick of Radon in the north sec- tion. A rather complex pattern Radon distribution with a maximum located between the Pescara Hospital, the Pescara River and Fosso Grande creek, which extends towards Villa Raspa. The Pescara river seem to limit the anomaly resulting in an accumulation of isochemical curves which become parallel passing from 500 on the (a) (b) Figure 3. (a): The map of the concentration curves, constru- cted by the method of linear interpolation of triangles, is the fastest way to visualize the broad distribution of gas Radon near the interface soil-atmosphere; (b): Detail of Figure 3(a) showing the Radon isochemical curves in Bq/m3 in the “hot spot” located SW of the Pescara hospital. right bank to over 7000 Bq/m3 on the left bank of the river. The isochemical curves change abruptly from N-S direction to a E-W direction. The situation change s in the Copyright © 2011 SciRes. JEP  Environmental Distribution of the Radon in a Heavily Populated Area: Preliminary Hazard Evaluation and Inference 1124 on Risk Factors in Pescara, Central Italy south bank of the river which in co ntrast show s the low er concentrations throughout the B unit, with a maximum represented by the curve 2000, which has a very limited extent. In addition, the area show relative minimum bounded by the isochemical curve 500, near Fontanelle area (Figure 3(a)). Four main features rise from the isochemical map analyses, a general overlap of Radon measures in the 4 stratigraphic units, the low value related to the co ast line and recent alluvial plain, the influence of the river and the presence of a Radon peak which is not related to a particular geological feature. The data collected and pre- sented are too limited to allow the sure statement of the origin of the distribu tion but allow so me general assump- tions. 5. Discussion about the Origin of the Pescara Positive Anomaly There are some hypothetical natural causes that can ex- plain such an anomaly. These include the concentration of natural radio-nuclides by reduction in organic com- plexes or accumulation of radioactive heavy minerals. The substrate in which the measurements were made is of silico-clastic nature thus the possible presence of de- tritus of radioactive minerals is compatible with the allu- vial depositional environment of river Pescara. However, in the Pescara river basin there are not rocks that may contain sensible radio-nuclides or that can be related to high values of un derground R a do n. Among more obvious anthropic sources of radioactive pollution, two are more likely in the investigated area: radio-nuclides used in lightning rods to improve field of ionization and radioactive sticks used in the treatment of the cancer. A radioactive lightning rod has a radioactive substance inside the metal tip, mainly 226Radio that is capable to emit harmful radiation for centuries. Radioactive tip has the task to ionize the air and then makes it conductiv e to capture lightning in a larger radius from the lightning rod itself. The installation of radioactive lightning rods in Italy began in 1945, when at least a dozen construction companies were born. They were installed until the 1981when legislation completely prohibited the use in Italy. Unfortunately, their disposal is still ongoing, it is estimated that some thousand are still in use but perhaps even more. It is quite difficult to distinguish radioactive lighting rods from the others. The more critical point is that we don’t know how many and where the dismissed radioactive r o d s were dispose d. Interstitial radiation therapy involves the injection of radioactive preparations (radio, iridium) in the form of needles, wires or seeds in the cancer tissue: it has the advantage of concentrating high doses of radiation in a limited area and in a short time. It was largely used for local application in cancers of the mouth, tongue, skin, anus. The variant intra-cavity radiation therapy involves the insertion of interstitial radiation transmitters in the vagina or uterus, for example. It happened in the past that anti-cancer radio devices were misused. In some Abruzzi Hospitals, including that of Pescara, was re- ported lost of radio-iridio needles. When dispersed in the environment they suffer from rapid degradation and dis- integration. Highly radioactive particles can be carried by sewage disposals especially in uncontrolled waste. Can enter the river system and be transported down- stream by emitting large amounts of Radon and radioac- tivity. 6. Mitigation Regarding radioprotection considerations, the values mea - sured in boreholes or are not comparable with the in- doors one. The ground values (>7000 Bq/m3) are rela- tively low if compared with those of volcanic areas (such as Rome area) and would be significant in case of under- ground workplace (caves, mines, cellars, etc.). However, the combination of an unevaluated radioactive hazard, potentially unrelated to a natural source, in a densely populated area imply a serious risk which must be as- sessed and mitigated. Amount of the exposed value de- pends from extension and evolution of the radioactivity, and its acute or chronic release in the environment. The presence of a peak of radioactivity in the ground which is not immediately explained by geological causes puts a light on a potential risk that may extend beyond the indoor Radon in an area of the city of Pescara. The Pescara Radon hotspot, may suggest a possible emer- gence downstream of the Hospital and/or the Fossa Grande waste disposals located about 2.5 km WNW of the anomaly. Presence of highly active radionuclide ar- tefacts comport a bigger hazard than Radon itself. Part of the underground Radon in the future may also affect pri- vate homes and public buildings located in areas with a higher concentration of this radioactive ga s. The Radon anomaly lies in a densely populated resi- dential area (Figure 3(b)). In addition, there are sport centres, the city’s main hospital, a kindergarten and an elementary school. As mentioned, measures of indoor Radon in the schools seem reassuring, however, the na- ture of the hazard is not completely understood and a subsequent risk assessment should be made. A quantita- tive study at small-scale (1:5000) is required in con- structing seasonal isochemical card with the aim to cir- cumscribe the amount and nature of the goods and hu- man life exposure. Specific statistical data and insurance C opyright © 2011 SciRes. JEP  Environmental Distribution of the Radon in a Heavily Populated Area: Preliminary Hazard Evaluation and Inference 1125 on Risk Factors in Pescara, Central Italy data can be used but they would add a little considering the high population density. The vulnerability is a measure of non-response of a community to a possible radioactive treat. In a heavily built area is not easy to perform radioactivity survey. A major problem arose from the distrust of the inhabitants which are concerned about possible consequence of find radioactivity in their property. Th is non collaborative be- haviour has to be taken into account and suggest possible difficulties in mitigation preparedness. Vulnerability merges both geological and anthropogenic factors: soil permeability, water table oscillation and exchange with the river, ratio of outdoor/indoor and artificial/natural exposure. Vulnerability is increased by the lack of a his- torical analysis of the use of nearby suspicious site such as uncontrolled landfill and waste disposals or other in- dustrial uses. To our knowledge specific epidemiology of lung cancer, young-people leukaemia and other critical and potential Radon-related disease is not yet available. Previous experience about neglecting or misinterpreting the Radon data indicates that Authority and citizens awareness is very low. Nature of the hazard is complex and may be compli- cate. The present state of the art suggests that an uneva- luated radioactive pollution is possible. A Radon hazard certainly exists and has to be considered. Evaluation measures should comprise spectrometric analysis appa- ratus and speditive measure of Radon in the soil and wa- ter the extent and intensity of the anomaly. Also extend- ing the monitoring to the public and private buildings to evaluate entering ratio of indoor Radon. It would also be appropriate to combine measures of Radon with spec- trometry and in situ measurements of gamma exposure (boreholes) on soil and sweepings suspected of contami- nation, including coring operated in buried waste dispos- als. 7. Conclusions The distribution of the measures in the City of Pescara is mostly explainable with the natural contribute of radio- activity by Uranium, Thorium and K contents in the rocks. The general distribution reflects both surface mor- phology and substrate composition. The measures also show that this contribute is modified by the position of the underground wa ter table and sea shore. Th is situation does not account for the values located among the Pescara Hospital, the Pescara river and the Fosso Grande creek. This area falls within isochimichal curves between 5000 and 7000 Bq/m3. Those values are not observed or expected in the sedimentary rocks in Pescara area. Since the Radon anomaly corresponds to the underground sec- tion of the Fosso Grande, it is likely that this feature has role in the an omaly formation. Radon could be conve yed downstream from the waste disposal located along Fosso Grande creek. The vapor pressure in the underground section of Fosso Grande could facilitate the exchange with the adjacent underground water table or favour the penetration of the Radon in the soil. The ANPA (Agenzia Nazionale Protezione Ambiente, Italy) and CRR (Centro di Radioattività Regionale, Abruzzo) performed lately five measurements in well within an area roughly between the Hospital and the Pescara river. In 3 cases they found values above 7000 Bq/m3 with a maximum of 8974 Bq/m3, the other two measures gave lower values between 2200 and 5300 Bq/m3. The director of ANPA-CRR, G. Damiani sug- gested that these values were completely normal if com- pared with those obtained elsewhere for “glacial debris with fragments of granite, uranium-rich oil shale soils containing aluminum (sic!)”. However, none of these rocks exist in Pescara and Abruzzo. A series of events with legal implications, in fact paralyzed every effort to know more about the problem. The unpreparedness and lack of cooperation among research institutions, weak- ness of administrative control and negation of a potential problem demonstrate the high vulnerability of the social context. So the nature and distribution of the hazard re- mains unevaluated in an area which hosts a large hospital, several schools, a segment of a river park, tourist and sports facilities. This study demonstrates that this can lead to a substantial underestimation of the Radon risk in the Pe scara area. 8. Acknowledgements The Author is indebted with dr Alessandro Firmani, Prof. Rita Borio and Dr. Alba Rongoni of the Sezione di Fisica Sanitaria, Dipartimento di Scienze Radiologiche, Uni- versità di Perugia, and the Presidio Multizonale di Fisica Sanitaria di Pescara, for their help in the Radon survey. I am grateful to two anonymous referees whose comments improved very much the paper. Research was granted by ex 60% funds of G. d’Annunzio University. REFERENCES [1] W. W. Nero, “Radon Transport from Soil to Air,” Re- views of Geophysics, Vol. 30, No. 2, 1992, pp. 137-160. doi:10.1029/92RG00055 [2] T. K. Ball, D. G. Cameron, T. B. Colman and P. D. Rob- erts, “Behaviour of Radon in the Geological Environment: A Review,” Quarterly Journal of Engineering Geology, Vol. 24, No. 2, 1991, pp. 169-182. doi:10.1144/GSL.QJEG.1991.024.02.01 [3] N. R. Varley and A. G. Flowers, “Radon and Its Correla- tion with Some Geological Features of the South-West of Copyright © 2011 SciRes. JEP  Environmental Distribution of the Radon in a Heavily Populated Area: Preliminary Hazard Evaluation and Inference on Risk Factors in Pescara, Central Italy Copyright © 2011 SciRes. JEP 1126 England,” Radiation Protection Dosimetry, Vol. 45, No. 1-4, 1992, pp. 245-248. [4] N. R. Varley and A. G. Flowers, “Indoor Radon Predic- tion from Soil Gas Measurements,” Health Physics, Vol. 74, No. 6, 1998, pp. 714-718. doi:10.1097/00004032-199806000-00009 [5] G. M. Reimer, “Using Soil Gas Radon and Geology to Estimate Regional Radon Potential,” Radiation Protec- tion Dosimetry, Vol. 45, No. 1-4, 1992, pp. 219-221. [6] G. M. Reimer, “Reconnaissance Techniques for Deter- mining Soil-Gas Radon Concentrations: An Example from Prince Georges County, Maryland,” Geophysical Research Letters, Vol. 17, 1990, pp. 809-812. doi:10.1029/GL017i006p00809 [7] G. M. Reimer and L. C. S. Gundersen, “A Direct Correla- tion among Indoor Rn, Soil Gas Rn and Geology in the Reading Prong near Boyertown, Pennsylvania,” Health Physics, Vol. 57, No. 1, 1989, pp. 155-160. [8] L. C. S. Gundersen, G. M. Reimer, C. R. Wiggs and C. A. Rice, “Map Showing Radon Potential of Rocks and Soils in Montgomery County, Maryland,” U.S. Geological Survey Miscellaneous Field Studies, Map MF-2043, 1988. [9] S. D. Schery, D. H., Gaeddert and M. H. Wilkening, “Transport of Radon from Fractured Rocks,” Journal of Geophysical Research, Vol. 87, No. 4, 1982, pp. 2969-2976. doi:10.1029/JB087iB04p02969 [10] R. R. Schumann, “The Radon Emanation Coefficient: An Important Tool for Geological Radon Potential Estima- tions,” International Radon Conference Preprints, Den- ver, 20-22 September 1993, pp. 40-47. [11] T. M. Semkov, “The Role of Radium Distribution and Porosity in Radon Emanation from Solids,” Geophysical Research Letters, Vol. 17, No. 6, 1990, pp. 837-840. doi:10.1029/GL017i006p00837 [12] UNSCEAR, “Sources End Effects of Ionising Radiation,” Report to the General Assembly, UN, 1993. [13] C. Bowie and S. H. U. Bowie. “Radon and Health,” Lan- cet, Vol. 337, No. 8738, 1991, pp. 409-413. doi:10.1016/0140-6736(91)91177-V [14] G. Torri, D. Azimi-Garakani, O. C. Oppon, A. Piermattei, A. F. Susanna, J. L. Seidel, L. Tommasino and L. Ar- fanese, “Measurements of Soil and Indoor Radon in Italy. International Journal of Radiation Applications and In- strumentation,” Nuclear Tracks and Radiation Mea- surement, Vol. 15, No. 1-4, 1993, pp. 637-641. [15] G. Torri and V. Innocenzi, “Livello di Esposizione al Radon Nelle Principali Aree Metropolitane Italiane,” Servizio Controllo Radiazioni Ambiente. Agenzia per la prote- zione dell’ambiente e per i servizi tecnici, 2004. [16] USEPA, “A Citizen’s Guide to Radon,” 2nd Edition, The Guide to Protecting Yourself and Your Family from Ra- don, ANR-464, 1992. [17] G. Åkerblom, P. Anderson and B. Clavensjo, “Soil Gas Radon—A Source for Indoor Radon Daughters,” Radia- tion Protection Dosimetry, Vol. 7, 1984, pp. 49-54. [18] I. Badr, M. A. Oliver, G. L. Hendry and S. A. Durrani, “Determining the Spatial Scale of Variation in Soil Ra- don Values Using a Nested Survey and Analysis,” Radia- tion Protection Dosimetry, Vol. 49, 1993, pp. 433-442. [19] G. Åkerblom “Ground Radon: Monitoring Procedure in Sweden,” ‘JAG’ Disc. Meeting on Radon Workshop, Ge- ology, Environment, Technology, R. Astron. Soc., London, 12 February 1993. [20] A. Rannou, L. Jeanmaire, G. Tymen, A. Mouden, E. Naour, N. Parmentier and H. Renouard, “Use of Cellu- lose Nitrate as Radon and Radon Daughters Detectors for Indoor Measurements,” Iternational Journal of Radiation Applications and Instrumentation. Special Volume Solid State Nuclear Track Detectors Part D. Nuclear Tracks and Radiation Measurements, Vol. 12, No. 1-6, 1986, pp. 747-750.
|