 Journal of Environmental Protection, 2011, 2, 1009-1020 doi:10.4236/jep.2011.28116 Published Online October 2011 (http://www.scirp.org/journal/jep) Copyright © 2011 SciRes. JEP Participation and Activity Rates: Monitoring Exposure Potential for Native Americans and Others in the United States* Joanna Burger Division of Life Sciences, Rutgers University, Piscataway, USA Email: burger@biology.rutgers.edu Received May 17th, 2011; revised July 9th, 2011; accepted August 13th, 2011. ABSTRACT Managers and regulators are concerned about potential human health effects from exposure on lands contaminated by chemicals and rad ionuclides. Determ ining target cleanup levels is partly dependent upon futu re land use, and poten tial exposure from human use. This paper provides data from surveys of activity patterns of people attending festivals in four states, located in the vicinity of Department of Energy fa cilities. There were significant differences in both partici- pation rates , and activity rates as a function of both location and ethnicity that can be used by managers to track expo- sure, land use, and preferred activities on natural lands. In general, 1) a higher percent of Native Americans engaged in consumptive activities than others, 2) a higher percent of Caucasians engaged in some non-consumptive activities than Native Americans, 3) a higher percentage of Native Americans engag ed in activities on sa cred ground s, 4) activity rates were generally higher for Native American s for consumptive a ctivities and religious/cultu ral than fo r Caucasian s, 5) fishing rates were higher than other consumptive activities, and camping/hiking were higher than other non-con- sumptive activities, and 6) hunting rates were higher in subjects from Idaho than elsewhere. Baseline human use is critical for monitoring potential exposure, and provides the basis for monitoring, risk assessment and future land use, and these data can be used by managers for assessment and management. Tracking changes over time will reflect changing recreational, subsistence, and cultural/religious trends that relate to land use, public perceptions, and expo- sure. Keywords: Monitoring, Baseline, Exposure, Ethnici t y , Native Americans, Caucasi ans, Department of Energy 1. Introduction The USA and World are moving toward managing land for ecological, economic, and societal values. While con- siderable attention has been devoted to assessment and monitoring of species, populations, and ecosystems, rela- tively little has been devoted to assessing human use of relatively intact ecosystems, including participation rates, activity patterns, and ethnic differences in resource use. Both managing and restoring degraded ecosystems de- pends not only on understanding the structure and func- tion of ecosystems, but human use and values. Restoring degraded ecosystems and natural resources is an important activity for federal and state governments, Tribal Nations, scientists, managers, the private sector, and the public. An important component of management is characterizing the current state of the ecosystem, and its degradation, including determining the appropriate and desired outcome, as well as human use [1-3]. As- sessing contamination, evaluating ecosystem damage, and considerations of future land use require an under- standing not only of hazard identification, contamination assessment (temporal and spatial patterns), and ecosy- stem evaluation (injuries at the individual, population, community and ecosystem level), but an assessment of human use. Burger et al. [4] suggest that while most economists and other Western scientists value the goods and services that ecosystems provide, subsistence and Native Ameri- cans have a broader, more holistic view of the interrela- tionship of natural and cultural resources. A healthy eco- system is one that supports its natural plants and animals, as well as sustaining the biophysical, cultural, and spiri- tual health of native peoples [5-11]. They suggested that 1) subsistence and tribal peoples view natural resources holistically and combine traditional goods and services  Participation and Activity Rates: Monitoring Exposure Potential for Native Americans and Others in the United States 1010 together rather than considering them separately, 2) many individual, religious and cultural activities encom- pass a holistic view of nature (intact, not-degraded, and not polluted), and 3) resources considered to be cultural by Western scientists have a natural resource base as an integral part of cultural use by Native Americans (e.g. a sacred ground includes man made and the physical envi- ronment [4]). Thus, assessing human use of natural eco- systems (or restored ecosystems) should also include understanding whether people, particularly Native Ame- ricans, use the lands for religious and cultural purposes. There are nearly 600 recognized American Indian Tribes in the United States, and many are located near contaminated lands that were once their traditional tribal lands. Understanding how Native Americans and others use the land, what percentage engage in different types of activities, and the frequency of engagement is critical to assessing and monitoring potential exposure. The as- sessment of resource use by people is particularly critical where multiple land uses are concerned [12], or where different ethnic groups may use the land in different ways. This paper examines human use and activity patterns of subjects interviewed at four venues in Idaho, Tennes- see, New York and New Jersey, focusing on location and ethnic differences (particularly Native Americans and Caucasians). All four venues were in the vicinity of De- partment of Energy (DOE) sites, where environmental restoration and management are aimed at reducing risk to humans and the environment [13-15], and where there are important ecological resources[4,16]. Three types of activities are explored: consumptive, non-consumptive, and religious/sacred. Understanding the activity patterns is also important because it fits within the DOE’s envi- ronmental justice program for fair treatment and mean- ingful involvement for all people, and to ensure that fair treatment such that no group bears a disproportionate share of negative environmental consequences [17]. 2. Methods and Protocol Our overall research design was to interview people at- tending four events (or series of event) near major DOE sites. These included 1) the Julyamsh Pow Wow (=In- dian festival) at Post Falls, Idaho (in region with Hanford Site), 2) the Shoshone Bannock festival at Ft. Hall (near the Idaho National Laboratory), 3) Pow Wow on the Mountain in Cookeville (near Oak Ridge Reservation in Tennessee), and 4) Gateway to Nations in Brooklyn New York and the Sussex County Pow Wow in New Jersey (near Brookhaven National Laboratory, combined be- cause of their proximity) (Figure 1). We selected these events because we expected there to be both Native Americans and Caucasians. All were in the region with well-known contaminated DOE sites, and we expected there to be an adequate sample of both Na- tive Americans and others. The events attracted a general public and not just people interested in natural resources, and the events went for several days, providing the op- portunity to interview a sufficient sample of subjects. Further, these were festivals in which hunting, fishing, camping or other outdoor activities were not featured, and a cross-section of people might be expected to attend (albeit people interested in Native American culture). Our overall protocol was to use structured interviews, employing a questionnaire to assess resource uses, per- ceptions about the features of the environment that were important to them, resource activity rates (by consump- tive, non-consumptive uses, and religious/sacred), per- ceptions about Natural Resource Damage Assessment and resource restoration, and perceptions of who should restore natural resources. The data for this paper only includes participation in activities and activity rates. All questionnaires were administered by trained per- sonnel who had conducted these interviews in the past. The interviews required between 20 min and 40 min, depending upon how many activities subjects engaged in, and how many questions subjects asked about the survey or natural resources. People were interviewed while they waited in lines or for activities to begin, and few people declined to be interviewed. Interviewers first introduced themselves as from Rutgers University, and explained the overall purpose of the survey. We randomly selected a person for the interview, and after completing the in- terview, moved at least three meters in a transect across the fair grounds, to select the next prospective inter- viewee. In some cases we moved along a waiting line in this manner, and in other cases we moved through the crowd in this manner. Subjects were not selected com- pletely randomly, but there is no reason to assume a bias in our selection process. Rather, the data are used to ex- amine locational and ethnic differences useful for man- agers to consider. The questionnaire was divided into sections that in- cluded demographics, rating of the importance of envi- ronmental features by consumptive and non-consumptive activities, frequency of various activities (and relative importance of each), and questions about Natural Re- source Damage Assessment and restoration. Demogra- phic information included age, gender, education, family income (asked at the end of the interview), self-identified ethnicity, self-identified tribal affiliation, and whether they had ever worked for the Department of Energy. We asked whether they hunted, fished, crabbed, gath- ered herbs or berries, or engaged in other consumptive activities, and then asked them to provide information on their activity rates. We asked them to rate the importance C opyright © 2011 SciRes. JEP  Participation and Activity Rates: Monitoring Exposure Potential for Native Americans and Others in the United States Copyright © 2011 SciRes. JEP 1011 of different activities on a Likert scale of 1 [unimportant] to 5 [very important]). We also asked them to rate (on a scale of 1 - 8) eight different activities, where only one activity could be rated 1, and only one could be rated 2, and so on. We also asked about non-consumptive activi- ties, such as hiking, bird watching, biking, camping, pic- nicking and other, as well as religious/sacred activities. We used Kruskal-Wallis χ2 tests to distinguish differ- ences among Caucasians and Native Americans within and among sites [18]. We accepted P < 0.05 as signifi- cant, and give means and standard errors in the text and figures. As with all survey research, the results reflect the populations interviewed and are not necessarily repre- sentative of either specific groups of Caucasians or Na- tive Americans. 3. Results 3.1. Demographics There were demographic differences in the subjects among the four study sties (Table 1). A higher level of education was obtained in subjects interviewed in Post Falls and New Jersey/New York than the other locations. Table 1. Demographics of study population in Cookeville, Tennessee, Post Falls and Fort Hall, Idaho, Sussex County, New Jersey, and Brooklyn, New York (2009). Given are means ± standard error and range for age and income. n a Education (yearsb) Less than high school High school Some college College graduate Graduate level Income (thousands of dollars) Age Gender (% Women) Post Falls, Idaho Overall 401 14.2 ± 0.1 9% 28%22% 35% 6% 48.5 ± 2.6, 0 - 500 46.5 ± 0.8, 13 - 87 55% Native American 209 13.6 ± 0.2 15% 33%20% 28% 3% 43.3 ± 4.1, 0 - 500 41.8 ± 1.1, 16 - 87 50% Caucasian 177 14.8 ± 0.2 2% 22%24% 45% 8% 53.6 ± 3.3, 6 - 300 52.5 ± 1.1, 18 - 86 58% Fort Hall, Idaho Overall 387 13.8 ± 0.1 13% 33%13% 35% 5% 40.8 ± 1.9, 2 - 175 44.2 ± 0.77, 18 - 86 50% Native American 268 13.6 ± 0.2 16% 35%13% 32% 4% 36.8 ± 2.0, 6 - 175 42.3 ± 0.9, 18 - 86 53% Caucasian 108 14.2 ± 0.2 6% 31%14% 43% 6% 47.9 ± 4.0, 2 - 160 49.2 ± 1.4, 20 - 83 43% Cookeville, Tennessee Overall 233 13.4 ± 0.1 11% 43%19% 23% 3% 39.2 ± 2.3, 1 - 190 47.3 ± 0.9, 14 - 81 58% Native American 92 13.3 ± 0.2 9% 44%23% 23% 2% 35.4 ± 3.7, 1 - 145 48.5 ± 1.5, 14 - 79 40% Caucasian 128 13.4 ± 0.2 13% 43%16% 23% 4% 42.7 ± 3.3, 1.5 - 190 47.0 ± 1.2,18 - 81 56% Sussex, New Jersey & Brooklyn New York Overall 240 14.8 ± 0.2 8% 28%11% 42% 11% 65.3 ± 2.6, 10 - 160 47.5 ± 0.9, 16 - 84 50% Native American 63 14.5 ± 0.4 14% 24%19% 37% 6% 57.4 ± 4.7, 20 - 120 48.9 ± 1.9, 22 - 84 41% Caucasian 98 15.0 ± 0.2 7% 28%10% 38% 17% 69.1 ± 4.6, 10 - 160 49.7 ± 1.4, 22 - 74 57% Comparison among 4 locations Overall X2 (p) 1261 45.7 (<0.0001) 87.7 (<0.0001) 10.7 (0.01) 5.0 (NS) Native American X2 (p) 632 7.8 (0.05) 23.5 (<0.0001) 22.0 (<0.0001) 4.9 (NS) Caucasian X2 (p) 511 33.6 (<0.0001) 31.1 (<0.0001) 12.3 (0.006) 7.7 (0.05) Comparison of all Native American to Caucasian X 2 (p) 23.8 (<0.0001) 36.4 (<0.0001) 43.6 (<0.0001) 1.2 (NS) a118 people surveyed were of other ethnicities. b12 years = High school graduate.  Participation and Activity Rates: Monitoring Exposure Potential for Native Americans and Others in the United States 1012 Although the educational levels varied by site for both Native Americans and Caucasians, the differences were greater for Caucasians than for Native Americans. In- come tracked education in that the places with the lower levels of education (Ft. Hall and Cookeville) had signifi- cant lower mean incomes than those from the other places: incomes from subjects interviewed in New Jer- sey/New York were significantly higher than those of subjects from other sites. Although there were significant differences in age among the locations, the differences were small (mean age varied from 44.2 to 47.5 years (Table 1). Overall, for all subjects combined (N = 1261), Native Americans had less education and had lower in- comes than did Caucasians. 3.2. Participation Rates One measure of potential use of an area, and thus poten- tial exposure if sites are contaminated, is the percent of people that engage in different activities. Overall, be- tween 52% and 76% of the subjects interviewed, depend- ing upon the location, engaged in consumptive activities, 84% to 89% engaged in non-consumptive activities, and 64% to 76% of the subjects engaged in religious/sacred activities (Table 2). Participation in fishing was higher than for other consumptive activities. In several locations there was a higher participation rate in gathering herbs and berries than in hunting. There were significant loca- tional differences for all activities, except crabbing (few people engaged regardless of location) and some reli- gious activities. For all 4 sites, a higher percentage of Native Ameri- cans engaged in consumptive activities (fish, hunt, gather) than did Caucasians (Table 2, Figure 2). A higher per- centage of Caucasians engaged in specific non-consump- tive activities than did Native Americans (except for camping). For all sites, a higher percentage of Native Americans engaged in religious/sacred activities than did Caucasians, and these differences were also consistent within sites (Table 2). 3.3. Activity Rates A second measure of land use and potential exposure is activity rates (mean number of days/month) for different activities. Activity rates were computed only for those people who engaged in each activity, since to do other- wise is biased toward lower activity rates (because of the large number of 0 days). Activity rates for hunting/fish- ing/crabbing and for collecting herbs and berries, the two consumptive activities we asked about, were lower for all four sites, than were non-consumptive activity rates (bird- watch, hike, pray, Table 3). Several conclusions can be drawn from Table 3 and Figure 3: 1) there were significant location differences for 6 of the 8 activities, 2) there were location differences when only Native Americans are considered for all but communing with nature, 3) there were location differ- ences for only 2 of 8 activities for Caucasians, 4) when all subjects were lumped, there were differences between Native Americans and Caucasians for only 5 of 8 activi- ties, and 5) subjects had the highest rates for commune with nature and pray or meditate for all locations. The greatest location difference for Native Americans was for hiking/biking/walking; rates were highest for New Jer- sey/New York. The greatest location difference for Cau- casians was for fish/hunt/crab; rates were highest for Ft. Hall. 3.4. Most Important Activities In the previous two sections, subjects provided informa- tion on whether they engaged in particular activities, and Figure 1. Map showing the sampling four survey locations and relative Department of Energy sites. C opyright © 2011 SciRes. JEP 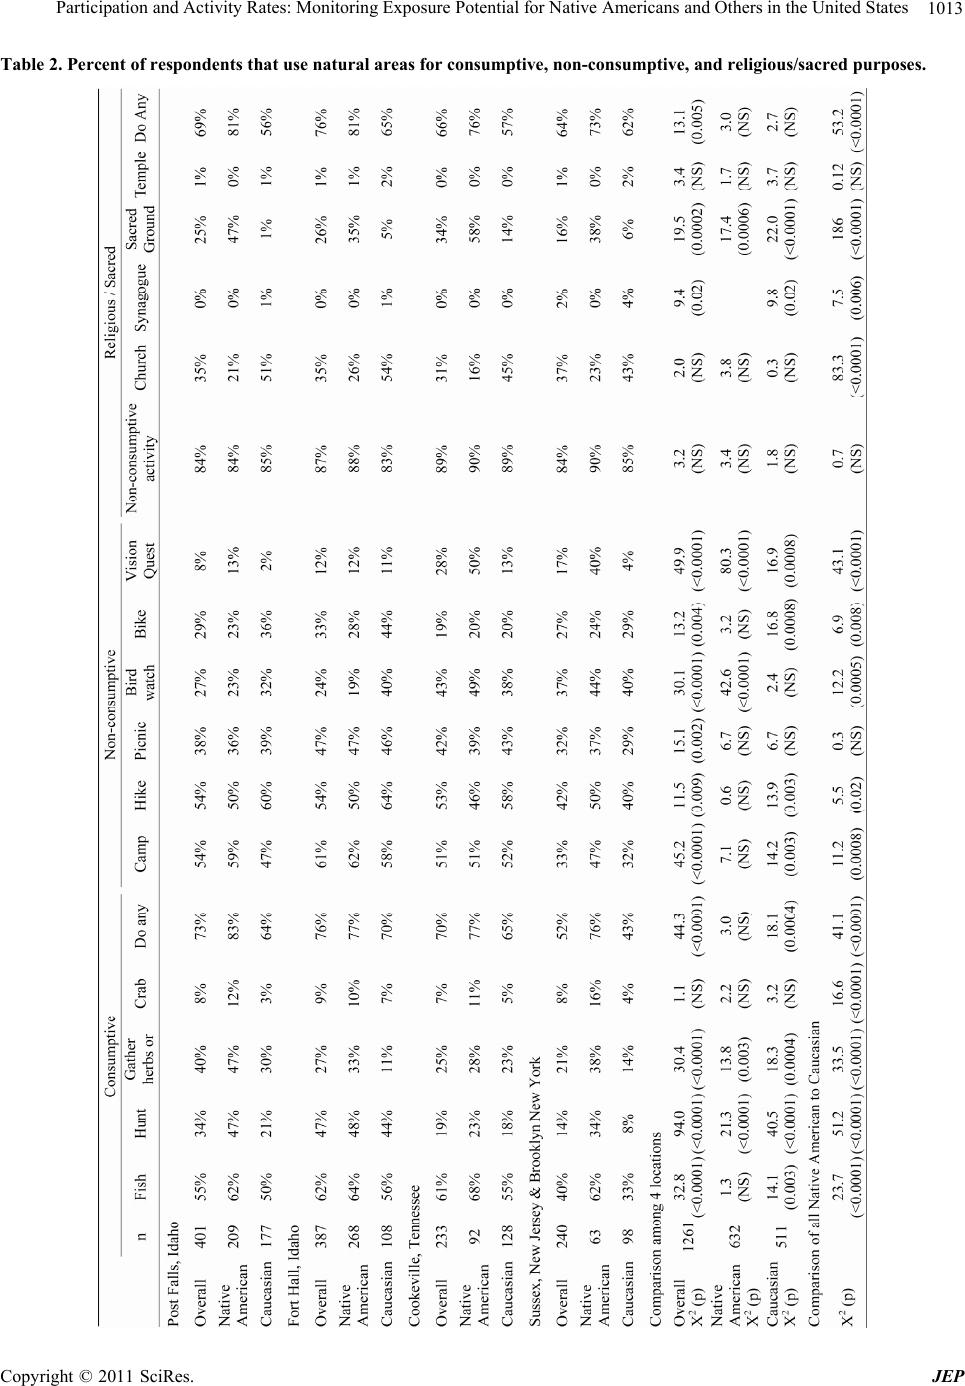 Participation and Activity Rates: Monitoring Exposure Potential for Native Americans and Others in the United States1013 Table 2. Percent of respondents that use natural areas for consumptive, non-consumptive, and religious/sacre d pur poses. Copyright © 2011 SciRes. JEP 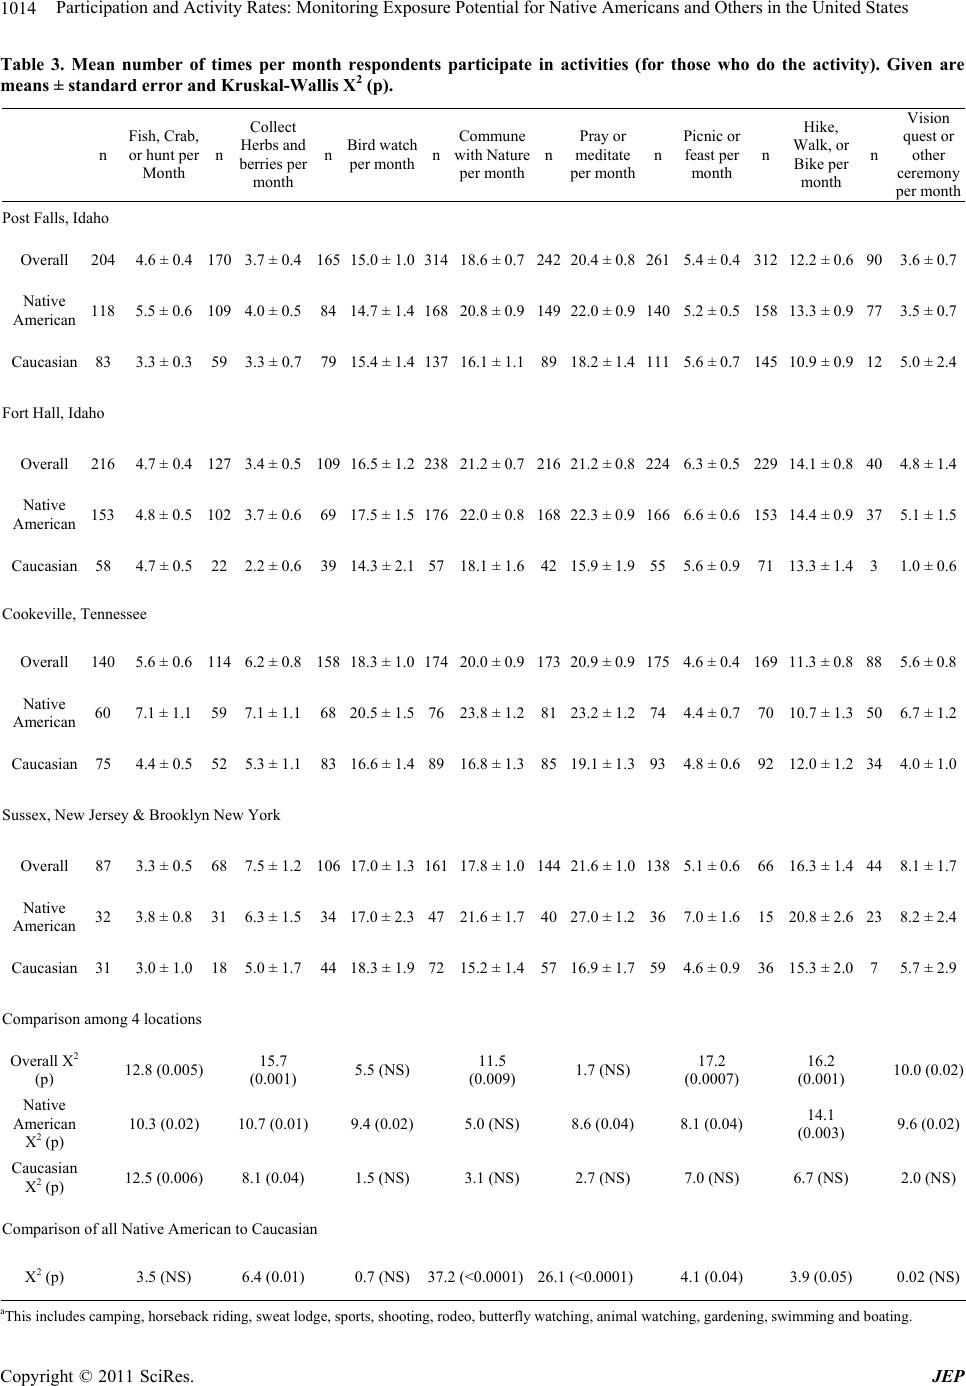 Participation and Activity Rates: Monitoring Exposure Potential for Native Americans and Others in the United States 1014 Table 3. Mean number of times per month respondents participate in activities (for those who do the activity). Given are means ± standard error and Kruskal-Wallis X2 (p). n Fish, Crab, or hunt per Month n Collect Herbs and berries per month n Bird watch per monthn Commune with Nature per month n Pray or meditate per month n Picnic or feast per month n Hike, Walk, or Bike per month n Vision quest or other ceremony per month Post Falls, Idaho Overall 204 4.6 ± 0.4 170 3.7 ± 0.4 165 15.0 ± 1.031418.6 ± 0.7242 20.4 ± 0.8 2615.4 ± 0.4 312 12.2 ± 0.6 903.6 ± 0.7 Native American 118 5.5 ± 0.6 109 4.0 ± 0.5 84 14.7 ± 1.416820.8 ± 0.9149 22.0 ± 0.9 1405.2 ± 0.5 158 13.3 ± 0.9 773.5 ± 0.7 Caucasian 83 3.3 ± 0.3 59 3.3 ± 0.7 79 15.4 ± 1.413716.1 ± 1.18918.2 ± 1.4 1115.6 ± 0.7 145 10.9 ± 0.9 125.0 ± 2.4 Fort Hall, Idaho Overall 216 4.7 ± 0.4 127 3.4 ± 0.5 109 16.5 ± 1.223821.2 ± 0.7216 21.2 ± 0.8 2246.3 ± 0.5 229 14.1 ± 0.8 404.8 ± 1.4 Native American 153 4.8 ± 0.5 102 3.7 ± 0.6 69 17.5 ± 1.517622.0 ± 0.8168 22.3 ± 0.9 1666.6 ± 0.6 153 14.4 ± 0.9 375.1 ± 1.5 Caucasian 58 4.7 ± 0.5 22 2.2 ± 0.6 39 14.3 ± 2.15718.1 ± 1.642 15.9 ± 1.9 555.6 ± 0.9 71 13.3 ± 1.4 31.0 ± 0.6 Cookeville, Tennessee Overall 140 5.6 ± 0.6 114 6.2 ± 0.8 158 18.3 ± 1.017420.0 ± 0.9173 20.9 ± 0.9 1754.6 ± 0.4 169 11.3 ± 0.8 885.6 ± 0.8 Native American 60 7.1 ± 1.1 59 7.1 ± 1.1 68 20.5 ± 1.57623.8 ± 1.281 23.2 ± 1.2 744.4 ± 0.7 70 10.7 ± 1.3 506.7 ± 1.2 Caucasian 75 4.4 ± 0.5 52 5.3 ± 1.1 83 16.6 ± 1.48916.8 ± 1.385 19.1 ± 1.3 934.8 ± 0.6 92 12.0 ± 1.2 344.0 ± 1.0 Sussex, New Jersey & Brooklyn New York Overall 87 3.3 ± 0.5 68 7.5 ± 1.2 106 17.0 ± 1.316117.8 ± 1.0144 21.6 ± 1.0 1385.1 ± 0.6 66 16.3 ± 1.4 448.1 ± 1.7 Native American 32 3.8 ± 0.8 31 6.3 ± 1.5 34 17.0 ± 2.34721.6 ± 1.740 27.0 ± 1.2 367.0 ± 1.6 15 20.8 ± 2.6 238.2 ± 2.4 Caucasian 31 3.0 ± 1.0 18 5.0 ± 1.7 44 18.3 ± 1.97215.2 ± 1.457 16.9 ± 1.7 594.6 ± 0.9 36 15.3 ± 2.0 75.7 ± 2.9 Comparison among 4 locations Overall X2 (p) 12.8 (0.005) 15.7 (0.001) 5.5 (NS) 11.5 (0.009) 1.7 (NS) 17.2 (0.0007) 16.2 (0.001) 10.0 (0.02) Native American X2 (p) 10.3 (0.02) 10.7 (0.01) 9.4 (0.02) 5.0 (NS) 8.6 (0.04) 8.1 (0.04) 14.1 (0.003) 9.6 (0.02) Caucasian X2 (p) 12.5 (0.006) 8.1 (0.04) 1.5 (NS) 3.1 (NS) 2.7 (NS) 7.0 (NS) 6.7 (NS) 2.0 (NS) Comparison of all Native American to Caucasian X 2 (p) 3.5 (NS) 6.4 (0.01) 0.7 (NS)37.2 (<0.0001)26.1 (<0.0001) 4.1 (0.04) 3.9 (0.05) 0.02 (NS) aThis includes camping, horseback riding, sweat lodge, sports, shooting, rodeo, butterfly watching, animal watching, gardening, swimming and boating. C opyright © 2011 SciRes. JEP  Participation and Activity Rates: Monitoring Exposure Potential for Native Americans and Others in the United States1015 Figure 2. Percentage of Native Americans and Caucasian who said they engaged in specific consumptive and non-consump- tive activities at all locations. Star indicates a significant difference. Copyright © 2011 SciRes. JEP  Participation and Activity Rates: Monitoring Exposure Potential for Native Americans and Others in the United States 1016 Figure 3. Frequency of specific activities for Native American and Caucasians interviewed at all locations. C opyright © 2011 SciRes. JEP 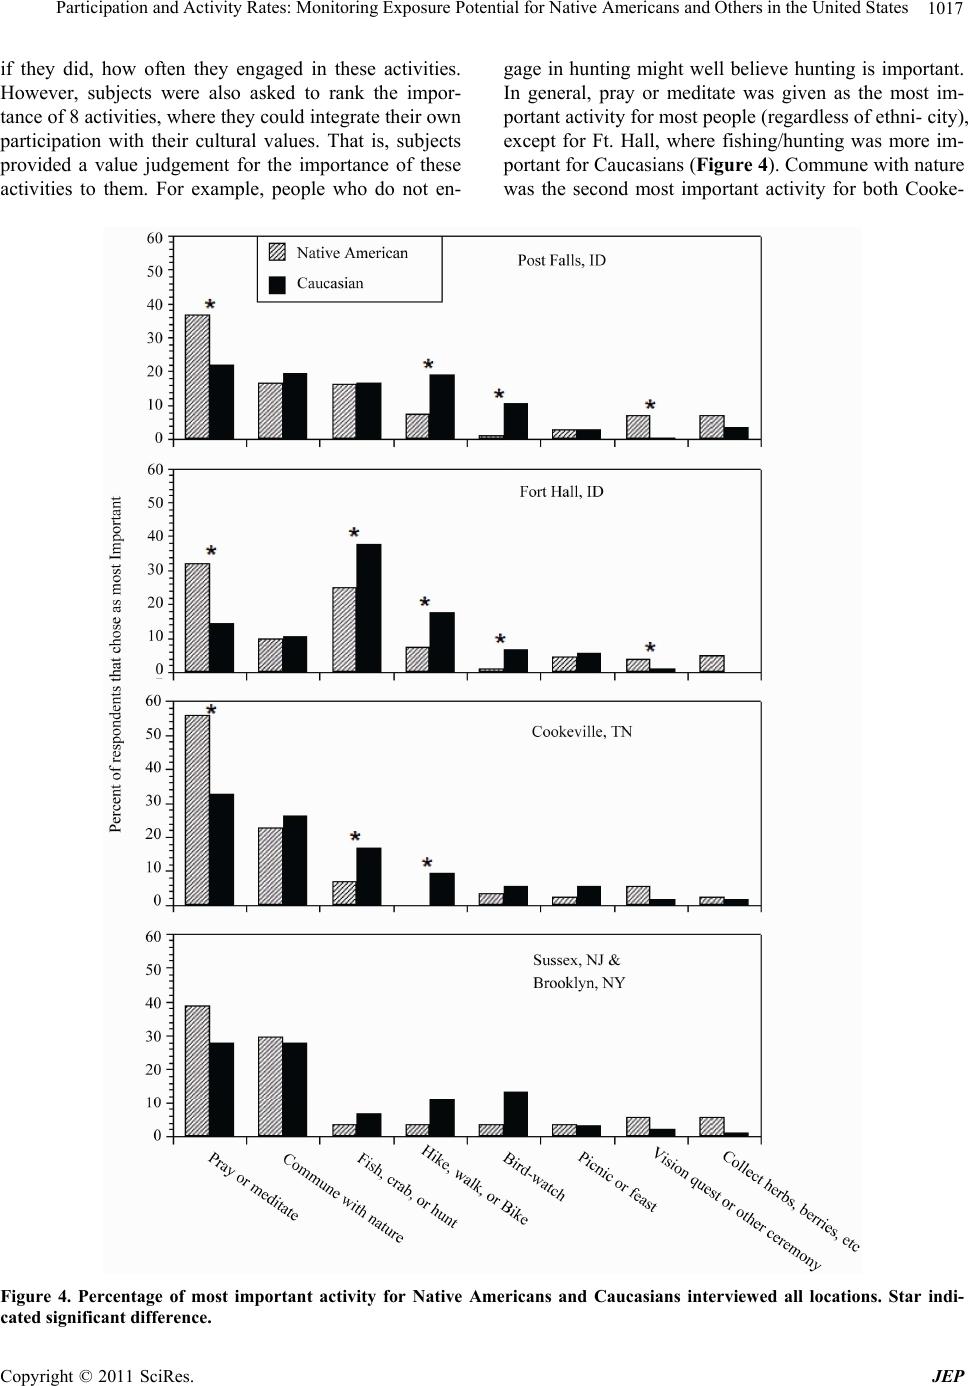 Participation and Activity Rates: Monitoring Exposure Potential for Native Americans and Others in the United States Copyright © 2011 SciRes. JEP 1017 if they did, how often they engaged in these activities. However, subjects were also asked to rank the impor- tance of 8 activities, where they could integrate their own participation with their cultural values. That is, subjects provided a value judgement for the importance of these activities to them. For example, people who do not en- gage in hunting might well believe hunting is important. In general, pray or meditate was given as the most im- portant activity for most people (regardless of ethni- city), except for Ft. Hall, where fishing/hunting was more im- portant for Caucasians (Figure 4). Commune with nature was the second most important activity for both Cooke- Figure 4. Percentage of most important activity for Native Americans and Caucasians interviewed all locations. Star indi- cated significant difference.  Participation and Activity Rates: Monitoring Exposure Potential for Native Americans and Others in the United States 1018 ville and New Jersey/New York, and was tied for second at Post Falls. 4. Discussion 4.1. Overall Participation and Activity Rates There is an extensive literature about hunting and fishing and other consumptive activities [19], and on recrea- tional activities and leisure activities [20]. Activities of Native Americans, which often involve a full range of both consumptive and non-consumptive activities, have been well documented for some American Indians and Alaska Natives [21,22]. These papers, however, neither compare Native Americans with others, nor include con- sumptive, non-consumptive, and religious/cultural sepa- rately (but see Harper et al. [22] for only Native Ameri- cans). The difficulty partly is one of terminology because there are several different ways of talking about activities performed in nature. In this paper, activities that clearly were consumptive (e.g. hunting, fishing, gathering), non- consumptive (picnics, walking, biking, bird-watching), and religious/cultural (communicate with nature, pray or meditate, vision quest or other ceremony) were examined. Subjects could participate in any or all of the activities, and if they participated, could give estimates of their rates for each activity. Overall, the greatest participation was for religious/ sacred activities, followed by fishing, camping and hik- ing, and then picnics. Participation rates, and activity rates, provide information that can be used by resource managers and land use managers to predict the types of resources to enhance or manage to meet the needs of the public. This type of information also provides insights into possible conflicts among users. The relative lower rate of hunting in Cookeville suggests less conflict with other, non-consumptive uses. Further, the relatively high rate of participation in fishing indicates that these re- sources are vital to local communities, and may require active management. The activities the survey examined dealt with specific activities (e.g. hunt, fish, hike, camp), and not what they did or thought while engaging in these activities. How- ever, when asked to rank (from 1 to 8) different activities, categories were combined (into hunt/fish/crab), and com- mune with nature was added. Commune with nature, along with engaging in religious/sacred activities were given as the activities that were “most important” to subjects. This illustrates that communing with nature is a key and important aspect of activities performed in wild environments, and suggests that this needs to be consid- ered as an “activity” by scientists, in addition to more traditional hunting, fishing, camping and hiking. Commune with nature, as well as hiking/walking, are activities that can be performed in small and nearby natural environments, while hunting, fishing and sacred activities may require larger natural environments that may be farther away. Subjects noted in conversa- tions that they often went to small parks, woodlots or other natural areas close to home to commune with nature or walk, while they often had to travel long distances to reach sacred grounds, or engage in camping. 4.2. Location Differences Participation and activity rates varied among sites. Fish- ing participation rates were lower in New Jersey/New York, hunting was lower in New Jersey/New York and in Tennessee, gathering was higher in Post Falls, and camping and hiking were higher in the northwestern United States than for the other sites. Partly these differ- ences may relate to availability of suitable habitat (e.g. there are fewer hunting opportunities nearby in New Jer- sey/New York than in the northwestern United States). However, they are likely due to cultural differences since there are places to hunt in all regions. The remarkable similarity in the percentage of people engaging in each specific activity across the four sites indicates a general preference for these activities. This provides some uniformity in management directives that suggest that hiking, camping, and fishing are the high use activities. The further emphasis on religious/sacred ac- tivities supports the importance of relatively undisturbed environments. 4.3. Native American versus Caucasian While several authors have described the holistic view of Native Americans about the natural environment [4,8,23], few have examined the participation and activity rates of Native Americans and Caucasians living in the same region. While ethnic differences were present for some activities at some sites (particularly Post Falls and Ft. Hall), there were no significant ethnic differences for many consumptive and non-consumptive uses. Further, when overall consumptive and non-consumptive were considered (that is, did each subject engage in any con- sumptive or non-consumptive activity), there were no ethnic differences in non-consumptive, and no ethnic difference for subjects at Ft. Hall. The ethnic differences in consumptive activities were greatest for Post Falls and New Jersey/New York. In both sites, Native Americans engaged in higher rates of consumptive activities than others, suggesting a particu- lar need to track these differences, and manage resources accordingly. Ethnic differences in non-consumptive spe- cific activities were less clear. It may be that Native Americans engage in camping, for example, as part of C opyright © 2011 SciRes. JEP  Participation and Activity Rates: Monitoring Exposure Potential for Native Americans and Others in the United States1019 hunting and fishing trips, while others engage in camping as part of bird-watching or hiking. Thus, the overall ac- tivity (camping) did not generally vary by ethnicity (ex- cept for Post Falls), but the reason for doing so did. 4.4. Exposure and Management The data presented in this paper can be used to under- stand potential exposure, both in terms of the percent of the population that may be exposed, and to the levels of exposure (days engaged in each activity). These data are useful for a range of risk assessors, risk managers, re- source managers, land use managers, and public policy makers in understanding what percentage of people might engage in different types of activities, and the fre- quency of this engagement. Use data are often presented as a function of the total population, where exposure in terms of days/month in- cludes the entire population. In terms of risk and expo- sure, and even for land use, it is important to know how often people use resources who do indeed use them. Thus, if less than 10% of the population gather herbs and berries, but that 10% does so 5 tor 7 days a month (as they do at Tennessee), then to average exposure over the entire population reduces the known exposure, and per- haps management to reduce exposure. This is especially true for situations in which natural resources (such as fish, berries, or game) might be contaminated and one objective is to understand the population that is maxi- mally exposed. And it is even more important to under- stand maximum exposure for high risk populations, such as pregnant women exposed to mercury (e.g. for fish consumption). While having data on exposure is critical for risk as- sessors, risk managers, and health professionals, such data are also useful for land managers who have limited resources to manage opportunities for recreational and subsistence activities on natural lands. Further, the simi- larities and differences among sites provide information for federal and regional managers to allocate resources. 5. Acknowledgements I thank M. Gochfeld, C. W. Powers, J. Clarke, M. Greenberg for helpful information and discussions about the complexities of environmental evaluation in relation to resource use and future land use, and C. Jeitner, T. Pittfield, R. Ramos, C. Dixon, and M. Marchioni for help with the interviews. We particularly thank Stephanie Jordan of the (tribe, committee) for permission to con- duct these interviews at the Post Falls Julyamsh Pow Wow, Delbert Farmer and Tina Batt (tribal committee) for permission to conduct these interviews at the Sho- shone-Bannock Pow Wow, Mary Cox and Carol Cash for permission to conduct these interviews at the “Pow Wow on the Mountain” festival, and Cliff Matias for the Red Hawk Native American’s Art Council (for New Jer- sey/ New York). This research was funded by the Con- sortium for Risk Evaluation with Stakeholder Participa- tion (CRESP) through the Department of Energy (AI # DE-FG 26-00NT 40938 and DE-FC01-06EW07053), NIEHS (P30ES005022), and EOHSI. The conclusions and interpretations reported herein are the sole responsi- bility of the author, and should not in any way be inter- preted as representing the views of the funding agencies. REFERENCES [1] J. Cairns, “Rehabilitating Damaged Ecosystems,” CRC Press, Boca Raton, 1994. [2] J. Cairns and B. R. Niederlehner, “Developing a Field of Landscape Ecotoxicology,” Ecological Applications, Vol. 6, No. 3, 1995, pp. 780-796. [3] M. Greenberg, J. Burger, M. Gochfeld, D. Kosson, K. Lowrie, H. Mayer, et al., “End-State Land Uses, Sus- tainably Protective Systems, and Risk Management: A Challenge for Remediation and Multigenerational Stew- ardship,” Remediation, Vol. 16, No. 1, 2005, pp. 91-105. doi:10.1002/rem.20072 [4] J. Burger, M. Gochfeld, K. Pletnikoff, R. Snigaroff, D. Snigaroff and T. Stamm, “Ecocultural Attributes: Evalu- ating Ecological Degradation: Ecological Goods and Ser- vices vs Subsistence and Tribal Values,” Risk Analysis, Vol. 28, No. 5, 2008, pp. 1261-1271. doi:10.1111/j.1539-6924.2008.01093.x [5] R. W. Stoffle and J. J. Evans, “Holistic Conservation and Cultural Triage: American Indian Perspectives on Cul- tural Resources,” Human Organization, Vol. 49, No. 2, 1990, pp. 91-99. [6] M. L. Tano, J. H. Reuben, D. Powaukee and A. D. Lester, “An Indian Tribal View of the Back End of the Nuclear Fuel Cycle: Historical and Cultural Lessons,” Radwaste, Vol. 3, No. 2, 1996, pp. 44-47. [7] S. G. Harris and B. L. Harper, “Native American Expo- sure Scenario,” Risk Analysis, Vol. 17, No. 6, 1997, pp. 789-795. doi:10.1111/j.1539-6924.1997.tb01284.x [8] S. G. Harris and B. L. Harper, “How Incorporating Tribal Information Will Enhance Waste Management Deci- sions,” Confederated Tribes of the Umatilla Indian Res- ervation, Pendleton, 2008. [9] Nez Perce Tribe, “Treaties: Nez Perce Perspectives,” US DOE and Confluence Press, Fallon, 2003. [10] L. M. Stumpff, “Reweaving the Earth: An Indigenous Perspective on Restoration Planning and the National Environmental Policy Act,” Environmental Practice, Vol. 8, No. 2, 2006, pp. 93-103. doi:10.1017/S1466046606060121 [11] G. Bohnee, J. Mathews, J. Pinkham, A. Smith and J. Stanfill, “Nez Perce Involvement with Solving Environ- mental Problems: History, Perspectives, Treaty Rights, and Obligations,” In: J. Burger, Ed., Science and Stake- Copyright © 2011 SciRes. JEP  Participation and Activity Rates: Monitoring Exposure Potential for Native Americans and Others in the United States Copyright © 2011 SciRes. JEP 1020 holders: Solutions to Energy and Environmental Issues by Incorporating Resource Agencies, Regulators, Tribes, Industry, and Other Stakeholders, Springer, New York, 2011. [12] Y. Yin and J. T. Pierce, “Integrated Resource Assessment and Sustainable Land Use,” Environmental Management, Vol. 17, No. 3, 1993, pp. 319-327. doi:10.1007/BF02394674 [13] G. W. Suter, R. A. Efroymson, B. E. Sample and S. D. Jones, “Ecological Risk Assessment for Contaminated Sites,” Lewis Publishers, Boca Raton, 2000. doi:10.1201/9781420056693 [14] K. D. Crowley and J. F. Ahearne, “Managing the Envi- ronmental Legacy of U.S. Nuclear-Weapons Production,” American Scientist, Vol. 90, No. 6, 2002, pp. 514-523. [15] R. A. Efroymson, J. P. Nicolette and G. W. Suter, “A Framework for Net Environmental Benefit Analysis for Remediation or Restoration of Petroleum-Contaminated Sites,” ORNL/TM-2003/17, Oak Ridge National Labora- tory, Oak Ridge, 2003. [16] V. H. Dale and P. D. Parr, “Preserving DOE’s Research Parks,” Issues in Science and Technology, Vol. 14, No. 2, 1998, pp. 73-77. [17] Department of Energy (DOe), “Environmental Justice: Five-Year Implementation Plan,” DOE/LM-1462, Office of Legacy Management, Grand Junction, Colorado, 2008. [18] SAS Institute, “User’s Guide to SAS,” SAS Publishing, Cary, 1995. [19] S. J. Backman and B. A. Wright, “An Exploratory Study of the Relationship of Attitude and the Perception of Constraints to Hunting,” Journal of Park and Recreation Administration, Vol. 11, No. 2, 1993, pp. 1-16. [20] D. Scott and C. S. Shafer, “Recreational Specialization: A Critical Look at the Construct,” Journal of Leisure Re- search, Vol. 33, No. 3, 2001, pp. 319-343. [21] R. G. Condon, P. Collings and G. Wenzel, “The Best Part of Life: Subsistence Hunting, Ethnicity, and Economic Adaptation among Young Adult Inuit Males,” Arctic, Vol. 48, No. 1, 1995, pp. 31-46. [22] B. L. Harper, A. D. Harding, T. Waterhous and S. G. Harris, “Traditional Tribal Subsistence Exposure Sce- nario and Risk Assessment Guidance Manual,” US Envi- ronmental Protection Agency EPA-STAR-J1-R831-46, 2008. http://www.hhs.oregonstate.edu/ph/sites/default/files/xpo sure_Scenario_and_Risk_Guidance_Manual_v2.pdf [23] S. G. Harris and B. L. Harper, “Using Eco-Cultural De- pendency Webs in Risk Assessment and Characterization of Risks to Tribal Health and Cultures,” Environmental Science and Pollution Research, Vol. 2, 2000, pp. 91-100.
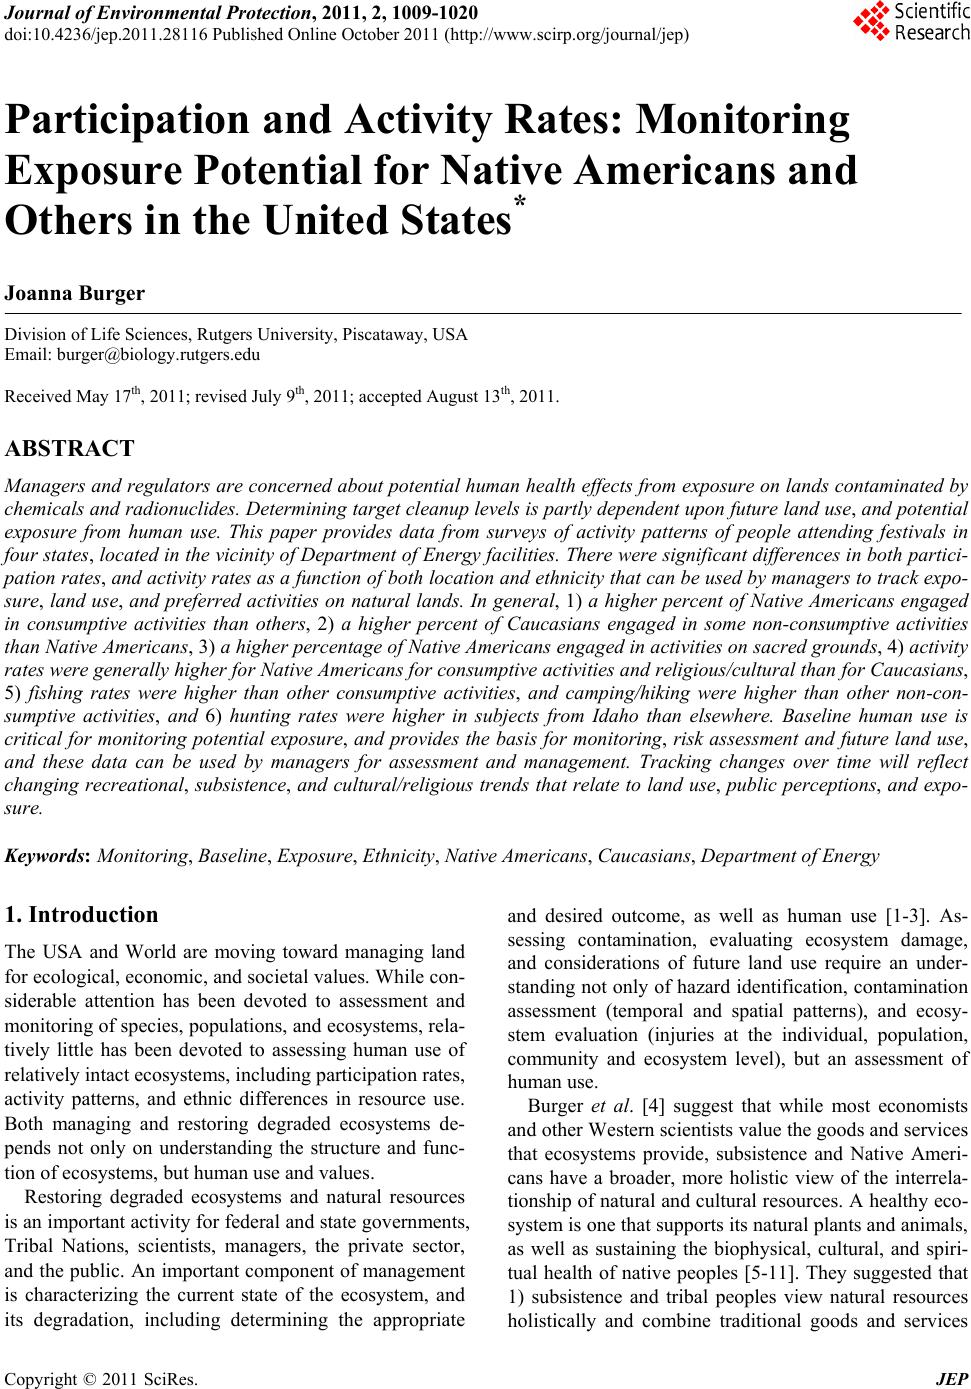
|