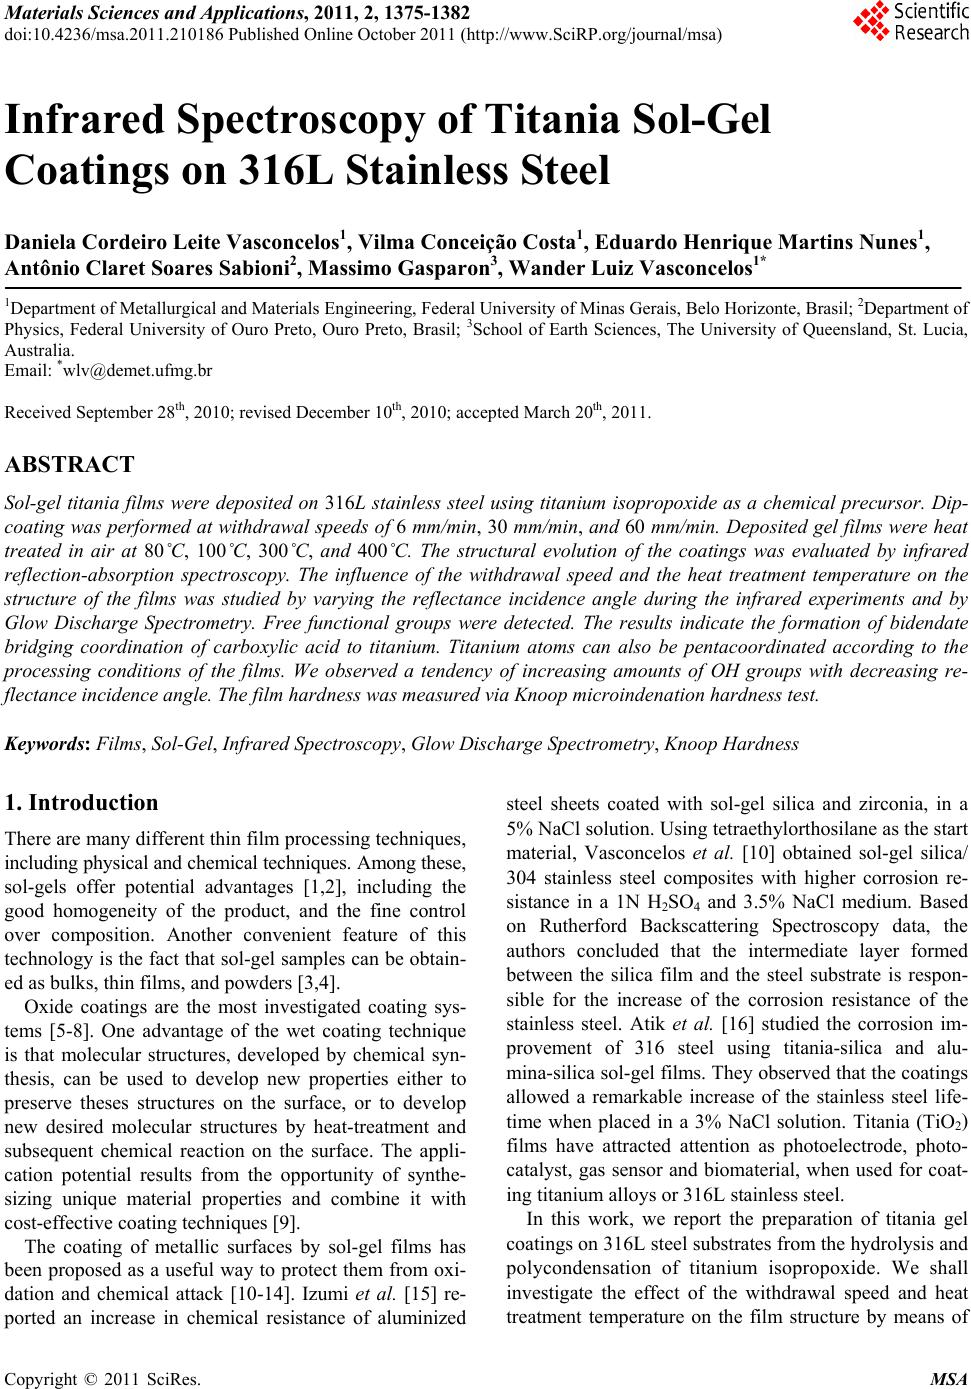
 Materials Sciences and Applications, 2011, 2, 1375-1382 doi:10.4236/msa.2011.210186 Published Online October 2011 (http://www.SciRP.org/journal/msa) Copyright © 2011 SciRes. MSA 1375 Infrared Spectroscopy of Titania Sol-Gel Coatings on 316L Stainless Steel Daniela Cordeiro Leite Vasconcelos1, Vilma Conceição Costa1, Eduardo Henrique Martins Nunes1, Antônio Claret Soares Sabioni2, Massimo Gasparon3, Wander Luiz Vasconcelos1* 1Department of Metallurgical and Materials Engineering, Federal University of Minas Gerais, Belo Horizonte, Brasil; 2Department of Physics, Federal University of Ouro Preto, Ouro Preto, Brasil; 3School of Earth Sciences, The University of Queensland, St. Lucia, Australia. Email: *wlv@demet.ufmg.br Received September 28th, 2010; revised December 10th, 2010; accepted March 20th, 2011. ABSTRACT Sol-gel titania films were deposited on 316L stainless steel using titanium isopropoxide as a chemical precursor. Dip- coating was performed at withdrawal speeds of 6 mm/min, 30 mm/min, and 60 mm/min. Deposited gel films were heat treated in air at 80˚C, 100˚C, 300˚C, and 400˚C. The structural evolution of the coatings was evaluated by infrared reflection-absorption spectroscopy. The influence of the withdrawal speed and the heat treatment temperature on the structure of the films was studied by varying the reflectance incidence angle during the infrared experiments and by Glow Discharge Spectrometry. Free functional groups were detected. The results indicate the formation of bidendate bridging coordination of carboxylic acid to titanium. Titanium atoms can also be pentacoordinated according to the processing conditions of the films. We observed a tendency of increasing amounts of OH groups with decreasing re- flectance incidence angle. The film hardness was measured via Knoop microindenation hardness test. Keywords: Films, Sol-Gel, Infrared Spectroscopy, Glow Discharge Spectrometry, Knoop Hardness 1. Introduction There are many different thin film processing techniques, including physical and chemical techniques. Among these, sol-gels offer potential advantages [1,2], including the good homogeneity of the product, and the fine control over composition. Another convenient feature of this technology is the fact that sol-gel samples can be obtain- ed as bulks, thin films, and powders [3,4]. Oxide coatings are the most investigated coating sys- tems [5-8]. One advantage of the wet coating technique is that molecular structures, developed by chemical syn- thesis, can be used to develop new properties either to preserve theses structures on the surface, or to develop new desired molecular structures by heat-treatment and subsequent chemical reaction on the surface. The appli- cation potential results from the opportunity of synthe- sizing unique material properties and combine it with cost-effective coating techniques [9]. The coating of metallic surfaces by sol-gel films has been proposed as a useful way to protect them from oxi- dation and chemical attack [10-14]. Izumi et al. [15] re- ported an increase in chemical resistance of aluminized steel sheets coated with sol-gel silica and zirconia, in a 5% NaCl solution. Using tetraethylorthosilane as the start material, Vasconcelos et al. [10] obtained sol-gel silica/ 304 stainless steel composites with higher corrosion re- sistance in a 1N H2SO4 and 3.5% NaCl medium. Based on Rutherford Backscattering Spectroscopy data, the authors concluded that the intermediate layer formed between the silica film and the steel substrate is respon- sible for the increase of the corrosion resistance of the stainless steel. Atik et al. [16] studied the corrosion im- provement of 316 steel using titania-silica and alu- mina-silica sol-gel films. They observed that the coatings allowed a remarkable increase of the stainless steel life- time when placed in a 3% NaCl solution. Titania (TiO2) films have attracted attention as photoelectrode, photo- catalyst, gas sensor and biomaterial, when used for coat- ing titanium alloys or 316L stainless steel. In this work, we report the preparation of titania gel coatings on 316L steel substrates from the hydrolysis and polycondensation of titanium isopropoxide. We shall investigate the effect of the withdrawal speed and heat treatment temperature on the film structure by means of 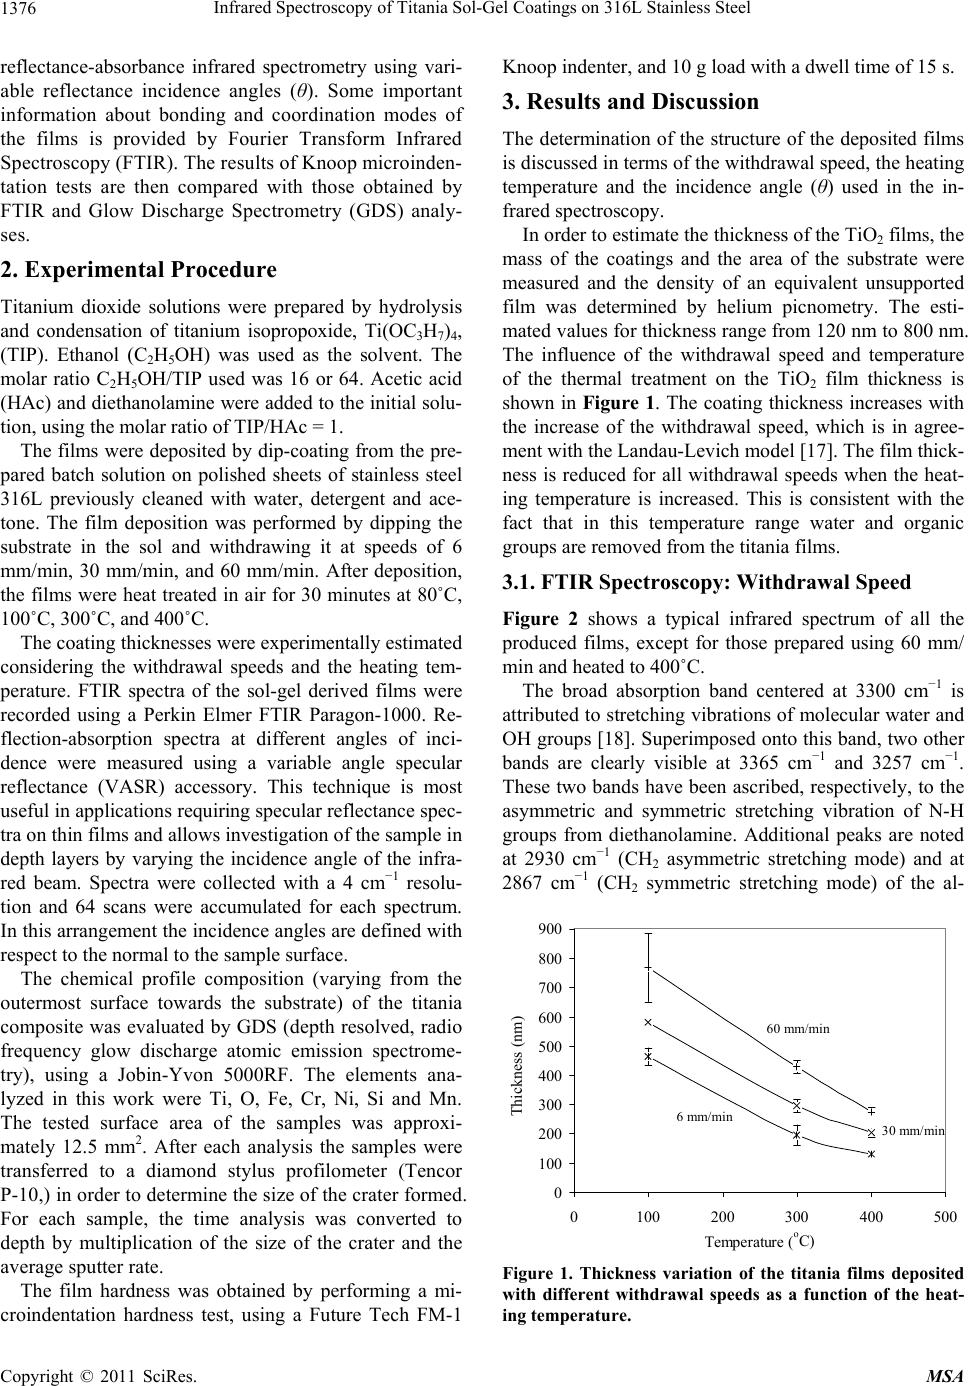 Infrared Spectroscopy of Titania Sol-Gel Coatings on 316L Stainless Steel 1376 reflectance-absorbance infrared spectrometry using vari- able reflectance incidence angles (θ). Some important information about bonding and coordination modes of the films is provided by Fourier Transform Infrared Spectroscopy (FTIR). The results of Knoop microinden- tation tests are then compared with those obtained by FTIR and Glow Discharge Spectrometry (GDS) analy- ses. 2. Experimental Procedure Titanium dioxide solutions were prepared by hydrolysis and condensation of titanium isopropoxide, Ti(OC3H7)4, (TIP). Ethanol (C2H5OH) was used as the solvent. The molar ratio C2H5OH/TIP used was 16 or 64. Acetic acid (HAc) and diethanolamine were added to the initial solu- tion, using the molar ratio of TIP/HAc = 1. The films were deposited by dip-coating from the pre- pared batch solution on polished sheets of stainless steel 316L previously cleaned with water, detergent and ace- tone. The film deposition was performed by dipping the substrate in the sol and withdrawing it at speeds of 6 mm/min, 30 mm/min, and 60 mm/min. After deposition, the films were heat treated in air for 30 minutes at 80˚C, 100˚C, 300˚C, and 400˚C. The coating thicknesses were experimentally estimated considering the withdrawal speeds and the heating tem- perature. FTIR spectra of the sol-gel derived films were recorded using a Perkin Elmer FTIR Paragon-1000. Re- flection-absorption spectra at different angles of inci- dence were measured using a variable angle specular reflectance (VASR) accessory. This technique is most useful in applications requiring specular reflectance spec- tra on thin films and allows investigation of the sample in depth layers by varying the incidence angle of the infra- red beam. Spectra were collected with a 4 cm−1 resolu- tion and 64 scans were accumulated for each spectrum. In this arrangement the incidence angles are defined with respect to the normal to the sample surface. The chemical profile composition (varying from the outermost surface towards the substrate) of the titania composite was evaluated by GDS (depth resolved, radio frequency glow discharge atomic emission spectrome- try), using a Jobin-Yvon 5000RF. The elements ana- lyzed in this work were Ti, O, Fe, Cr, Ni, Si and Mn. The tested surface area of the samples was approxi- mately 12.5 mm2. After each analysis the samples were transferred to a diamond stylus profilometer (Tencor P-10,) in order to determine the size of the crater formed. For each sample, the time analysis was converted to depth by multiplication of the size of the crater and the average sputter rate. The film hardness was obtained by performing a mi- croindentation hardness test, using a Future Tech FM-1 Knoop indenter, and 10 g load with a dwell time of 15 s. 3. Results and Discussion The determination of the structure of the deposited films is discussed in terms of the withdrawal speed, the heating temperature and the incidence angle (θ) used in the in- frared spectroscopy. In order to estimate the thickness of the TiO2 films, the mass of the coatings and the area of the substrate were measured and the density of an equivalent unsupported film was determined by helium picnometry. The esti- mated values for thickness range from 120 nm to 800 nm. The influence of the withdrawal speed and temperature of the thermal treatment on the TiO2 film thickness is shown in Figure 1. The coating thickness increases with the increase of the withdrawal speed, which is in agree- ment with the Landau-Levich model [17]. The film thick- ness is reduced for all withdrawal speeds when the heat- ing temperature is increased. This is consistent with the fact that in this temperature range water and organic groups are removed from the titania films. 3.1. FTIR Spectroscopy: Withdrawal Speed Figure 2 shows a typical infrared spectrum of all the produced films, except for those prepared using 60 mm/ min and heated to 400˚C. The broad absorption band centered at 3300 cm−1 is attributed to stretching vibrations of molecular water and OH groups [18]. Superimposed onto this band, two other bands are clearly visible at 3365 cm−1 and 3257 cm−1. These two bands have been ascribed, respectively, to the asymmetric and symmetric stretching vibration of N-H groups from diethanolamine. Additional peaks are noted at 2930 cm−1 (CH2 asymmetric stretching mode) and at 2867 cm−1 (CH2 symmetric stretching mode) of the al- 0 100 200 300 400 500 600 700 800 900 0100200 300400 500 Temperature ( o C) Thickness (nm) . 60 mm/min 30 mm/min 6 mm/min Figure 1. Thickness variation of the titania films deposited with different withdrawal speeds as a function of the heat- ing temperature. Copyright © 2011 SciRes. MSA  Infrared Spectroscopy of Titania Sol-Gel Coatings on 316L Stainless Steel 1377 30060090012001500180021 0024002700300033003600 Wavenumber (cm -1 ) Absorbance (a.u.) . as (OH), (NH), as (NH 2 ) s (NH 2 ) as (CH 2 ) s (CH 2 ) as (CO O) s (CO O) (C=O) (CH 3 ) (Ti-O-C) (Ti-O) (Ti-O-Ti) (Ti-O-Ti) (Ti-O-T i Figure 2. Infrared spectrum ( = 80˚) of sol-gel titania film deposited at 30 mm/min and heated to 400˚C. νas = asym- metric stretching mode; νs = symmetric stretching mode; δ = angular deformation mode. coxide [19,20]. Even in films heated up to 100˚C the band around 1750 - 1735 cm−1, characteristic of the stretch vibration of the C=O bonds of free carboxylic acids, is absent. This excludes the presence of an ester from the reaction of titanium isopropoxide with acetic acid in the sol-gel coat- ing [20]. According to Urlaub et al. [20] and Venz et al. [21], three coordination modes of carboxylic acids to a metal atom are possible, namely monodentate via one oxygen atom, bidendate chelating via both oxygen atoms, and bidendate bridging between two metal atoms (see Figure 3). The absorption bands at 1638 cm−1 and 1445 cm–1 are assigned respectively to the asymmetric as(COO) and symmetric s(COO) stretching vibrations. The presence of these two bands suggests a bidentate bridging coordi- nation for the acid group [22]. The separation of 193 cm−1 observed for the as(COO) and s(COO) peak posi- tions is typical for bidentate bridged carboxylic acid tita- nium complexes [22]. The band at 1080 cm–1 is assigned to the (Ti-O-C) bridging vibrations of isopropoxy groups [20,23]. On adding nucleophilic ligands like acetic acid to titanium isopropoxide, the coordination number of the central atom increases from 4 to 6 and oligomeric species [(Ti(OPri)3(OAc)]n (n = 2 or 3) are formed [16]. In bi- dentate bridging coordinations, the isopropoxy groups are present between two titanium atoms. Our results suggest the formation of a dimeric complex, with the acetic acid acting as a carboxylate ligand, (CH3COO−). The structure complex suggested (see Figure 4) is in agreement with the literature [19,24,25]. Unlike the other samples, the films deposited at 60 mm/min and heated to 400˚C do not exhibit the charac- teristic peaks of the isopropoxy bridging group. In this case, the complex should have the structure proposed in Figure 5, where the titanium atoms are pentacoordinated. Urlaub et al. [20] suggested the same type of structure in complexes formed by titanium isopropoxide and trans- propene-1,2,3-tricarboxilic acid, and also mention the existence of another complex of titanium pentacoordi- nated titanium. The bands related to the as(COO) and s(COO) vibra- tions, which indicate the coordination mode of the ace- tate group in the titanium alcoxide and thus the structure of the molecule formed, are relatively large and may represent the convolutions of two or more signals. This feature is an indication that other different binding modes of acetate group are present. Additional bands were observed at 1560 cm–1, 1380 cm–1, and 1263 cm–1. The bands at 1560 cm–1 and 1263 cm–1 are due to the respective (C=O) and δ(CO) modes [20]. The band at 1380 cm–1 is caused by the symmetric deformation band of a CH3 group from the isopropoxide structure [19,26]. MOR O M O R O MO MO R mo no dentat idendate chelating iden ate bridging as(COO) = 1720 cm-1 s(COO) = 1295 cm-1 (as- ) = 425 cm-1 as(COO) = 1550 cm 1 s(COO) = 1470 cm-1 (a - ) = 80 cm-1 as(COO) = 1590 cm s(COO) = 1430 cm-1 (a - ) = 160 cm-1 Figure 3. Possible coordination modes in metal carboxilates. O CH3 Ti O CH3 OO OROR OR OR OR Ti OR Figure 4. Proposed structure for the complex of titanium isopropoxide and acetic acid. OO CH3 Ti Ti OO CH3 OR OR OR OR OR OR Figure 5. Proposed structure of the complex titanium iso- propoxide-acetic acid for the sol-gel films deposited at 60 mm/min and heated to 400˚C. Copyright © 2011 SciRes. MSA 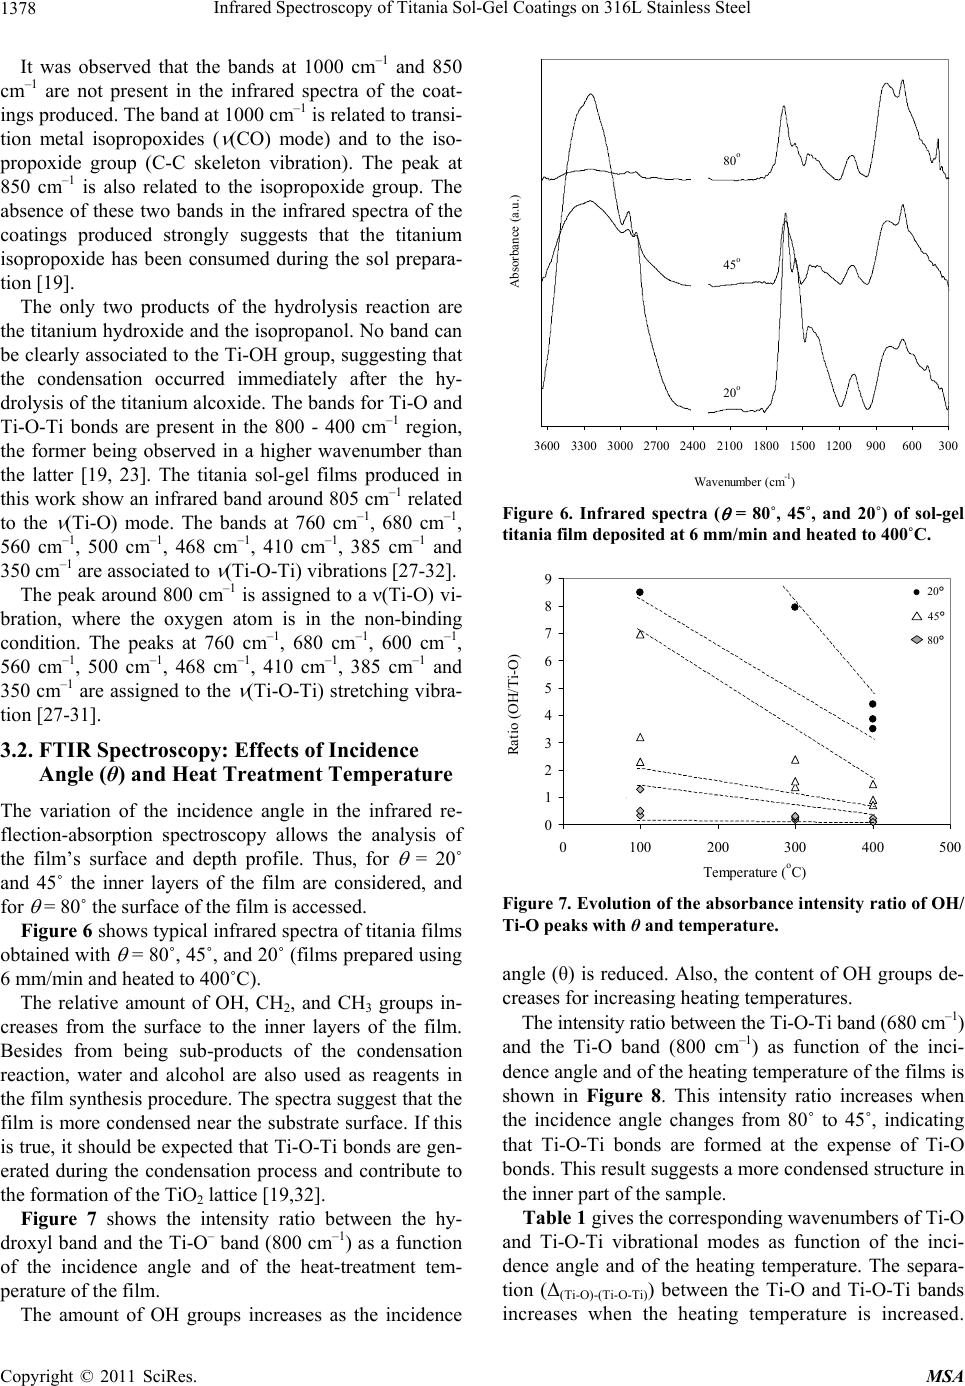 Infrared Spectroscopy of Titania Sol-Gel Coatings on 316L Stainless Steel 1378 It was observed that the bands at 1000 cm–1 and 850 cm–1 are not present in the infrared spectra of the coat- ings produced. The band at 1000 cm–1 is related to transi- tion metal isopropoxides ( (CO) mode) and to the iso- propoxide group (C-C skeleton vibration). The peak at 850 cm–1 is also related to the isopropoxide group. The absence of these two bands in the infrared spectra of the coatings produced strongly suggests that the titanium isopropoxide has been consumed during the sol prepara- tion [19]. The only two products of the hydrolysis reaction are the titanium hydroxide and the isopropanol. No band can be clearly associated to the Ti-OH group, suggesting that the condensation occurred immediately after the hy- drolysis of the titanium alcoxide. The bands for Ti-O and Ti-O-Ti bonds are present in the 800 - 400 cm–1 region, the former being observed in a higher wavenumber than the latter [19, 23]. The titania sol-gel films produced in this work show an infrared band around 805 cm–1 related to the (Ti-O) mode. The bands at 760 cm–1, 680 cm–1, 560 cm–1, 500 cm–1, 468 cm–1, 410 cm–1, 385 cm–1 and 350 cm–1 are associated to (Ti-O-Ti) vibrations [27-32]. The peak around 800 cm–1 is assigned to a ν(Ti-O) vi- bration, where the oxygen atom is in the non-binding condition. The peaks at 760 cm–1, 680 cm–1, 600 cm–1, 560 cm–1, 500 cm–1, 468 cm–1, 410 cm–1, 385 cm–1 and 350 cm–1 are assigned to the (Ti-O-Ti) stretching vibra- tion [27-31]. 3.2. FTIR Spectroscopy: Effects of Incidence Angle (θ) and Heat Treatment Temperature The variation of the incidence angle in the infrared re- flection-absorption spectroscopy allows the analysis of the film’s surface and depth profile. Thus, for = 20˚ and 45˚ the inner layers of the film are considered, and for = 80˚ the surface of the film is accessed. Figure 6 shows typical infrared spectra of titania films obtained with = 80˚, 45˚, and 20˚ (films prepared using 6 mm/min and heated to 400˚C). The relative amount of OH, CH2, and CH3 groups in- creases from the surface to the inner layers of the film. Besides from being sub-products of the condensation reaction, water and alcohol are also used as reagents in the film synthesis procedure. The spectra suggest that the film is more condensed near the substrate surface. If this is true, it should be expected that Ti-O-Ti bonds are gen- erated during the condensation process and contribute to the formation of the TiO2 lattice [19,32]. Figure 7 shows the intensity ratio between the hy- droxyl band and the Ti-O– band (800 cm–1) as a function of the incidence angle and of the heat-treatment tem- perature of the film. The amount of OH groups increases as the incidence 300600900120015001800210024002700300033003600 Wavenumber (c -1 ) Absorbance (a.u.) . 80 o 45 o 20 o Figure 6. Infrared spectra ( = 80˚, 45˚, and 20˚) of sol-gel titania film deposited at 6 mm/min and heated to 400˚C. 0 1 2 3 4 5 6 7 8 9 0100200 300400 500 Temperature (oC) Ratio (OH/Ti-O) . 80o 45o 20o 20° 45° 80° Figure 7. Evolution of the absorbance intensity ratio of OH/ Ti-O peaks with θand temperature. angle (θ) is reduced. Also, the content of OH groups de- creases for increasing heating temperatures. The intensity ratio between the Ti-O-Ti band (680 cm–1) and the Ti-O band (800 cm–1) as function of the inci- dence angle and of the heating temperature of the films is shown in Figure 8. This intensity ratio increases when the incidence angle changes from 80˚ to 45˚, indicating that Ti-O-Ti bonds are formed at the expense of Ti-O bonds. This result suggests a more condensed structure in the inner part of the sample. Table 1 gives the corresponding wavenumbers of Ti-O and Ti-O-Ti vibrational modes as function of the inci- dence angle and of the heating temperature. The separa- tion (Δ(Ti-O)-(Ti-O-Ti)) between the Ti-O and Ti-O-Ti bands increases when the heating temperature is increased. Copyright © 2011 SciRes. MSA 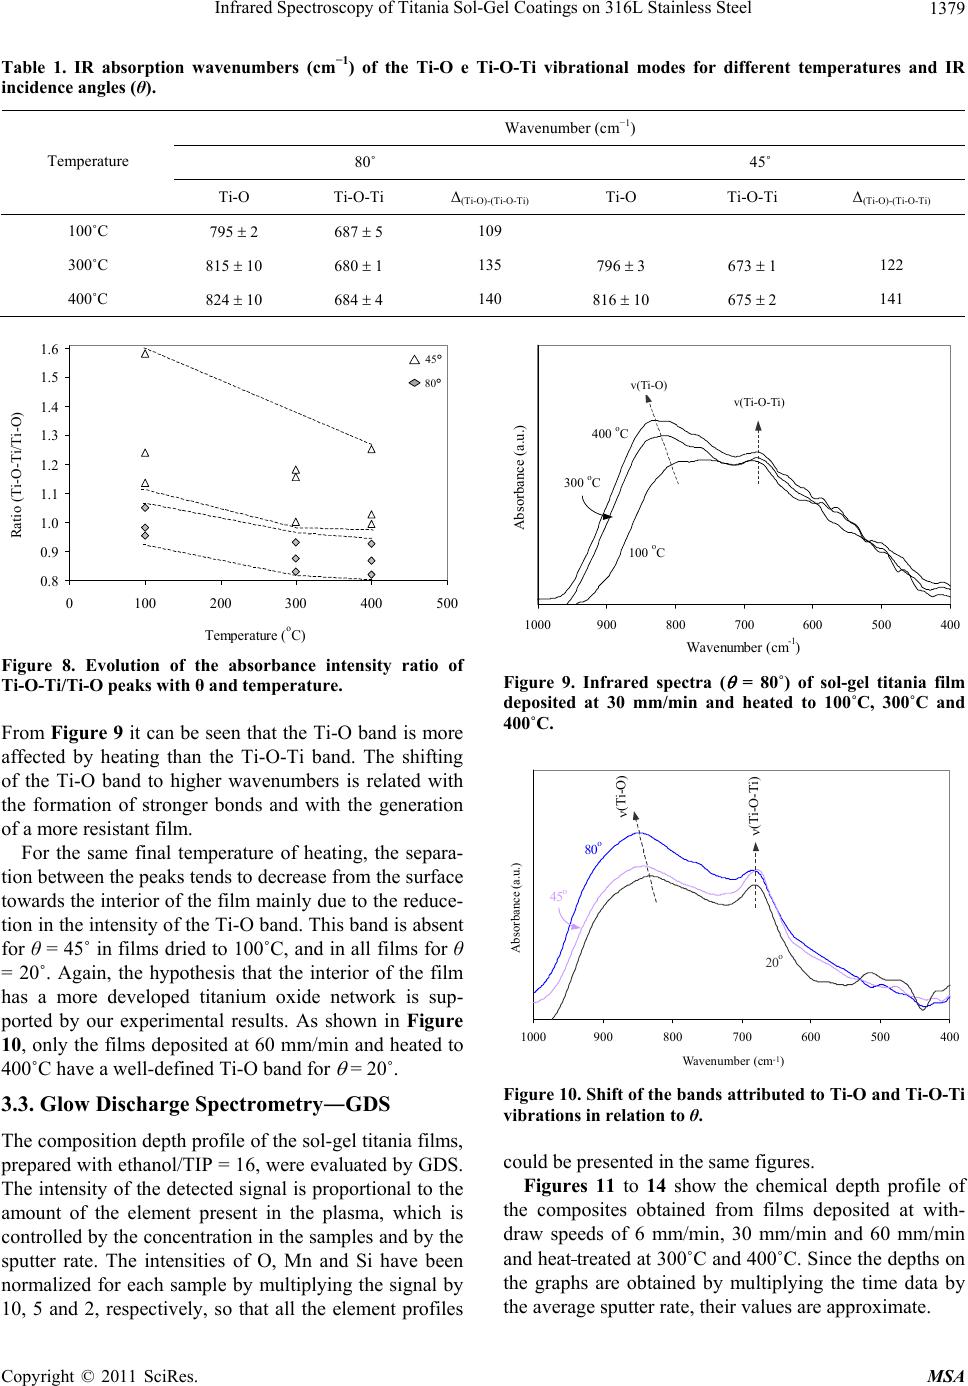 Infrared Spectroscopy of Titania Sol-Gel Coatings on 316L Stainless Steel Copyright © 2011 SciRes. MSA 1379 Table 1. IR absorption wavenumbers (cm−1) of the Ti-O e Ti-O-Ti vibrational modes for different temperatures and IR incidence angles (θ). Wavenumber (cm−1) 80˚ 45˚ Temperature Ti-O Ti-O-Ti Δ(Ti-O)-(Ti-O-Ti) Ti-O Ti-O-Ti Δ(Ti-O)-(Ti-O-Ti) 100˚C 795 2 687 5 109 300˚C 815 10 680 1 135 796 3 673 1 122 400˚C 824 10 684 4 140 816 10 675 2 141 0.8 0.9 1.0 1.1 1.2 1.3 1.4 1.5 1.6 0100200300 400 500 Tem erature o C Ratio (Ti-O-Ti/Ti-O) . 80 o 45 o 45° 80° 4005006007008009001000 Wavenumber (cm -1 ) Absorbance (a.u.) . (Ti-O) (Ti-O-Ti) 100 o C 300 o C 400 o C v(Ti-O) v(Ti-O-Ti) Figure 8. Evolution of the absorbance intensity ratio of Ti-O-Ti/Ti-O peaks with θ and temperature. Figure 9. Infrared spectra ( = 80˚) of sol-gel titania film deposited at 30 mm/min and heated to 100˚C, 300˚C and 400˚C. From Figure 9 it can be seen that the Ti-O band is more affected by heating than the Ti-O-Ti band. The shifting of the Ti-O band to higher wavenumbers is related with the formation of stronger bonds and with the generation of a more resistant film. 4005006007008009001000 (Ti-O Ti-O-Ti 80o 45o 20o Wavenumber (cm -1 ) Absorbance (a.u.) For the same final temperature of heating, the separa- tion between the peaks tends to decrease from the surface towards the interior of the film mainly due to the reduce- tion in the intensity of the Ti-O band. This band is absent for θ = 45˚ in films dried to 100˚C, and in all films for θ = 20˚. Again, the hypothesis that the interior of the film has a more developed titanium oxide network is sup- ported by our experimental results. As shown in Figure 10, only the films deposited at 60 mm/min and heated to 400˚C have a well-defined Ti-O band for = 20˚. Figure 10. Shift of the bands attributed to Ti-O and Ti-O-Ti vibrations in relation to θ. 3.3. Glow Discharge Spectrometry―GDS The composition depth profile of the sol-gel titania films, prepared with ethanol/TIP = 16, were evaluated by GDS. The intensity of the detected signal is proportional to the amount of the element present in the plasma, which is controlled by the concentration in the samples and by the sputter rate. The intensities of O, Mn and Si have been normalized for each sample by multiplying the signal by 10, 5 and 2, respectively, so that all the element profiles could be presented in the same figures. Figures 11 to 14 show the chemical depth profile of the composites obtained from films deposited at with- draw speeds of 6 mm/min, 30 mm/min and 60 mm/min and heat treated at 300˚C and 400˚C. Since the depths on the graphs are obtained by multiplying the time data by the average sputter rate, their values are approximate. 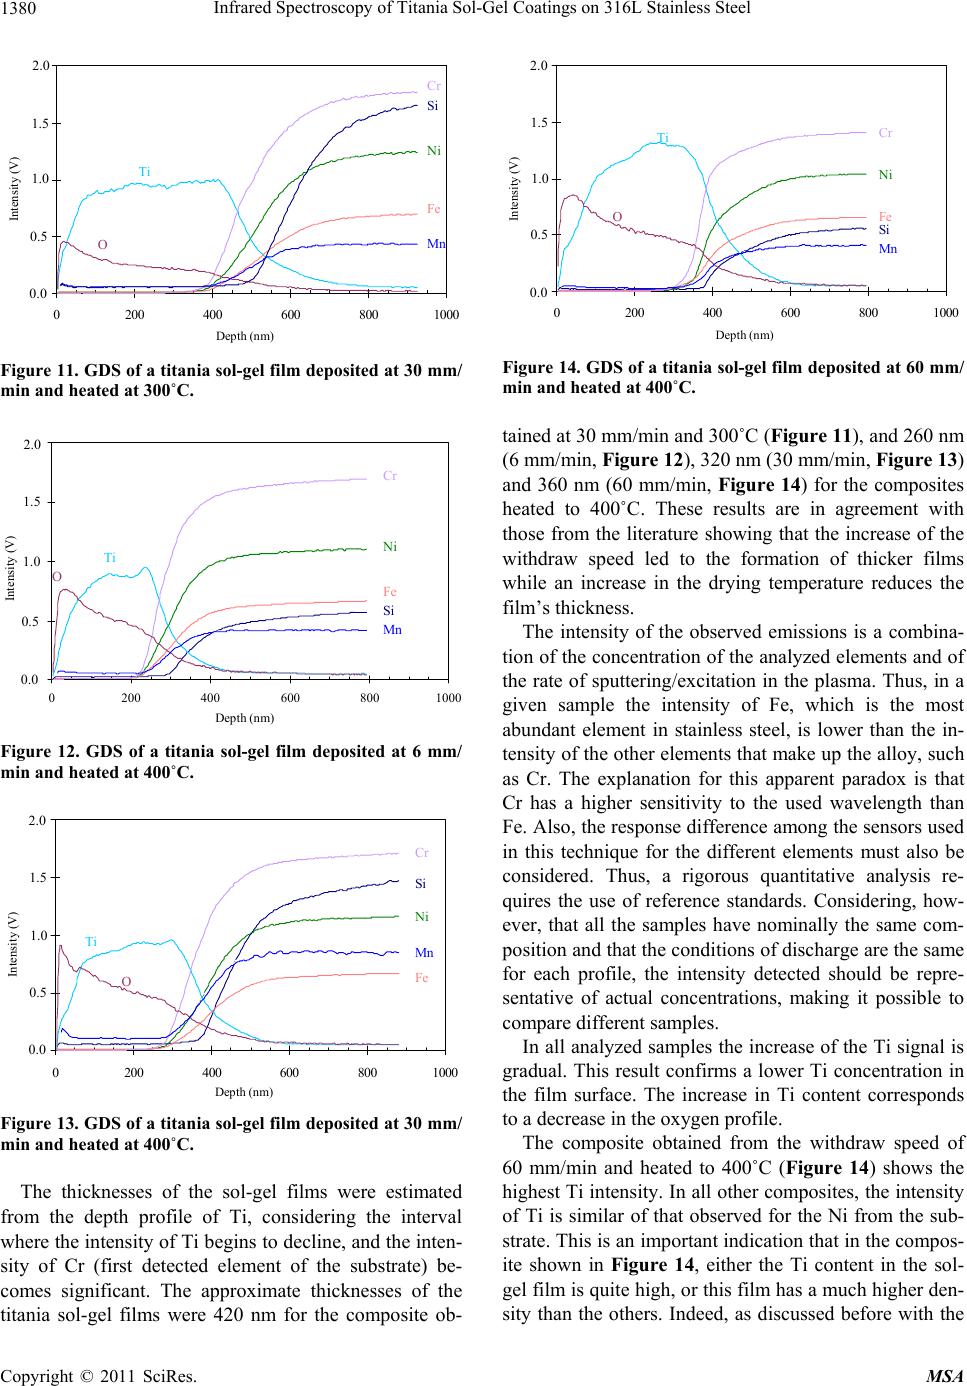 Infrared Spectroscopy of Titania Sol-Gel Coatings on 316L Stainless Steel 1380 0,0 0,5 1,0 1,5 2,0 0200 400 600 800100 Fe i Mn Ti O Si Cr Depth (nm) Intensity (V) 0.0 0.5 1.0 1.5 2.0 Figure 11. GDS of a titania sol-gel film deposited at 30 mm/ min and heated at 300˚C. 0,0 0,5 1,0 1,5 2,0 0200 400600 800100 Fe Mn Ti O Si Cr Depth (nm) Intensity (V) 0.0 0.5 1.0 1.5 2.0 Figure 12. GDS of a titania sol-gel film deposited at 6 mm/ min and heated at 400˚C. 0,0 0,5 1,0 1,5 2,0 0200 400600 800100 Fe i Mn Ti O Si Cr Depth (nm) Intensity (V) 0.0 0.5 1.0 1.5 2.0 Figure 13. GDS of a titania sol-gel film deposited at 30 mm/ min and heated at 400˚C. The thicknesses of the sol-gel films were estimated from the depth profile of Ti, considering the interval where the intensity of Ti begins to decline, and the inten- sity of Cr (first detected element of the substrate) be- comes significant. The approximate thicknesses of the titania sol-gel films were 420 nm for the composite ob- 0,0 0,5 1,0 1,5 2,0 0200400 600 8001000 Fe i Mn Ti O Si Cr Depth (nm) Intensity (V) 0.0 0.5 1.0 1.5 2.0 Figure 14. GDS of a titania sol-gel film deposited at 60 mm/ min and heated at 400˚C. tained at 30 mm/min and 300˚C (Figure 11), and 260 nm (6 mm/min, Figure 12), 320 nm (30 mm/min, Figure 13) and 360 nm (60 mm/min, Figure 14) for the composites heated to 400˚C. These results are in agreement with those from the literature showing that the increase of the withdraw speed led to the formation of thicker films while an increase in the drying temperature reduces the film’s thickness. The intensity of the observed emissions is a combina- tion of the concentration of the analyzed elements and of the rate of sputtering/excitation in the plasma. Thus, in a given sample the intensity of Fe, which is the most abundant element in stainless steel, is lower than the in- tensity of the other elements that make up the alloy, such as Cr. The explanation for this apparent paradox is that Cr has a higher sensitivity to the used wavelength than Fe. Also, the response difference among the sensors used in this technique for the different elements must also be considered. Thus, a rigorous quantitative analysis re- quires the use of reference standards. Considering, how- ever, that all the samples have nominally the same com- position and that the conditions of discharge are the same for each profile, the intensity detected should be repre- sentative of actual concentrations, making it possible to compare different samples. In all analyzed samples the increase of the Ti signal is gradual. This result confirms a lower Ti concentration in the film surface. The increase in Ti content corresponds to a decrease in the oxygen profile. The composite obtained from the withdraw speed of 60 mm/min and heated to 400˚C (Figure 14) shows the highest Ti intensity. In all other composites, the intensity of Ti is similar of that observed for the Ni from the sub- strate. This is an important indication that in the compos- ite shown in Figure 14, either the Ti content in the sol- gel film is quite high, or this film has a much higher den- sity than the others. Indeed, as discussed before with the Copyright © 2011 SciRes. MSA 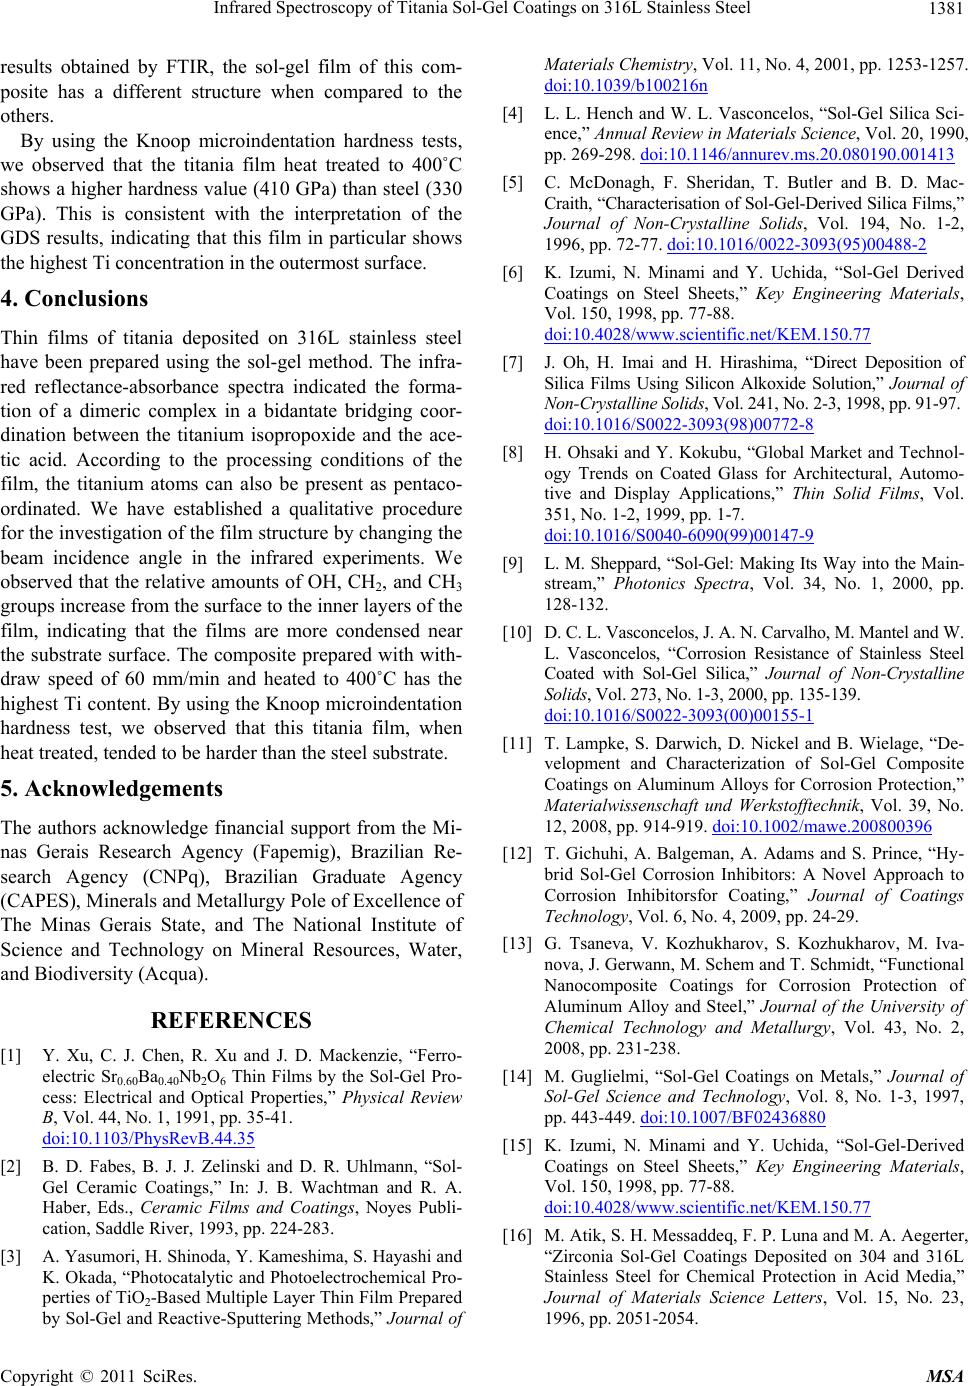 Infrared Spectroscopy of Titania Sol-Gel Coatings on 316L Stainless Steel 1381 results obtained by FTIR, the sol-gel film of this com- posite has a different structure when compared to the others. By using the Knoop microindentation hardness tests, we observed that the titania film heat treated to 400˚C shows a higher hardness value (410 GPa) than steel (330 GPa). This is consistent with the interpretation of the GDS results, indicating that this film in particular shows the highest Ti concentration in the outermost surface. 4. Conclusions Thin films of titania deposited on 316L stainless steel have been prepared using the sol-gel method. The infra- red reflectance-absorbance spectra indicated the forma- tion of a dimeric complex in a bidantate bridging coor- dination between the titanium isopropoxide and the ace- tic acid. According to the processing conditions of the film, the titanium atoms can also be present as pentaco- ordinated. We have established a qualitative procedure for the investigation of the film structure by changing the beam incidence angle in the infrared experiments. We observed that the relative amounts of OH, CH2, and CH3 groups increase from the surface to the inner layers of the film, indicating that the films are more condensed near the substrate surface. The composite prepared with with- draw speed of 60 mm/min and heated to 400˚C has the highest Ti content. By using the Knoop microindentation hardness test, we observed that this titania film, when heat treated, tended to be harder than the steel substrate. 5. Acknowledgements The authors acknowledge financial support from the Mi- nas Gerais Research Agency (Fapemig), Brazilian Re- search Agency (CNPq), Brazilian Graduate Agency (CAPES), Minerals and Metallurgy Pole of Excellence of The Minas Gerais State, and The National Institute of Science and Technology on Mineral Resources, Water, and Biodiversity (Acqua). REFERENCES [1] Y. Xu, C. J. Chen, R. Xu and J. D. Mackenzie, “Ferro- electric Sr0.60Ba0.40Nb2O6 Thin Films by the Sol-Gel Pro- cess: Electrical and Optical Properties,” Physical Review B, Vol. 44, No. 1, 1991, pp. 35-41. doi:10.1103/PhysRevB.44.35 [2] B. D. Fabes, B. J. J. Zelinski and D. R. Uhlmann, “Sol- Gel Ceramic Coatings,” In: J. B. Wachtman and R. A. Haber, Eds., Ceramic Films and Coatings, Noyes Publi- cation, Saddle River, 1993, pp. 224-283. [3] A. Yasumori, H. Shinoda, Y. Kameshima, S. Hayashi and K. Okada, “Photocatalytic and Photoelectrochemical Pro- perties of TiO2-Based Multiple Layer Thin Film Prepared by Sol-Gel and Reactive-Sputtering Methods,” Journal of Materials Chemistry, Vol. 11, No. 4, 2001, pp. 1253-1257. doi:10.1039/b100216n [4] L. L. Hench and W. L. Vasconcelos, “Sol-Gel Silica Sci- ence,” Annual Review in Materials Science, Vol. 20, 1990, pp. 269-298. doi:10.1146/annurev.ms.20.080190.001413 [5] C. McDonagh, F. Sheridan, T. Butler and B. D. Mac- Craith, “Characterisation of Sol-Gel-Derived Silica Films,” Journal of Non-Crystalline Solids, Vol. 194, No. 1-2, 1996, pp. 72-77. doi:10.1016/0022-3093(95)00488-2 [6] K. Izumi, N. Minami and Y. Uchida, “Sol-Gel Derived Coatings on Steel Sheets,” Key Engineering Materials, Vol. 150, 1998, pp. 77-88. doi:10.4028/www.scientific.net/KEM.150.77 [7] J. Oh, H. Imai and H. Hirashima, “Direct Deposition of Silica Films Using Silicon Alkoxide Solution,” Journal of Non-Crystalline Solids, Vol. 241, No. 2-3, 1998, pp. 91-97. doi:10.1016/S0022-3093(98)00772-8 [8] H. Ohsaki and Y. Kokubu, “Global Market and Technol- ogy Trends on Coated Glass for Architectural, Automo- tive and Display Applications,” Thin Solid Films, Vol. 351, No. 1-2, 1999, pp. 1-7. doi:10.1016/S0040-6090(99)00147-9 [9] L. M. Sheppard, “Sol-Gel: Making Its Way into the Main- stream,” Photonics Spectra, Vol. 34, No. 1, 2000, pp. 128-132. [10] D. C. L. Vasconcelos, J. A. N. Carvalho, M. Mantel and W. L. Vasconcelos, “Corrosion Resistance of Stainless Steel Coated with Sol-Gel Silica,” Journal of Non-Crystalline Solids, Vol. 273, No. 1-3, 2000, pp. 135-139. doi:10.1016/S0022-3093(00)00155-1 [11] T. Lampke, S. Darwich, D. Nickel and B. Wielage, “De- velopment and Characterization of Sol-Gel Composite Coatings on Aluminum Alloys for Corrosion Protection,” Materialwissenschaft und Werkstofftechnik, Vol. 39, No. 12, 2008, pp. 914-919. doi:10.1002/mawe.200800396 [12] T. Gichuhi, A. Balgeman, A. Adams and S. Prince, “Hy- brid Sol-Gel Corrosion Inhibitors: A Novel Approach to Corrosion Inhibitorsfor Coating,” Journal of Coatings Technology, Vol. 6, No. 4, 2009, pp. 24-29. [13] G. Tsaneva, V. Kozhukharov, S. Kozhukharov, M. Iva- nova, J. Gerwann, M. Schem and T. Schmidt, “Functional Nanocomposite Coatings for Corrosion Protection of Aluminum Alloy and Steel,” Journal of the University of Chemical Technology and Metallurgy, Vol. 43, No. 2, 2008, pp. 231-238. [14] M. Guglielmi, “Sol-Gel Coatings on Metals,” Journal of Sol-Gel Science and Technology, Vol. 8, No. 1-3, 1997, pp. 443-449. doi:10.1007/BF02436880 [15] K. Izumi, N. Minami and Y. Uchida, “Sol-Gel-Derived Coatings on Steel Sheets,” Key Engineering Materials, Vol. 150, 1998, pp. 77-88. doi:10.4028/www.scientific.net/KEM.150.77 [16] M. Atik, S. H. Messaddeq, F. P. Luna and M. A. Aegerter, “Zirconia Sol-Gel Coatings Deposited on 304 and 316L Stainless Steel for Chemical Protection in Acid Media,” Journal of Materials Science Letters, Vol. 15, No. 23, 1996, pp. 2051-2054. Copyright © 2011 SciRes. MSA 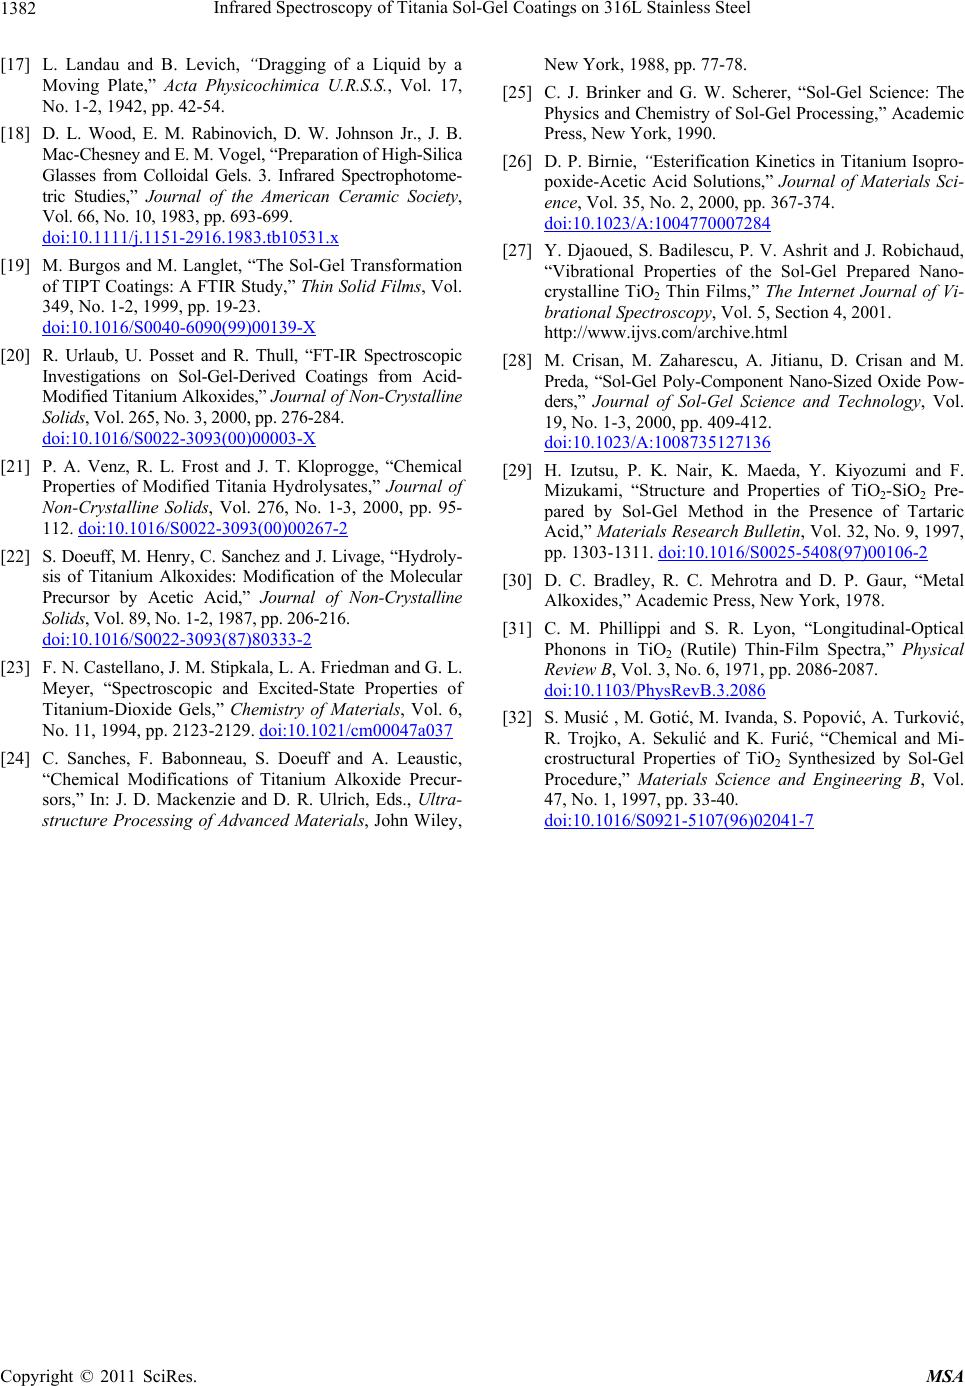 Infrared Spectroscopy of Titania Sol-Gel Coatings on 316L Stainless Steel Copyright © 2011 SciRes. MSA 1382 [17] L. Landau and B. Levich, “Dragging of a Liquid by a Moving Plate,” Acta Physicochimica U.R.S.S., Vol. 17, No. 1-2, 1942, pp. 42-54. [18] D. L. Wood, E. M. Rabinovich, D. W. Johnson Jr., J. B. Mac-Chesney and E. M. Vogel, “Preparation of High-Silica Glasses from Colloidal Gels. 3. Infrared Spectrophotome- tric Studies,” Journal of the American Ceramic Society, Vol. 66, No. 10, 1983, pp. 693-699. doi:10.1111/j.1151-2916.1983.tb10531.x [19] M. Burgos and M. Langlet, “The Sol-Gel Transformation of TIPT Coatings: A FTIR Study,” Thin Solid Films, Vol. 349, No. 1-2, 1999, pp. 19-23. doi:10.1016/S0040-6090(99)00139-X [20] R. Urlaub, U. Posset and R. Thull, “FT-IR Spectroscopic Investigations on Sol-Gel-Derived Coatings from Acid- Modified Titanium Alkoxides,” Journal of Non-Crystalline Solids, Vol. 265, No. 3, 2000, pp. 276-284. doi:10.1016/S0022-3093(00)00003-X [21] P. A. Venz, R. L. Frost and J. T. Kloprogge, “Chemical Properties of Modified Titania Hydrolysates,” Journal of Non-Crystalline Solids, Vol. 276, No. 1-3, 2000, pp. 95- 112. doi:10.1016/S0022-3093(00)00267-2 [22] S. Doeuff, M. Henry, C. Sanchez and J. Livage, “Hydroly- sis of Titanium Alkoxides: Modification of the Molecular Precursor by Acetic Acid,” Journal of Non-Crystalline Solids, Vol. 89, No. 1-2, 1987, pp. 206-216. doi:10.1016/S0022-3093(87)80333-2 [23] F. N. Castellano, J. M. Stipkala, L. A. Friedman and G. L. Meyer, “Spectroscopic and Excited-State Properties of Titanium-Dioxide Gels,” Chemistry of Materials, Vol. 6, No. 11, 1994, pp. 2123-2129. doi:10.1021/cm00047a037 [24] C. Sanches, F. Babonneau, S. Doeuff and A. Leaustic, “Chemical Modifications of Titanium Alkoxide Precur- sors,” In: J. D. Mackenzie and D. R. Ulrich, Eds., Ultra- structure Processing of Advanced Materials, John Wiley, New York, 1988, pp. 77-78. [25] C. J. Brinker and G. W. Scherer, “Sol-Gel Science: The Physics and Chemistry of Sol-Gel Processing,” Academic Press, New York, 1990. [26] D. P. Birnie, “Esterification Kinetics in Titanium Isopro- poxide-Acetic Acid Solutions,” Journal of Materials Sci- ence, Vol. 35, No. 2, 2000, pp. 367-374. doi:10.1023/A:1004770007284 [27] Y. Djaoued, S. Badilescu, P. V. Ashrit and J. Robichaud, “Vibrational Properties of the Sol-Gel Prepared Nano- crystalline TiO2 Thin Films,” The Internet Journal of Vi- brational Spectroscopy, Vol. 5, Section 4, 2001. http://www.ijvs.com/archive.html [28] M. Crisan, M. Zaharescu, A. Jitianu, D. Crisan and M. Preda, “Sol-Gel Poly-Component Nano-Sized Oxide Pow- ders,” Journal of Sol-Gel Science and Technology, Vol. 19, No. 1-3, 2000, pp. 409-412. doi:10.1023/A:1008735127136 [29] H. Izutsu, P. K. Nair, K. Maeda, Y. Kiyozumi and F. Mizukami, “Structure and Properties of TiO2-SiO2 Pre- pared by Sol-Gel Method in the Presence of Tartaric Acid,” Materials Research Bulletin, Vol. 32, No. 9, 1997, pp. 1303-1311. doi:10.1016/S0025-5408(97)00106-2 [30] D. C. Bradley, R. C. Mehrotra and D. P. Gaur, “Metal Alkoxides,” Academic Press, New York, 1978. [31] C. M. Phillippi and S. R. Lyon, “Longitudinal-Optical Phonons in TiO2 (Rutile) Thin-Film Spectra,” Physical Review B, Vol. 3, No. 6, 1971, pp. 2086-2087. doi:10.1103/PhysRevB.3.2086 [32] S. Musić , M. Gotić, M. Ivanda, S. Popović, A. Turković, R. Trojko, A. Sekulić and K. Furić, “Chemical and Mi- crostructural Properties of TiO2 Synthesized by Sol-Gel Procedure,” Materials Science and Engineering B, Vol. 47, No. 1, 1997, pp. 33-40. doi:10.1016/S0921-5107(96)02041-7
|